HMA 4H and 15M overlay Notes:
HMA Calculation: We calculate three HMAs for the 15-minute timeframe (ma1, ma2, ma3) based on the settings from your original script, but only ma3 is plotted to keep it consistent with your initial setup.
4-hour HMA: An additional HMA is calculated for the 4-hour timeframe (hma4h) using the hma3 period since it was the longest in your original setup, which might be suitable for a 4-hour chart comparison.
Plotting: Both the 15-minute ma3 and 4-hour hma4h HMAs are plotted with distinct colors for easy visual differentiation.
Timeframe Security: request.security() is used to fetch data from different timeframes. Remember, using request.security() with historical data can sometimes lead to misalignments or delayed data, especially during live trading.
This script will overlay the 15-minute HMA (using the ma3 from your settings) with a new 4-hour HMA on any chart timeframe you apply it to. Remember, if you're looking at a chart timeframe that's not 15 minutes or 4 hours, the HMAs might appear less smooth or aligned due to how Pine Script handles different timeframes.
Multitimeframe

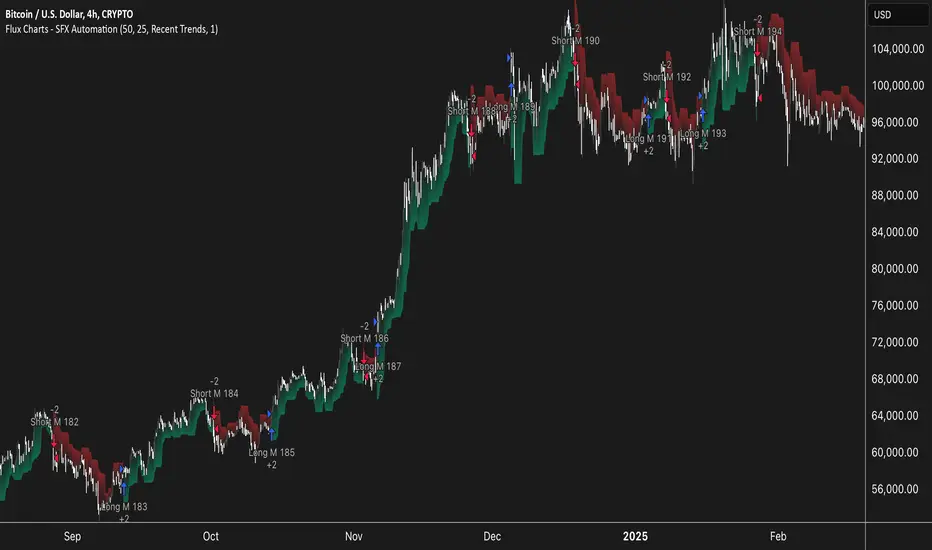
Flux Charts - SFX Automation💎 GENERAL OVERVIEW
The SFX Automation is a powerful and versatile tool designed to help traders rigorously test their trading strategies against historical market data. With various advanced settings, traders can fine-tune their strategies, assess performance, and identify key improvements before deploying in live trading environments. This tool offers a wide range of configurable settings, explained within this write-up.
Features of the new SFX Automation :
Step By Step : Configure your strategy step by step, which will allow you to have OR & AND logic in your strategies.
Highly Configurable : Offers multiple parameters for fine-tuning trade entry and exit conditions.
Multi-Timeframe Analysis : Allows traders to analyze multiple timeframes simultaneously for enhanced accuracy.
Provides advanced stop-loss, take-profit, and break-even settings.
Incorporates Buy & Sell signals, with settings like Signal Sensitivity, Strength, Time Weighting, Dynamic TP & SL Methods and more for refined strategy execution.
🚩 UNIQUENESS
The SFX Automation stands out from conventional backtesting tools due to its unparalleled flexibility, precision, and advanced trading logic integration. Key factors that make it unique include:
✅ Comprehensive Strategy Customization – Unlike traditional backtesters that offer basic entry and exit conditions, SFX Automation provides a highly detailed parameter set, allowing traders to fine-tune their strategies with precision.
✅ Multi-Timeframe Signals – This is the first-ever tool that allows traders to backtest Buy & Sell Signals on multiple timeframes.
✅ Customizable Take-Profit Conditions – Offers various methods to set take-profit exits, including using core features from SFX Algo, and dynamic exits like signal rating upgrades/downgrades, enabling traders to tailor their exit strategies to specific market behaviors.
✅ Customizable Stop-Loss Conditions – Provides several ways to set up stop losses, including using concepts from SFX Algo and trailing stops or dynamic exits like signal rating upgrades/downgrades, allowing for dynamic risk management tailored to individual strategies.
✅ Integration of External Indicators – Allows the inclusion of other indicators or data sources from TradingView for creating strategy conditions, enabling traders to enhance their strategies with additional insights and data points.
By integrating these advanced features, SFX Automation ensures that traders can rigorously test and optimize their strategies with great accuracy and efficiency.
📌 HOW DOES IT WORK ?
The first setting you will want to set it the pyramiding setting. This setting controls the number of simultaneous trades in the same direction allowed in the strategy. For example, if you set it to 1, only one trade can be active in any time, and the second trade will not be entered unless the first one is exited. If it is set to 2, the script will handle both of them at the same time. Note that you should enter the same value to this pyramiding setting, and the pyramiding setting in the "Properties" tab of the script for this to work.
You can enable and set a backtesting window that will limit the entries to between the start date & end date.
Entry Conditions
From the "Long Conditions" or the "Short Conditions" groups, you can set your position entry conditions. For settings like "initial capital" or "order size", you can open the "Properties" tab, where these are handled.
The SFX Algo can use the following conditions for entry conditions :
1. Buy Signal (Any, or 1-5 ☆)
This condition is triggered when a Buy Signal occurs. Other timeframes are supported with this condition.
2. Buy | TP (1, 2 or 3)
This condition is triggered when a TP signal of any Buy signal occurs.
3. Buy | SL
This condition is triggered when a SL signal of any Buy signal occurs.
4. Buy | Rating Upgrade
This condition is triggered when the rating of a buy signal is increased.
5. Buy | Rating Downgrade
This condition is triggered when the rating of a buy signal is decreased.
6. Sell Signal (Any, or 1-5 ☆)
This condition is triggered when a Sell Signal occurs. Other timeframes are supported with this condition.
7. Sell | TP (1, 2 or 3)
This condition is triggered when a TP signal of any Sell signal occurs.
8. Sell | SL
This condition is triggered when a SL signal of any Sell signal occurs.
9. Sell | Rating Upgrade
This condition is triggered when the rating of a sell signal is increased.
10. Sell | Rating Downgrade
This condition is triggered when the rating of a sell signal is decreased.
11. Retracement Wave Retest (Bullish or Bearish)
A retest on the Retracement Wave occurs when the price temporarily moves against the prevailing trend, touching or entering the wave before continuing in the original trend direction. This retest serves as a confirmation that the wave is acting as dynamic support or resistance.
12. Retracement Wave Retracement (Bullish or Bearish)
A retracement on the Retracement Wave occurs when the price touches the wave, the condition is triggered immediately.
13. Volatility Bands Retest (Bullish or Bearish)
A retest of Volatility Bands occurs when the price initially moves beyond the bands, then pulls back to "retest" the band it just broke through before continuing its move. This can provide traders with confirmation of a breakout or signal a potential reversal.
14. Volatility Bands Retracement (Bullish or Bearish)
A retracement on the Volatility Bands occur when the price touches the band, the condition is triggered immediately.
🕒 TIMEFRAME CONDITIONS
The SFX Automation supports Multi-Timeframe (MTF) features for Buy & Sell signals. When setting an entry condition, you can also choose the timeframe.
External Conditions
Users can use external indicators on the chart to set entry conditions.
The second dropdown in the external condition settings allows you to choose a conditional operator to compare external outputs. Available options include:
Less Than or Equal To: <=
Less Than: <
Equal To: =
Greater Than: >
Greater Than or Equal To: >=
The position entry conditions work like this ;
Each side has 3 SFX Algo conditions and 2 Source conditions. Each condition can be enabled or disabled using the checkbox on the left side of them.
You can select which timeframe this condition should work on for Buy & Sell signals. If you select "Chart", the condition will work for the chart's current timeframe.
Lastly select the step of this condition from 1 to 6.
The Source Condition
The last condition on each side is a source condition that is different from the others. Using this condition, you can create your own logic using other indicators' outputs on your chart. For example, suppose that you have an EMA indicator in your chart. You can have the source condition to something like "EMA > high".
The Step System
Each condition has a step number, and conditions are in topological order based on them.
The conditions are executed step by step. This means the condition with step 2 cannot be executed before the condition with step 1 is executed.
Conditions with the same step numbers have "OR" logic. This means that if you have 2 conditions with step 3, the condition with step 4 can trigger after only one of the step 3 conditions is executed.
➕ OTHER ENTRY FEATURES
The SFX Automation allows traders to choose when to execute trades and when not to execute trades.
1. Only Take Trades
This setting lets users specify the time period when their strategy can open or execute trades.
2. Don't Take Trades
This setting lets users specify time periods when their strategy can't open or execute trades.
↩️ EXIT CONDITIONS
1. Exit on Opposite Signal
When enabled, a long position will close when short entry conditions are met, and a short position will close when long entry conditions are met.
2. Exit on Session End
When enabled, positions will be closed at the end of the trading session.
📈 TAKE PROFIT CONDITIONS
There are several methods available for setting take profit exits and conditions.
1. Entry Condition TP
Users can use entry conditions as triggers for take profit exits. This setting can be found under the long and short exit conditions.
2. Fixed TP
Users can set a fixed TP for exits. This setting can be found under the long and short exit conditions. Users can choose between the following:
Price: This method triggers a TP exit when price reaches a specified level. For example, if you set the Price TP to 10 and buy NASDAQ:TSLA at $190, the trade will automatically exit when the price reaches $200 ($190 + $10).
Ticks: This method triggers a TP exit when price moves a specified number of ticks.
Percentage (%): This method triggers a TP exit when price moves a specified percentage.
ATR: This method triggers a TP exit based on a specified multiple of the Average True Range (ATR).
🧩EXIT PERCENTAGES
For each 3 dynamic take-profit conditions, you can set the amount of the position to exit in terms of percentage. It's important to make sure that the total of the exit percentages are 100%.
📉 STOP LOSS CONDITIONS
There are several methods available for setting stop-loss exits and conditions.
1. Entry Condition SL
Users can use entry conditions as triggers for stop-loss exits. This setting can be found under the long and short exit conditions.
2. Fixed SL
Users can set a fixed SL for exits. This setting can be found under the long and short exit conditions. Users can choose between the following:
Price: This method triggers a SL exit when price reaches a specified level. For example, if you set the Price SL to 10 and buy NASDAQ:TSLA at $200, the trade will automatically exit when the price reaches $190 ($200 - $10).
Ticks: This method triggers a SL exit when price moves a specified number of ticks.
Percentage (%): This method triggers a SL exit when price moves a specified percentage.
ATR: This method triggers a SL exit based on a specified multiple of the Average True Range (ATR).
3. Trailing Stop
An explanation & example for the trailing stop feature is present on the write-up within the next section.
Exit conditions have the same logic of constructing conditions like the entry ones. You can construct a Take-Profit Condition & a Stop-Loss Condition. Note that the Take-Profit condition will only work if the position is in profit, regardless of if it's triggered or not. The same applies for the Stop-Loss condition, meaning that it will only work if the position is in loss.
You can also set a Fixed TP & Fixed SL based on the price movement after the position is entered. You have options like "Price", "Ticks", "%", or "Average True Range". For example, you can set a Fixed TP like "5%", and the position will be entered once it moves 5% up in a long position.
Trailing Stop
For the Fixed SL, you also have a "Trailing" stop option, which you can set it's activation level as well. The Trailing stop activation level and it's value are expressed in ticks. Check this scenerio for an example :
We have a ticker with a tick value of $1. Our Trailing Stop is set to 10 ticks, and the activation level is set to 30 ticks.
We buy 1 contract when the price is $100.
When the price becomes $110, we are in $10 (10 ticks) profit and the trailing stop is now activated.
The current price our stop's on is $110 - $30 (30 ticks), which is the level of $80.
The trailing stop will only move if the price moves up the highest high the price has been after we entered the position.
Let's suppose that price moves up $40 right after our trailing stop is activated. The price will now be $150, and our trailing stop will sit on $150 - $30 (30 ticks) = $120.
If the price is down the $120 level, our stop loss will be triggered.
There is also a "Hard SL" option designed for a backup stop-loss when trailing stops are enabled. You can enable & set this option and if the price goes down before our trailing stop even activates, the position will be exited.
You can also move stop-loss to the break-even (entry price of the position) after a certain profit is achieved using the last setting of the exit conditions. Note that for this to work, you will need to have a Fixed SL setup.
➕ OTHER EXIT FEATURES
1. Move Stop Loss to Breakeven
This setting allows the strategy to automatically move the SL to Breakeven (BE) when the position is in profit by a certain amount. Users can choose between the following:
Price: This method moves the SL to BE when price reaches a specified level.
Ticks: This method moves the SL to BE when price moves a specified number of ticks.
Percentage (%): This method moves the SL to BE when price moves a specified percentage.
ATR: This method moves the SL to BE when price moves a specified multiple of the Average True Range (ATR).
Example Entry Scenario
To give an example , check this scenario; out conditions are :
LONG CONDITIONS
Buy Signal Any☆, Step 1
Bullish R. Wave Retest, Step 2
Bullish V. Bands Retest, Step 2
open > close, Step 3
First, the strategy needs to detect a Buy Signal with any star rating in order to start working.
After it's detected, now it's looking for either a Bullish R. Wave Retest, or a Bullish V. Bands Retest to proceed to the next step, the reason for this is that they both have the same step number.
After one of them is detected, the strategy will consistently check candlesticks for the condition open > close. If a bullish candlestick occurs, a long position will be entered.
⏰ ALERTS
This indicator uses TradingView's strategy alert system. All entries and exits will be sent as an alert if configured. It's possible to further customize these alerts to your liking. For more information, check TradingView's strategy alert customization page: www.tradingview.com
⚙️ SETTINGS
1. Backtesting Settings
Pyramiding: Controls the number of simultaneous trades allowed in the strategy. This setting must have the same value that is entered on the script's properties tab on the settings pane.
Enable Custom Backtesting Period: Restricts backtesting to a specific date range.
Start & End Time Configuration: Define precise start and end dates for historical analysis.
2. Algorithm Settings
Sensitivity: The sensitivity setting is a key parameter that influences the number of signals the SFX Algo generates. By adjusting this parameter, you can control the frequency of signals produced by the algorithm.
Signal Strength: The Signal Strength setting filters signals based on their quality, allowing traders to focus on the most reliable opportunities. This feature helps traders balance the quantity and reliability of the algorithm’s signals to suit their trading strategy.
Time Weighting: The Time Weighting setting determines how the SFX Algo evaluates historical market data to generate signals.
a) Recent Trends
Focuses on the most recent movements for short-term analysis. This setting is good for scalpers and intraday traders who need to react quickly to market changes.
b) Mixed Trends
Balances recent and historical price movements for a comprehensive market view. This setting is well-suited for swing traders and those who want to capture medium-term opportunities by combining the benefits of short-term responsiveness with the reliability of long-term trends.
c) Long-term Trends
Relies on extended historical market data to identify broader market trends, making it an excellent choice for traders focused on long-term strategies.
Minimum Star Rating: The Minimum Star Rating setting allows you to filter signals based on their strength, showing only those that meet or exceed your chosen threshold. For instance, setting the minimum star rating to 3 ensures you only receive signals with a rating of 3 stars or higher.
3. Take Profit / Stop Loss Methods
Key Levels
The Key Levels method uses pivot points to set take profit and stop-loss levels. The TP and SL levels are shown when a new signal is generated.
Volatility Bands
This TP/SL method uses the Volatility Bands overlay to set dynamic TP and SL levels. These levels are not predetermined so they will not be shown in advance when a signal is generated.
Signal Rating
Sets take profit and stop-loss levels based on changes in a signal's rating strength. These levels are not predetermined so they will not be shown in advance when a signal is generated.
Auto Stop-Loss
The auto method can only be applied to the SL. The auto method allows the algorithm to detect SL automatically when a momentum shift is detected. You can adjust the risk tolerance of the Auto SL by adjusting the ‘Auto Risk Tolerance’ setting. You can choose between Low, Medium, and High. A high-risk tolerance will result in stop losses being triggered less often.
4. Entry Conditions for Long & Short Trades
Multiple Conditions (1-6): Configure up to six independent conditions per trade direction.
Timeframe Specification: Choose between timeframes for Buy & Sell signals.
Trade Execution Filters: Restrict trades within specific trading sessions.
5. Exit Conditions for Long & Short Trades
Exit on Opposite Signal: Automatically exit trades upon opposite trade conditions.
Exit on Session End: Closes all positions at the end of the trading session.
Multiple Take-Profit (TP) and Stop-Loss (SL) Configurations:
TP/SL based on % move, ATR, Ticks, or Fixed Price.
Hard SL option for additional risk control.
Move SL to BE (Break Even) after a certain profit threshold.
JMA Quantum Edge: Adaptive Precision Trading System JMA Quantum Edge: Adaptive Precision Trading System - Enhanced Visuals & Risk Management
Get ready to experience a groundbreaking trading strategy that adapts in real-time to market conditions! This powerful, open-source script combines advanced technical analysis with state-of-the-art risk management tools, designed to give you the edge you need in today's dynamic markets.
What It Does:
Adaptive JMA Indicator:
Utilizes a custom Jurik Moving Average (JMA) that adjusts its sensitivity based on market volatility, ensuring you get precise signals even in the most fluctuating environments.
Dynamic Risk Management:
Features built-in support for partial exits (scaling out) to secure profits, along with an optional Kelly Criterion-based position sizing that tailors your exposure based on historical performance metrics.
Robust Error Handling:
Incorporates market condition filters—like minimum volume and maximum allowed gap percentage—to ensure trades are only executed under favorable conditions.
Vivid Visual Enhancements:
Enjoy an animated background that reflects market momentum, dynamic pivot markers, and clearly drawn trend channels. Plus, interactive tables provide real-time performance analytics and detailed error metrics.
Fully Customizable:
With a comprehensive set of inputs, you can easily tailor the strategy to your personal trading style and market preferences. Adjust everything from JMA parameters to refresh intervals for tables and labels!
How to Use It:
Add the Script:
Copy and paste the script into the Pine Script Editor on TradingView and click “Add to Chart.”
Configure Your Settings:
Customize your risk management (capital, commission, position sizing, partial exits, etc.) and tweak the JMA settings to match your preferred trading style. Use the extensive input panel to adjust visuals, alerts, and more.
Backtest & Optimize:
Run the strategy in the Strategy Tester to analyze its historical performance. Monitor real-time analytics and error metrics via the interactive tables, and fine-tune your parameters for optimal performance.
Go Live with Confidence:
Once you're satisfied with the backtest results, use the generated signals for live trading, and let the system help you stay ahead in fast-paced markets!
How to use the imputs:
This cutting-edge strategy is designed to adapt to changing market conditions and offers you complete control over your trading parameters. Here’s a breakdown of what each group of inputs does and how you should use them:
Risk Management & Trade Settings
Recalculate on Every Tick:
What it does: When enabled, the strategy recalculates on every price update.
Recommendation: Leave it true for fast charts.
Initial Capital:
What it does: Sets your starting capital for backtesting, which influences position sizing and performance metrics.
Recommendation: Start with $10,000 (or adjust according to your trading capital).
Commission (%):
What it does: Simulates the cost per trade.
Recommendation: Use a realistic rate (e.g., 0.04%).
Position Size & Quantity Type:
What they do: Define how large each trade will be. Choose between a fixed unit amount or a percentage of equity.
Recommendation: For beginners, the default fixed value is a good start. Experiment later with percentage-based sizing if needed.
Order Comment:
What it does: Adds a label to your orders for easier tracking.
Allow Reverse Orders:
What it does: If disabled, the strategy will close opposing positions before entering a new trade, reducing conflicts.
Enable Dynamic Position Sizing:
What it does: Adjusts trade size based on current volatility.
Recommendation: Beginners may start with this disabled until they understand basic sizing.
Partial Exit Inputs:
What they do:
Enable Partial Exits: When turned on, you can scale out of your position to lock in profits.
Partial Exit Profit (%): The profit percentage that triggers a partial exit.
Partial Exit Percentage: The percentage of your current position to exit. Recommendation: Use defaults (e.g., 5% profit, 50% exit) to secure profits gradually.
Kelly Criterion Option:
What it does: When enabled, adjusts your position sizing using historical performance (win rate and profit factor).
Recommendation: Beginners might leave this disabled until comfortable with backtest performance metrics.
Market Condition Filters:
What they do:
Minimum Volume: Ensures trades occur only when there’s sufficient market activity.
Maximum Gap (%): Prevents trading if there’s an unusually large gap between the previous close and current open. Recommendation: Defaults work well for most markets. If trades seem erratic, consider tightening these limits.
JMA Settings
Price Source:
What it does: The input series for the JMA calculation, typically set to the closing price.
JMA Length:
What it does: Controls the smoothing period of the JMA. Lower values are more sensitive; higher values smooth out the noise. Recommendation: Start with 21.
JMA Phase & Power:
What they do: Adjust how responsive the JMA is. Phase controls timing; power adjusts the intensity. Recommendation: Default settings (63 phase and 3 power) are a balanced starting point.
Visual Settings & Style
Show JMA Line, Pivot Lines, and Pivot Labels:
What they do: Toggle visual elements on your chart for easier signal identification.
Pivot History Count:
What it does: Limits how many historical pivot markers are displayed.
Color Settings (Up/Down Neon Colors):
What they do: Set the visual cues for buy and sell signals.
Pivot Marker & Line Style:
What they do: Choose the style and thickness of your pivot markers and lines.
Show Stats Panel:
What it does: Displays real-time performance and error metrics.
Dynamic Background & Visual Enhancements
Animate Background:
What it does: Changes the background color based on market momentum.
Show Trend Channels & Volume Zones:
What they do: Draw trend channels and highlight areas of high volatility/volume.
Show Data-Rich Labels:
What it does: Displays key metrics like volume, error percentage, and momentum on the chart.
High Volatility Threshold:
What it does: Determines the multiplier for when the chart background should change due to high volatility.
Multi-Timeframe Settings
Higher Timeframe:
What it does: Uses a higher timeframe’s JMA for trend confirmation. Recommendation: Use Daily ('D') or Weekly ('W') for broader trend analysis.
Show HTF Trend Zone & Opacity:
What they do: Display a visual zone from the higher timeframe to help confirm trends.
6. Trailing Stop Settings
Trailing Stop ATR Factor & Offset Multiplier:
What they do: Calculate trailing stops based on the Average True Range (ATR), adjusting stop distances dynamically. Recommendation: Default settings are a good balance but can be fine-tuned based on asset volatility.
Alerts & Notifications
Alerts on Pivot Formation & JMA Crossover:
What they do: Notify you when key events occur.
Dynamic Power Threshold:
What it does: Sets the sensitivity for dynamic alerts.
8. Static Stop Loss / Take Profit
Static Stop Loss (%) & Take Profit (%):
What they do: Allow you to set fixed stop loss or take profit levels. Recommendation: Leave them at 0 to disable if you prefer dynamic risk management, or set them if you have strict risk/reward preferences.
Advanced Settings
ATR Length:
What it does: Determines the period for ATR calculation, impacting trailing stop sensitivity. Recommendation: Start with 14.
Optimization Feedback & Enhanced Error Analysis
Error Metric Length & Error Threshold (%):
What they do: Calculate error metrics (like average error, skewness, and kurtosis) to help you fine-tune the JMA. Recommendation: Use the defaults and adjust if the error metrics seem off during backtesting.
UI - User-Driven Tweaking & Table Customization
Parameter Tweaker Panel, Debug/Performance Table Settings:
What they do: Provide interactive tables that display real-time performance, error metrics, and allow you to monitor strategy parameters.
Refresh Frequency Options (Table & Label Refresh Intervals):
What they do: Set how often the tables and labels update.
Recommendation: Start with an interval of 1 bar; increase it if your chart is too busy.
Important for Beginners:
Default Settings:
All default values have been chosen for balanced performance across different markets. If you ever experience unexpected behavior, start by resetting the inputs to their defaults.
Step-by-Step Adjustments:
Experiment by changing one setting at a time while observing how the strategy’s signals and performance metrics change. This will help you understand the impact of each parameter.
Resetting to Defaults:
If things seem off or you’re not getting the expected results, you can always reset the indicator. Either reload the script or use the “Reset Inputs” option (if available) to revert to the default settings.
Jump in, experiment, and enjoy the power of adaptive precision trading. This strategy is built to grow with your skills—have fun exploring and refining your trading edge!
Happy trading!

MTF Support & Resistance📌 Multi-Timeframe Support & Resistance (MTF S&R) Indicator
🔎 Overview:
The MTF Support & Resistance Indicator is a powerful tool designed to help traders identify critical price levels where the market is likely to react. This indicator automatically detects support and resistance zones based on a user-defined lookback period and extends these levels dynamically on the chart. Additionally, it provides multi-timeframe (MTF) support and resistance zones, allowing traders to view higher timeframe key levels alongside their current timeframe.
Support and resistance levels are crucial for traders as they help in determining potential reversal points, breakout zones, and trend continuation signals. By incorporating multi-timeframe analysis, this indicator enhances decision-making by providing a broader perspective of price action.
✨ Key Features & Benefits:
✅ Automatic Support & Resistance Detection – No need to manually plot levels; the indicator calculates them dynamically based on historical price action.
✅ Multi-Timeframe (MTF) Levels – Enables traders to see higher timeframe S&R levels on their current chart for better trend confirmation.
✅ Customizable Lookback Period – Adjust sensitivity by modifying the number of historical bars considered when calculating support and resistance.
✅ Color-Coded Visualization –
Green Line → Support on the current timeframe
Red Line → Resistance on the current timeframe
Dashed Blue Line → Higher timeframe support
Dashed Orange Line → Higher timeframe resistance
✅ Dynamic Extension of Levels – Levels extend left and right for better visibility across multiple bars.
✅ Real-Time Updates – Automatically refreshes as new price data comes in.
✅ Non-Repainting – Ensures reliable support and resistance levels that do not change after the bar closes.
📈 How to Use the Indicator:
Identify Key Price Levels:
The green line represents support, where price may bounce.
The red line represents resistance, where price may reject.
The blue dashed line represents support on a higher timeframe, making it a stronger level.
The orange dashed line represents higher timeframe resistance, helping identify major breakout zones.
Trend Trading:
Look for price action around these levels to confirm breakouts or reversals.
Combine with trend indicators (like moving averages) to validate trade entries.
Range Trading:
If the price is bouncing between support and resistance, consider range trading strategies (buying at support, selling at resistance).
Breakout Trading:
If the price breaks above resistance, it could indicate a bullish trend continuation.
If the price breaks below support, it could signal a bearish trend continuation.
⚙️ Indicator Settings:
Lookback Period: Determines the number of historical bars used to calculate support and resistance.
Show Higher Timeframe Levels (MTF): Enable/disable MTF support and resistance levels.
Extend Bars: Extends the drawn lines for better visualization.
Support/Resistance Colors: Allows users to customize the appearance of the lines.
⚠️ Important Notes:
This indicator does NOT generate buy/sell signals—it serves as a technical tool to improve trading analysis.
Best Used With Other Indicators: Consider combining it with volume, moving averages, RSI, or price action strategies for more reliable trade setups.
Works on Any Market & Timeframe: Forex, stocks, commodities, indices, and cryptocurrencies.
Use Higher Timeframe Levels for Stronger Confirmations: If a higher timeframe support/resistance level aligns with a lower timeframe level, it may indicate a stronger price reaction.
🎯 Who Should Use This Indicator?
📌 Scalpers & Day Traders – Identify short-term support and resistance levels for quick trades.
📌 Swing Traders – Utilize higher timeframe levels for position entries and exits.
📌 Trend Traders – Confirm breakout zones and key price levels for trend-following strategies.
📌 Reversal Traders – Spot potential reversal zones at significant S&R levels.

52-Week & 5-Year High/Low with DatesThis indicator is designed to help traders quickly identify key price levels and their historical context by displaying the 52-week high/low and 5-year high/low prices along with their respective dates. It provides a clear visual representation of these levels directly on the chart and in a dashboard table for easy reference.
Key Features
52-Week High/Low:
Displays the highest and lowest prices over the last 252 trading days (approximately 52 weeks).
Includes the exact date when these levels were reached.
5-Year High/Low:
Displays the highest and lowest prices over the last 1260 trading days (approximately 5 years).
Includes the exact date when these levels were reached.
Visual Labels:
High and low levels are marked on the chart with labels that include the price and date.
Dashboard Table:
A table in the top-right corner of the chart summarizes the 52-week and 5-year high/low prices and their dates for quick reference.
Customizable Date Format:
Dates are displayed in the YYYY-MM-DD format for clarity and consistency.

Tri-Fold BB(Trend-Strength)*indicator isn't preset to look as displayed, do so accordingly*
"Tri-Fold BB" is an indicator that utilizes three Bollinger Bands, each of different length as a way to represent trend strength. This allows one to see the trend strength relative to multiple timeframes: short, mid, and long term trend strength. This is helpful because it provides the user with a holistic view of the asset.
How it Works
The indicator is preset to utilizing three different Bollinger Bands with length: 20, 50, and 100. This indicator simply plots the price of an asset relative to its specified Bollinger Band. For an example, if the price of the asset were to surpass its 20BB standard deviations, it would display so accordingly, though from the perspective of lets say... the 100, it may have looked like it barely moved up a standard deviation relative to 100BB because the standard deviations of a 100BB are more spread out.
Its important to view the trend strength from multiple lengths because it allows one to gauge whether the short term trend strength is likely to hold or not. A better way to speculate on asset behavior.
Another way to view this indicator is similar to that of the BB% indicator, except this indicator allows us to view price relative to standard deviations, across multiple timeframes. More holistic, more utility provided.
Basic Understanding:
Each line = Standard Deviation (3 upper, 3 lower)
Mid-Line = Basis relative to BB(20sma, 50sma, 100sma)
If price goes under Basis, that means it crossed below their specified sma(significant bull or bear signal)
I've also added HMA's relative to each BB incase one were to decide in creating some sort of trading strategy with it. I personally don't use them but I understand that it could be helpful to some so I left it in there. If you don't like them then simply deselect them and then save your desired setup as default.
In regard to regular indications of bullish or bearishness, i'd like to add that I use this indicator for the sole purpose of providing an idea of trend strength. I personally am unsure to state that cross overs directly indicate that there is a bull or bear move because I've seen instances where the price of an asset went in a direction contrary to what it 'should' have if we were to use that cross over strategy. Though of course, feel free to use this indicator as desired.

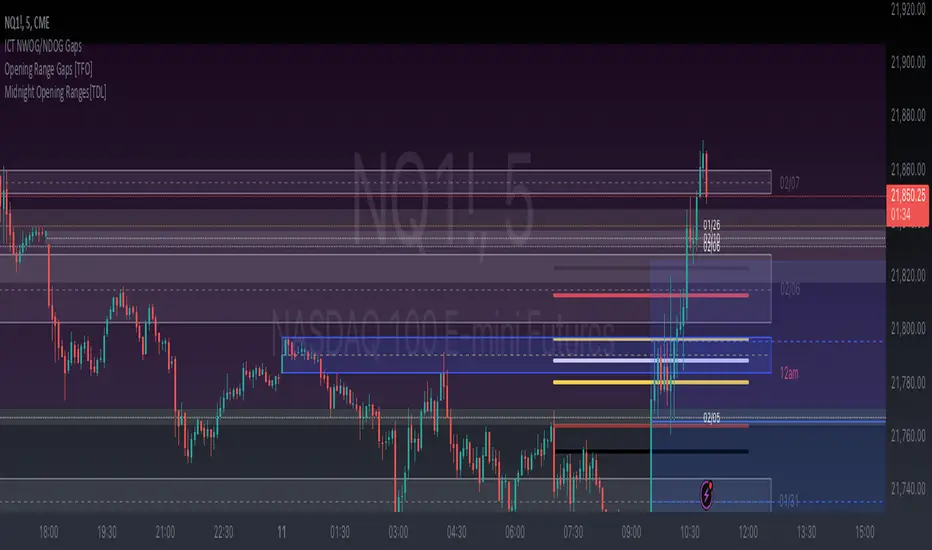
NFP High/Low LevelsThis indicator plots high and low levels with horizontal lines for the last 12 NFP Days
NFP Days are input in the indicator settings
Labels are placed according to the Month and if it is a High or Low price for the NFP Day
Price tracking on each NFP day starts 30 min before market open until market close (0830-1559 EST)
NFP hours are marked at the bottom of the chart to verify the NFP session visually, adjustable in settings
Works for 1H and below timeframes and on Futures
Here is an example of the indicator on NQ1! chart

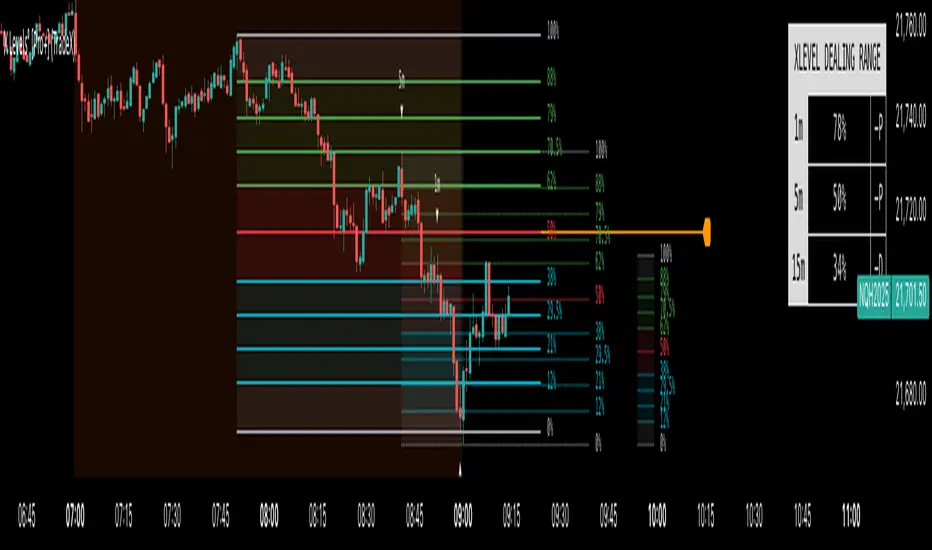
X Levels [Pro+] (TradeX)Introduction:
The X-Levels Indicator is a cutting-edge trading tool to help identify key price levels around Premium / Discount Arrays (PD arrays) at Higher Timeframe Points of Interest. It aids the trader by automatically measuring dealing ranges across multiple Timeframes and highlighting the percentages within which define a Premium & Discount Range. These percentages, known as X-Levels, are where the trader seeks an entry around a relevant PD array. This approach allows a trader to optimize entry and exit points around X-Levels. Suitable for traders of all levels, X-Levels enhances analysts' trade location and framework, providing crucial insights into market movements.
What is an X-Level? A specific percentage within any given dealing range that defines a premium and discount. X Levels are defined as the following percents: 0,12,21,29.5,38,50,61.8,70.5,79,88,100. Percentages below 50% indicate a discount and above 50% indicate a premium.
Foundation: This methodology, developed by TradeX, defines a consistent way for defining dealing ranges and his key percentage levels. Built upon Inner Circle Trader (ICT)’s principles of price delivery, it recognizes that price moves between premium and discount levels, seeking liquidity and inefficiencies.
After extensive refinements, this tool now automates the identification of these dealing ranges across any Timeframe, whilst presenting the X-Levels in a clear and precise manner allowing traders to track price movements with precision and efficiency across multiple time frames.
As price moves between X-Levels, it is the trader’s role to analyze which PD Array offers the best entry opportunity around a given X-Level. The true value of this tool lies in its ability to automatically update Dealing Ranges in real Time, eliminating the need for manual measurement or adjustment. This not only saves Time but also allows analysts to focus on trading rather than manually drawing and updating dealing ranges, removing guess work from defining the correct X Levels dealing range.
When X-Levels are applied across multiple Timeframes, traders gain a comprehensive view of the current market conditions. A key principle of this approach is aligning with price at Higher Timeframe (HTF) Point of Interest. By tracking dealing ranges from HTF while operating in Lower Timeframes, analysts can maintain a granular view while keeping track of the HTF framework.
Explanation of Killzones
Killzones refer to the times when major financial markets are open and active, particularly the London and New York sessions. For example, the London Open Killzone typically runs from 2:00 AM to 4:00 AM Eastern Time, while the New York Killzone is often from 8:00 AM to 10:00 AM Eastern Time. During these times, traders can expect more significant price movements due to higher trading volumes and the overlap of market participants.
The X-Levels indicator includes customizable killzone delineations, allowing traders to tailor this setting to their preferred trading sessions.
Key Opening Prices
Finally, the X-Levels indicator also includes Opening Price Delineations in both Horizontal and Vertical delineation. The "opening price" in trading refers to the first price at which a security is traded when the market opens. This price is significant because it can set the tone for the day's trading and is often used as a reference point for analyzing market movements. We are tracking midnight open, 8:30am and 9:30am. This is due to Midnight Theory.
Midnight Theory:
This is following the principles of Power of 3 (PO3) where if a trader is seeking a bullish expansion on a daily candle he is looking to frame entries below the midnight opening price. The principle of midnight theory comes in the form of buying at a hypothetical discount. A trade entering below midnight would be considered a discount, below midnight and 9:30am on a bullish day would be considered a deep discount.
Settings Summary:
Dealing Ranges: Traders can choose which Timeframe to track and can choose up to a maximum of 3 per chart. The styles of which are fully customizable. Solid lines, dotted lines or dashed lines are all available options for presenting each X-Level on each Dealing Range.
Dealing Range Labels: Above and below each Dealing Range extreme, analysts can find a label marking what Timeframe it originates from to differentiate between multiple Dealing Ranges. The size of this label can be hidden, and if shown its size can be customized.
Customizable Colors: Each Dealing Range Discount, Fair Value, and Premium, can be customized at the choice of the trader to suit their preferences.
Manual Dealing Range: If a trader would like to manually set their own Dealing Range, they can do so by marking the beginning of the Dealing Range view window visually through a tailored Manual Dealing Range setting.
Table Presentation: A table that can be presented in different locations on the chart, showing the percentages in relation to where price is trading in any given active Dealing Range. This is an incredibly useful tool for those wanting to see where they sit across Timeframes quickly.
Killzone Delineations: Traders can customize the Times of their preferred Killzones, whether conventional sessions, or their own preference. Their individual colors can also be customized to the trader's liking and preference.
Opening Prices: Traders can customize the colours to suit preferences and change the line thickness, plus adjust and label size.
Conclusion
The X-Levels Indicator is a powerful tool designed to streamline and enhance a trader’s ability to identify key price levels, track Dealing Ranges automatically, and highlight opportunities around Premium and Discount. By automating the measurement of dealing ranges and dynamically updating X-Levels across multiple Timeframes, this indicator eliminates the need for manual calculations, saving Time and allowing traders to focus on narrative.
When combined with Killzone delineations and Opening Prices, the indicator provides a comprehensive framework for aligning trades within the broader market context.
Whether used by beginners or experienced traders, the X-Levels Indicator empowers market participants with a structured approach to price action, liquidity dynamics, and trade location.
Usage Guidance:
Add X Levels° (TradeX) to your TradingView chart.
Select your preferred Timeframes for Dealing Ranges, Killzones, and Opening Prices.
Automate your analysis process with X Levels° (TradeX) and leverage it into your existing strategies to fine-tune your view through automatic Dealing Range tracking and charting.
Terms and Conditions
Our charting tools are products provided for informational and educational purposes only and do not constitute financial, investment, or trading advice. Our charting tools are not designed to predict market movements or provide specific recommendations. Users should be aware that past performance is not indicative of future results and should not be relied upon for making financial decisions. By using our charting tools, the purchaser agrees that the seller and the creator are not responsible for any decisions made based on the information provided by these charting tools. The purchaser assumes full responsibility and liability for any actions taken and the consequences thereof, including any loss of money or investments that may occur as a result of using these products. Hence, by purchasing these charting tools, the customer accepts and acknowledges that the seller and the creator are not liable nor responsible for any unwanted outcome that arises from the development, the sale, or the use of these products. Finally, the purchaser indemnifies the seller from any and all liability. If the purchaser was invited through the Friends and Family Program, they acknowledge that the provided discount code only applies to the first initial purchase of the Toodegrees Premium Suite subscription. The purchaser is therefore responsible for cancelling – or requesting to cancel – their subscription in the event that they do not wish to continue using the product at full retail price. If the purchaser no longer wishes to use the products, they must unsubscribe from the membership service, if applicable. We hold no reimbursement, refund, or chargeback policy. Once these Terms and Conditions are accepted by the Customer, before purchase, no reimbursements, refunds or chargebacks will be provided under any circumstances.
By continuing to use these charting tools, the user acknowledges and agrees to the Terms and Conditions outlined in this legal disclaimer.
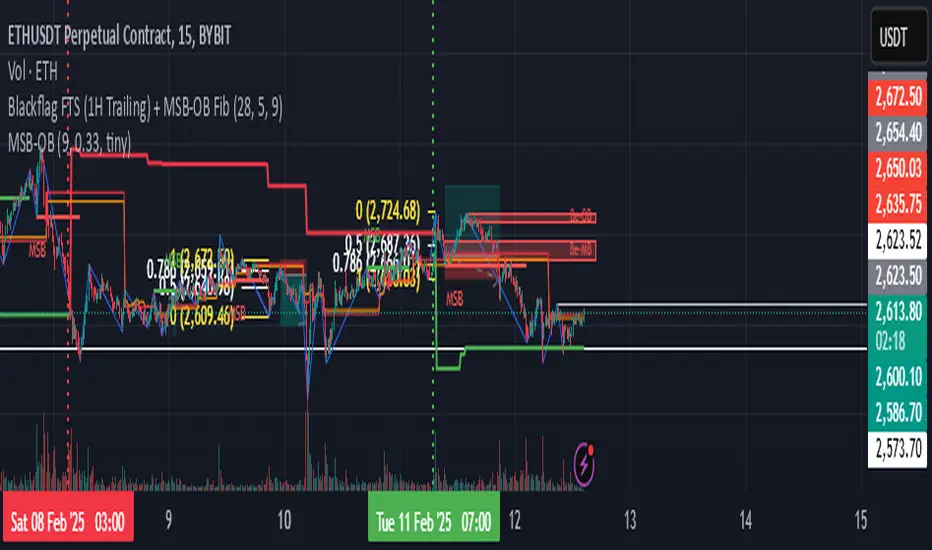
Blackflag FTS (1H Trailing) + MSB-OB FibThis indicator combines a 1-hour trailing stop system with multi-timeframe Fibonacci retracement levels and ZigZag structure detection to assist traders in identifying trend direction and potential reversal zones.
Features:
✅ 1-Hour Trailing Stop: Uses an ATR-based trailing stop mechanism to track trend direction and dynamic support/resistance.
✅ Multi-Timeframe Approach: The trailing stop is calculated on the 1-hour timeframe, while the ZigZag and Fibonacci retracement levels are based on the 15-minute chart.
✅ ZigZag Structure Detection: Helps filter market swings and trend reversals dynamically.
✅ Fibonacci Levels (0.5 & 0.786): Key retracement levels to watch for price reactions.
✅ Alerts for Key Levels: Get notified when the price crosses important levels (1H trailing stop, Fib 0.5, Fib 0.786).
How It Works:
The trailing stop adapts dynamically based on ATR values and determines trend direction.
ZigZag detection filters out minor price movements to highlight major swing points.
Fibonacci levels are calculated based on ZigZag swings, helping traders spot potential reversal zones.
This tool is useful for trend-following traders, breakout traders, and Fibonacci-based strategies.
Let me know if you'd like any modifications! 🚀
Money Flow Index MTF + Alerts with Candle Opacity & LabelsHow to Use the Money Flow Index MTF + Alerts with Candle Opacity & Labels Indicator
Overview:
This indicator is designed to help you gauge the buying and selling pressure in a market by using the Money Flow Index (MFI). Unlike many momentum oscillators, the MFI incorporates both price and volume, providing a unique perspective on market activity. It is particularly useful when you want to visually assess potential overbought or oversold conditions.
Indicator Components:
Money Flow Index (MFI) Calculation:
The indicator computes the MFI using a user-defined look-back period (default is 14 bars). The MFI is scaled between 0 and 100, where values above 80 typically indicate overbought conditions and values below 20 suggest oversold conditions.
Multi-Timeframe (MTF) Capability:
You can choose to calculate the MFI using either the current chart’s timeframe or a custom timeframe (for example, a 4-hour chart). This flexibility allows you to compare longer-term money flow trends against your primary trading timeframe.
Candle Opacity Based on MFI:
The opacity of the candles on your chart is dynamically adjusted based on the current MFI reading. When the MFI is high (near 100), candles become more opaque; when the MFI is low (near 0), candles appear more transparent. This visual cue can help you quickly spot changes in market momentum.
Visual Labels for Overbought/Oversold Conditions:
When the MFI crosses into the overbought territory, a red label reading “Overbought” is displayed above the high of the bar. Similarly, when it crosses into the oversold territory, a green label reading “Oversold” is placed below the low of the bar. These labels provide an immediate visual alert to potential reversal points or areas of caution.
Alert Conditions:
The script also includes alert conditions for both overbought and oversold signals. You can set up TradingView alerts so that you are notified in real time when the indicator detects these conditions.
Theory Behind the Money Flow Index (MFI):
The Money Flow Index is a momentum oscillator that uses both price and volume to signal the strength behind price moves.
Overbought Conditions: When the MFI is above 80, it suggests that buying pressure is very strong and the asset might be due for a pullback or consolidation.
Oversold Conditions: Conversely, when the MFI falls below 20, selling pressure is high and the asset might be oversold, potentially priming it for a bounce.
Keep in mind that in strong trending markets, overbought or oversold readings can persist for extended periods, so the MFI should be used in conjunction with other technical analysis tools.
Position Management Guidance:
While the indicator is useful for spotting potential overbought and oversold conditions, it is not designed to serve as an automatic signal to completely close a position. Instead, you might consider using it as a guide for pyramiding—gradually adding to your position over several days rather than exiting all at once. This approach allows you to better manage risk by:
Scaling In or Out Gradually: Instead of making one large position change, you can add or reduce your position in increments as market conditions evolve.
Diversifying Risk: Pyramiding helps you avoid the pitfalls of trying to time the market perfectly on a single trade exit or entry.
How to Get Started:
Apply the Indicator:
Add the indicator to your TradingView chart. Adjust the input settings (length, oversold/overbought levels, and resolution) as needed for your trading style and the market you’re analyzing.
Watch the Candles:
Observe the dynamic opacity of your candles. A sudden change in opacity can be a sign that the underlying money flow is shifting.
Monitor the Labels:
Pay attention to the “Overbought” or “Oversold” labels that appear. Use these cues in combination with your broader analysis to decide if it might be a good time to add to or gradually exit your position.
Set Up Alerts:
Configure TradingView alerts based on the indicator’s alert conditions so that you are notified when the MFI reaches extreme levels.
Use as Part of a Broader Strategy:
Remember, no single indicator should dictate your entire trading decision. Combine MFI signals with other technical analysis, risk management rules, and market insights to guide your trades.

HTF Trend IdentificationThis indicator identifies higher timeframe (HTF) trends and plots them on the chart. It uses a fixed higher timeframe input and a selectable source to calculate the HTF value. The indicator also plots an EMA and colors the candles based on the HTF trend and EMA crossover.
**Features:**
* **HTF Trend Identification:** Calculates and plots a higher timeframe trend based on a user-defined source and fixed timeframe. This allows you to visualize the larger trend context on your current chart.
* **Repainting Option:** Provides a toggle to control whether the HTF calculation repaints. Disabling repainting ensures that past HTF signals remain fixed, but may introduce a slight lag. Enabling repainting provides more up-to-date signals, but can cause past signals to change.
* **Customizable Colors:** Allows users to set custom colors for uptrends and downtrends.
* **EMA Plot:** Includes an Exponential Moving Average (EMA) plot with a customizable length and offset. The EMA color changes based on the HTF trend.
* **Candle Coloring:** Colors the candles based on the HTF trend, providing a clear visual representation of the overall trend direction.
* **Alerts:** (This would require adding alert conditions to the code, which I can do if you'd like) Could be extended to include alerts for HTF trend changes or EMA crossovers.
**Inputs:**
* **Repainting:** On/Off toggle to control repainting of the HTF calculation.
* **Source:** Select the source for HTF calculations (e.g., close, open, high, low, etc.).
* **Fixed Higher Timeframe:** Set the higher timeframe for trend calculation (e.g., 1D, 4H, 1W). *Note: Timeframes smaller than the current chart's timeframe are not allowed.*
* **Up Color:** Color for uptrends.
* **Down Color:** Color for downtrends.
* **EMA Length 1:** Length of the EMA.
* **Offset:** Offset for the EMA plot.
**How to Use:**
1. Add the indicator to your chart.
2. Configure the inputs to your desired settings.
3. Observe the plotted HTF trend line, EMA, and candle colors to identify potential trading opportunities.
**Limitations:**
* **Repainting:** Enabling repainting can cause past HTF signals to change. Use with caution.
* **No Alerts (by default):** This version does not include alerts. However, this can be added if requested.
**Author:** atulgalande75
**Disclaimer:** This script is for educational purposes only and should not be considered financial advice. Use at your own risk.

Midnight Opening Ranges[TDL]Midnight Opening Range Indicator for TradingView
Description:
The Midnight Opening Range Indicator as taught by Micheal J. Huddleston is a powerful tool designed for traders who want to analyze price action during the critical midnight to 00:30 timeframe. This indicator highlights the opening range for both the current day and previous days, providing valuable insights into market behavior during this specific period. It also calculates and displays deviations from the opening range, as well as allows for custom opening prices to be set, making it highly adaptable to your trading strategy.
Key Features:
Today's Opening Range (00:00 - 00:30):
The indicator plots the high and low of the price range between 00:00 and 00:30 for the current day.
This range is highlighted on the chart, making it easy to identify the initial market movement and potential support/resistance levels.
Previous Days' Opening Ranges:
The indicator also displays the opening ranges for previous days, allowing you to how price reacts off of previous days ranges not just todays.
This feature helps in identifying patterns or recurring behaviors in the market in which price uses this range and previous days ranges throughout the trading day.
Deviations from the Opening Range:
The indicator calculates and plots deviations from the opening range, both above and below the high and low of the range.
These deviations can be used to identify potential breakout or reversal points, giving you an edge in anticipating market moves.
Custom Opening Prices:
The indicator allows you to set custom opening prices, which can be useful if you want to analyze the market based on a specific reference point rather than the default midnight opening.
This feature is particularly useful for traders who follow alternative trading sessions or have specific entry criteria.
Customizable Visuals:
The indicator offers customizable colors and styles for the opening range, deviations, and custom opening prices, allowing you to tailor the visual representation to your preferences.
How to Use:
Identify Key Levels: Use the highlighted opening range to identify key support and resistance levels for the day.
Monitor Deviations: Watch for price movements beyond the opening range deviations to spot potential breakouts or reversals.
Previous Range Data: Use previous days to identify areas of potential AMD.
Set Custom Prices: Adjust the custom opening price to align with your trading strategy or session preferences.
Ideal For:
Day Traders: Perfect for traders who focus on the early hours of the market to capture initial momentum.
Swing Traders: Useful for identifying key levels that could influence price action over several days.
Algorithmic Traders: Can be integrated into automated trading systems to trigger trades based on the opening range and deviations.
Conclusion:
The Midnight Opening Range Indicator is an essential tool for any trader looking to gain an edge in the market by focusing on the critical midnight to 00:30 timeframe. With its ability to highlight opening ranges, calculate deviations, and accommodate custom opening prices, this indicator provides a comprehensive view of market behavior during this pivotal period. Whether you're a day trader, swing trader, or algorithmic trader, this indicator will help you make more informed trading decisions.
Momentum Theory Quick BiasMomentum Theory Quick Bias is a watchlist screener tool for rapid multi-timeframe analysis. It displays a variety of information from higher timeframes in order to set a directional bias including: breakout levels, peak levels, previous bar closes, and swing points.
✅ 8 Symbol Watchlist Scanner
✅ Quickly Set Directional Bias
✅ For Scalpers, Day Traders, and Swing Traders
--- 📷 INDICATOR GALLERY ---
--- 🚀 QUICK LOOK ---
✔ Multi-Timeframe Analysis
Displays various higher timeframe information in order to read how an asset is moving with one quick glance. Utilizes icons and colors that serve as visual cues.
--- ⚡ FEATURES ---
✔ Breakout Bias
Shows if the current price is above or below the breakout level on the timeframe.
✔ Peak Bias
Shows if the current previous peak has been triggered and where price is relative to it.
✔ Previous Bar Close
Shows how the previous bar closed and whether it's bullish or bearish.
Breakout
Fakeout
Inside
Outside
✔ Swing Point
Shows if the timeframe has currently flipped its breakout level.
✔ Bias Alignment
Shows visual icons if there is bias alignment between the timeframes.
↗️↘️ Breakout Bias Alignment
🔼🔽 Peak Bias Alignment
🔀 Breakout and Peak Bias Alignment, but opposite
✅ Breakout and Peak Bias Alignment
✔ Quick Analysis
Hover over the symbol name to view which timeframe levels are bullish or bearish and if peak levels have been triggered.
--- 🔥 OTHER FEATURES ---
✔ Built-In Presets
Create your own custom watchlist or use one of the built-in ones (using Oanda charts)
It's recommended to use the same source for all assets in your watchlist whenever possible
✔ Customized Layouts
Display the watchlist in a variety of different column arrangements.
✔ Dark and Light Modes
Adjustable theme colors to trade your chart the way you want.
✔ Plug-and-Play
Automatically changes the relevant levels depending on the viewed timeframe. Just fill in your watchlist, add it to your chart, and start trading!
Set the indicator to the following timeframes to view those arrangements:
Month Timeframe - Y / 6M / 3M / M
Week Timeframe - 6M / 3M / M / W
Day Timeframe - 3M / M / W / D
H4 Timeframe - Y / M / W / D
M15 Timeframe - M / W / D / H8
M10 Timeframe - M / W / D / H4
M5 Timeframe - W / D / H8 / H2
M3 Timeframe - W / D / H4 / H1
M2 Timeframe - D / H8 / H2 / M30
M1 Timeframe - D / H4 / H1 / M15
--- 📝 HOW TO USE ---
1) Create your watchlist or use one of the built-in presets and place it on the timeframe you want to see. If no watchlist is created, it automatically sets to the current asset.
2) Alignments will trigger in real-time and push to the top of the column.
It is recommended to place the indicator in a different chart window, so it won't have to refresh every time the asset or timeframe changes.

Dynamic SL - 1 Pip (Up and Down)The Dynamic SL - 1 Pip Up and Down indicator creates two dynamic lines that follow the price at a distance of 1 pip above and below the closing price. This feature can be particularly useful for traders who want to visualize small stop-loss (SL) levels or track price movement in a highly responsive manner.
Unlike traditional stop-loss indicators, this script ensures that the lines only last for 5 seconds, keeping the chart clean and focusing only on the most relevant price movement.
Key Features
✔ Dynamic Stop-Loss Visualization:
The script draws a green line above the price (+1 pip).
A red line below the price (-1 pip) is also drawn.
✔ Auto-Clearing for a Clean Chart:
Each line lasts for 5 seconds only before automatically disappearing.
This prevents unnecessary clutter on the chart and ensures only the latest price movements are visualized.
✔ Adaptable to Multiple Assets:
Automatically calculates the pip size based on the instrument type:
Forex → Uses 0.0001 per pip.
Futures & Stocks → Uses the minimum tick size.
✔ Ideal for High-Frequency Traders & Scalpers:
Designed for 1-minute (M1) or lower timeframes where traders need to monitor price action closely.
Helps visualize ultra-tight stop-loss levels in scalping strategies.
3-1 Setup Detector (Multi-Timeframe)📌 3-1 Setup Detector (Multi-Timeframe) – Description
The 3-1 Setup Detector (Multi-Timeframe) is a powerful price action indicator designed for The Strat trading method. It automatically detects 3-1 setups, where an outside bar (3) is followed by an inside bar (1), signaling potential breakout opportunities.
🔥 Key Features:
✅ Multi-Timeframe Support – Works on 1H, 2H, 3H, 4H, 6H, 12H, Daily, 2D, 3D, Weekly, 2W, 3W, Monthly, Quarterly
✅ Real-Time Alerts – Get notified when a 3-1 setup forms
✅ Easy Visualization – Plots markers on the chart for quick recognition
✅ Customizable Timeframe – Select a specific higher timeframe for confirmation
📊 How It Works:
Identifies an outside bar (3), where the high is higher and the low is lower than the previous bar.
Detects an inside bar (1), where the high is lower and the low is higher than the previous bar.
If a 3-1 sequence occurs, the indicator marks the setup on the chart and triggers an alert.
🎯 Trading Applications:
Breakout Strategy: Trade breakouts when the 3-1 setup forms near key levels.
Reversal Signals: Use in combination with support/resistance for confirmation.
Multi-Timeframe Analysis: Detect setups on higher timeframes while trading lower ones.
🚀 Perfect for traders who use The Strat method and want real-time, high-probability trade setups across multiple timeframes!
EMA CROSS v1.0 by ScorpioneroIndicator Description: Multi-Timeframe SMA Table & Plot
This indicator displays a structured table of Simple Moving Averages (SMA) across multiple timeframes and plots them directly on the chart for better trend analysis.
Features:
✅ Multi-Timeframe SMA Calculation: Computes SMAs for different periods (10, 60, and 223) across six timeframes (1m, 3m, 5m, 15m, 30m, 60m).
✅ Sorted SMA Table: Displays a table in the bottom-right corner of the chart, showing the three SMAs per timeframe, sorted in descending order.
✅ Color-Coded Cells: Each SMA is highlighted with a specific color:
🟡 Yellow → 10-period SMA
🔵 Blue → 60-period SMA
🟣 Purple → 223-period SMA
⚪ Gray → Other values
✅ SMA Plotting on the Chart: All calculated SMAs are plotted directly on the price chart, allowing users to visualize their interaction with price movements.
How to Use:
The table provides a quick overview of SMA rankings across timeframes, helping identify bullish or bearish trends.
The SMA plots on the chart can be used for dynamic support/resistance analysis and trend confirmation.
This indicator is ideal for traders who rely on multi-timeframe trend analysis to make informed trading decisions! 🚀
by Scorpionero

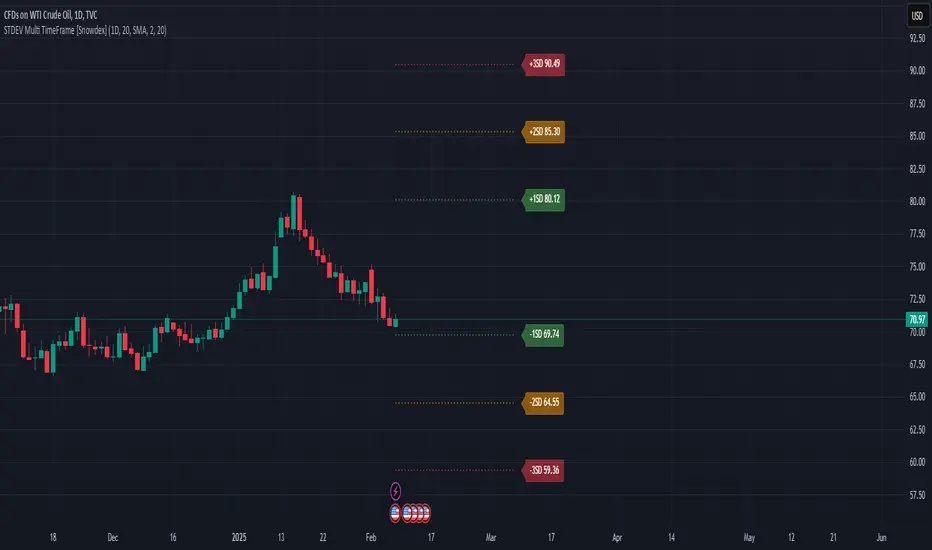
STDEV Multi TimeFrame [Snowdex]STDEV Multi TimeFrame
The STDEV Multi TimeFrame indicator plots standard deviation levels (+1SD, +2SD, +3SD, -1SD, -2SD, -3SD) based on a user-selected timeframe (1D, 1W, 1M, etc.). It helps identify volatility, trend strength, and potential reversal zones using Bollinger Bands-style deviation calculations.
Key Features:
✅ Multi-Timeframe Selection – Choose any timeframe for STDEV calculations.
✅ Customizable Bollinger Bands – Select SMA, EMA, RMA, or WMA as the baseline.
✅ Color-Coded STDEV Levels – Fast (Green), Medium (Orange), Slow (Red).
✅ Non-Repainting & Accurate – Uses request.security() for precise data retrieval.
✅ Extended Lines & Labels – Clear trend monitoring with formatted values.
Use Cases:
📌 Detect trend direction & volatility.
📌 Identify overbought/oversold zones.
📌 Use as dynamic support/resistance levels.
🚀 Ideal for stocks, forex, crypto, and options trading! 🚀
Price Level Multi Timeframe [Snowdex]Price Level Multi-Timeframe Indicator
This indicator visualizes important price levels from multiple timeframes (e.g., daily, weekly, monthly) directly on the chart. It helps traders identify significant support and resistance levels for better decision-making.
Features:
Displays price levels for multiple timeframes: daily (1D), weekly (1W), monthly (1M), quarterly (3M), semi-annual (6M), and yearly (12M).
Customizable options to show or hide levels and adjust their colors.
Highlights high, low, and close levels of each timeframe with labels and dotted lines.
Includes options to extend levels visually for better clarity.
Benefits:
Easily compare price levels across timeframes.
Enhance technical analysis with multi-timeframe insights.
Identify key areas of support and resistance dynamically.

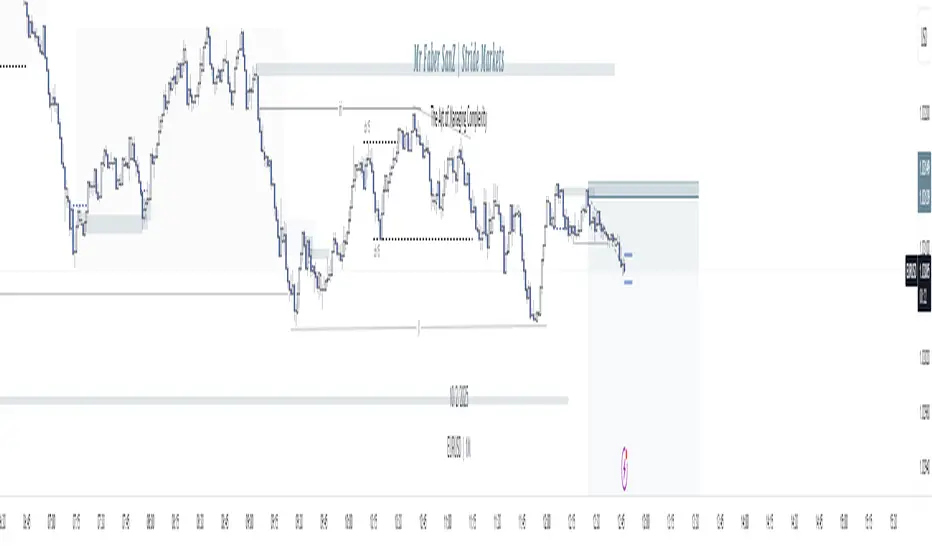
Killzones & Previous High-Low Liquidity [odnac]This indicator is designed for use in intraday trading to visualize key "Killzones" (specific time windows during different global market sessions) and highlight liquidity levels based on previous highs and lows from the previous day and week.
It helps traders identify potential market entry and exit points based on time-based trading zones and price action levels.
Key Features:
Killzone (Market Session Timeframes):
Asia (2000-0000 UTC): Displays a shaded box over the Asia trading session.
Europe (0200-0500 UTC): Highlights the European trading session.
New York AM (0830-1100 UTC): Represents the morning session of the NY market.
New York PM (1330-1600 UTC): Represents the afternoon session of the NY market.
Each of these timeframes can be customized in terms of session start and end times, and the shaded areas will help identify high liquidity periods when the market tends to be more active.
Previous High-Low Liquidity Zones:
Previous Week's High/Low: Displays lines at the high and low of the previous week.
These are important liquidity levels that can influence price action.
Previous Day's High/Low: Shows the high and low from the previous trading day.
These are also significant levels to watch for potential support and resistance.
Filters and Customization:
Position Filtering: The indicator allows users to filter out previous highs or lows if the current price doesn't align with those levels.
For example, it can filter out previous week highs if the current price is lower than that level.
Vertical Lines: Optional vertical lines to highlight key time points such as the start and end of the previous week and day.
How It Works:
The indicator visually draws "killzones" as shaded regions on the chart, indicating periods of increased market activity.
This can help traders align their strategies with the most liquid periods of the day.
The previous high and low lines (both for the previous week and the previous day) are drawn as solid lines and can be toggled on/off in the settings.
Labels are added to indicate the specific levels and periods.
The indicator provides clear visual cues, helping traders assess if the price is near important liquidity levels and whether the current market conditions align with those levels.
Customizable Settings:
You can control whether each Killzone and liquidity level is shown on the chart.
Color customization for the various zones and lines is also available.
The indicator also lets you decide whether to hide weekend data, set time-frame limits, and choose whether or not to show vertical lines at the beginning and end of each trading session.
This indicator is aimed at traders who want to trade based on high-liquidity periods and understand where key support and resistance levels are likely to emerge based on previous price action.
ATM SWIFT ScannerATM SWIFT Scanner is an advanced Volume Spread Analysis (VSA) methodology-based tool to analyse and alert traders to the strength/weakness of the market. It monitors supply and demand dynamics across multiple timeframes and provides an overall as well as timeframe-specific view of the instrument. This allows traders to identify potential turning points and trade accordingly.
The scanner operates by analysing price and volume data on three user-defined or automatically determined timeframes called Higher, Intermediate and Lower. On each time frame it searches bars with a relatively big volume and follows further price/volume activity to decide if a particular timeframe is strong, weak or neutral. Then, based on that defines the overall market picture.
When the market is strong, it also scans, alerts and displays on Intermediate and Lower timeframes the VSA principle Test and when the market is weak the VSA principle No Demand, which in some circumstances could be good entry points to the long and short trades respectively.
Additional features:
- To address the trading style (scalping, intraday, swing or investments), traders may set the sensitivity of big volume bars, which defines the minimal number of bars the volume is the biggest.
- To address very liquid markets, traders may exclude Higher timeframe from the scanning which will identify the changes in the market faster.
The Indicator should be added to the timeframe with the lowest resolution.

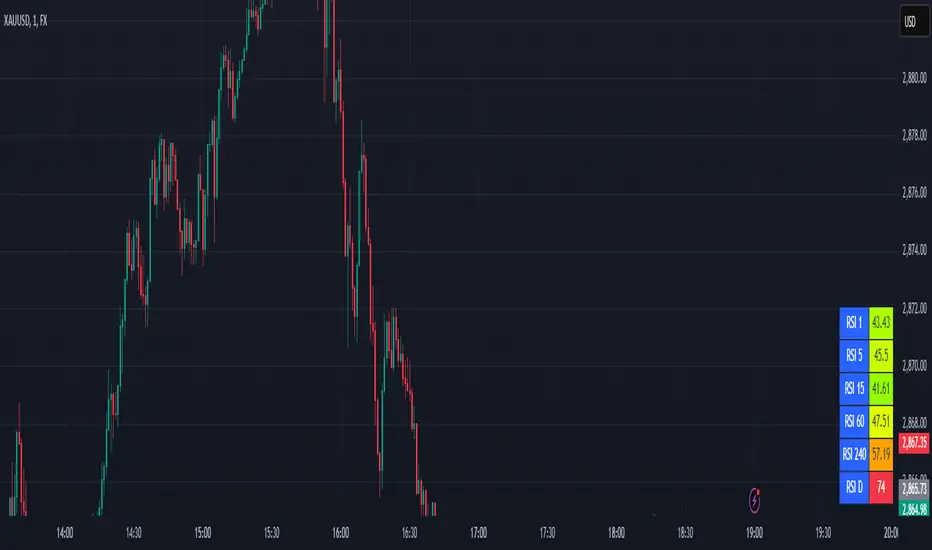
RSI_Board_WarningIndicator Description
Name: Multi-TimeFrame RSI Board with Warnings & Alerts
Purpose:
This indicator calculates and displays the Relative Strength Index (RSI) values for six user-selectable timeframes in a fixed-position table on your chart. It not only shows the current RSI values with dynamic background and text coloring (to reflect overbought and oversold conditions) but also monitors four configurable pairs of timeframes. If both timeframes in a pair are simultaneously oversold or overbought, the indicator triggers an alert condition.
Key Features:
Multi-TimeFrame RSI Calculation:
The indicator uses a single user-defined RSI period (default is 14) to calculate the RSI values.
Six different timeframes (e.g., "1", "5", "15", "60", "240", "D") are available as inputs.
These values are computed using the request.security function and updated in real time.
Fixed RSI Board (Table):
A table is displayed on your chart, fixed to one of the viewport corners (Top Left, Top Right, Bottom Left, or Bottom Right) based on your selection.
The table has a header row that dynamically labels each column with the respective timeframe (e.g., "RSI 1", "RSI 5", etc.).
The data row shows the RSI values for each timeframe, formatted to two decimal places.
Dynamic Cell Coloring and Readable Text:
Each RSI cell’s background color is determined by its value relative to user-defined overbought and oversold thresholds (defaults are 70 and 30, respectively):
Below the oversold threshold: The cell background is green.
Above the overbought threshold: The cell background is red.
Intermediate values: The background color interpolates from green to yellow (if the value is between oversold and 50) and from yellow to red (if the value is between 50 and overbought).
A helper function sets the text color (black or white) dynamically for optimum readability against the colored background.
Warning Pairs and Alert Conditions:
Four warning pairs are defined, each comparing two different timeframes. The default pairs are:
Pair 1: M1 with M5 (e.g., "1" and "5")
Pair 2: M5 with M15 (e.g., "5" and "15")
Pair 3: M30 with H1 (e.g., "30" and "60")
Pair 4: H1 with H4 (e.g., "60" and "240")
For each pair, the indicator calculates RSI values on the two selected timeframes.
An alert condition is triggered if both RSI values in a pair are simultaneously:
Oversold: (i.e., both are below the oversold threshold)
Overbought: (i.e., both are above the overbought threshold)
Since Pine Script requires alert messages to be constant strings, the alert messages are fixed (for example, "Pair 1 oversold: both RSIs are below threshold.").
User Manual
Installation and Setup:
Adding the Indicator:
Open TradingView and navigate to the Pine Script Editor.
Create a new indicator script, paste the complete code provided, and save it.
Add the indicator to your chart.
Configuring the RSI Calculation:
RSI Period: Set the RSI period (default is 14). This period is applied to all timeframe calculations.
Timeframe Inputs for the Board: Enter the six timeframes you want to monitor (for example, "1", "5", "15", "60", "240", "D"). These should be entered as strings.
Setting Thresholds:
Overbought Threshold: Default is 70.
Oversold Threshold: Default is 30.
These thresholds determine the dynamic cell background colors and the alert conditions.
Positioning the RSI Board:
Choose the desired position for the table using the dropdown (e.g., "Top Left"). The table will appear in that fixed corner of your viewport.
Configuring Warning Pairs:
Four warning pairs are provided by default. For each pair, you can choose two timeframes:
Pair 1: Example defaults are "1" and "5".
Pair 2: Example defaults are "5" and "15".
Pair 3: Example defaults are "30" and "60".
Pair 4: Example defaults are "60" and "240".
You can change these values to any valid timeframe strings as desired.
Using the Indicator:
Monitoring the RSI Board:
Once added to your chart, the table will display the RSI values for the six timeframes you configured.
The header row shows labels like "RSI 1", "RSI 5", etc.
The data row displays the RSI values. Each cell’s background color changes dynamically:
Green when the RSI is low (oversold).
Red when the RSI is high (overbought).
A gradient color for intermediate values.
The text color adjusts automatically for readability.
Understanding the Warning Pairs:
The indicator continuously monitors the four warning pairs.
If both RSI values in a pair are simultaneously below the oversold threshold, the indicator triggers an oversold alert for that pair.
If both RSI values in a pair are simultaneously above the overbought threshold, an overbought alert is triggered for that pair.
Setting Up Alerts in TradingView:
Open the TradingView alert dialog.
Select the indicator’s alert conditions (e.g., "Warning Pair 1 Oversold", "Warning Pair 1 Overbought", etc.).
Configure your alert notification settings (sound, email, SMS, etc.).
These alerts will notify you whenever the specified warning conditions are met.
Customization:
Adjust the RSI period, thresholds, timeframes, and warning pair timeframes as needed via the input options.
The alert messages are fixed, but you can modify the code if you wish to change the wording (keeping in mind they must remain constant strings).
Additional Tips:
Testing:
Before relying on the alerts in live trading, test the indicator on historical data to ensure that the warning conditions and dynamic color changes behave as expected.
Further Customizations:
You might consider adding features such as:
Additional rows or columns in the table for other indicators.
More refined gradient or text color functions based on your visual preference.
Extra alert conditions (such as RSI delta changes) if desired.
VMA [Extreme Advanced Custom Table for BTCUSD]This indicator implements a Variable Moving Average (VMA) with a 33-period length—selected in homage to the Tesla 369 concept—to dynamically adjust to market conditions. It not only calculates the adaptive VMA but also displays a custom table of key metrics directly on the chart. Here’s how to use it:
Apply to Your Chart:
Add the indicator to your chart (optimized for BTCUSD, though it can be used on other symbols) and choose your desired source (e.g., close).
Customize Your Visuals:
Trend & Price Lines: Toggle the trend colors, price line, and bar coloring based on the VMA’s direction.
Channels & Slope: Enable the volatility channel and slope line to visualize market volatility and the VMA’s momentum.
Pivot Points & Super VMA: Activate pivot high/low markers for potential reversal points and a Super VMA (SMA of VMA) for an extra smoothing layer.
Table Customization: Adjust the table’s position, colors, and font sizes as needed for your viewing preference.
Monitor Key Metrics:
The dynamic table displays essential information:
VMA Value & Trend: See the current VMA and whether the trend is Bullish, Bearish, or Neutral.
Volatility Index (vI) & Slope: Quickly assess market volatility and the VMA’s slope (both absolute and percentage).
Price-VMA Difference & Correlation: Evaluate how far the price is from the VMA and its correlation.
Higher Timeframe VMA: Compare the current VMA with its higher timeframe counterpart (set via the “Higher Timeframe” input).
Alerts for Key Conditions:
Built-in alert conditions notify you when:
The trend changes (bullish/bearish).
The VMA slope becomes extreme.
The price and VMA correlation falls below a defined threshold.
The VMA crosses its higher timeframe average.
How to Use the Script:
Add to Your Chart:
Open TradingView and apply the indicator to your BTCUSD (or any other) chart.
The indicator will overlay on your chart, plotting the VMA along with optional elements such as the price line, volatility channels, and higher timeframe VMA.
Customize Your Settings:
Inputs:
Choose your data source (e.g., close price).
Adjust the VMA length (default is 33) if desired.
Visual Options:
Toggle trend colors, bar coloring, and additional visuals (price line, volatility channels, slope line, pivot points, and Super VMA) to suit your trading style.
Table Customization:
Set the table position, colors, border width, and font size to ensure key metrics are easily visible.
Higher Timeframe:
You can change the higher timeframe input (default is Daily) to better fit your analysis routine.
Interpret the Indicator:
Trend Analysis:
Watch the color-coded VMA line. A rising (orange) VMA suggests bullish momentum, while a falling (red) one indicates bearish conditions.
What Sets This Script Apart:
Dynamic Adaptation:
Unlike a fixed-period moving average, the VMA adjusts its sensitivity in real time by integrating a volatility measure, making it more adaptive to market swings.
Multi-Layered Analysis:
With integrated volatility channels, pivot points, slope analysis, and a higher timeframe VMA, this tool gives you a fuller picture of market dynamics.
Immediate Data at a Glance:
The real-time table consolidates multiple key metrics into one view, saving time and reducing the need for additional indicators.
Custom Alerts:
Pre-built alert conditions allow for timely notifications, ensuring you don’t miss critical market changes.

Scalping Tool with Dynamic Take Profit & Stop Loss### **Scalping Indicator: Summary and User Guide**
The **Scalping Indicator** is a powerful tool designed for traders who focus on short-term price movements. It combines **Exponential Moving Averages (EMA)** for trend identification and **Average True Range (ATR)** for dynamic stop loss and take profit levels. The indicator is highly customizable, allowing traders to adapt it to their specific trading style and risk tolerance.
---
### **Key Features**
1. **Trend Identification**:
- Uses two EMAs (Fast and Slow) to identify trend direction.
- Generates **Buy Signals** when the Fast EMA crosses above the Slow EMA.
- Generates **Sell Signals** when the Fast EMA crosses below the Slow EMA.
2. **Dynamic Take Profit (TP) and Stop Loss (SL)**:
- **Take Profit (TP)**:
- TP levels are calculated as a percentage above (for long trades) or below (for short trades) the entry price.
- TP levels are **dynamically recalculated** when the price reaches the initial target, allowing for multiple TP levels during a single trade.
- **Stop Loss (SL)**:
- SL levels are calculated using the ATR multiplier, providing a volatility-based buffer to protect against adverse price movements.
3. **Separate Settings for Long and Short Trades**:
- Users can independently enable/disable and configure TP and SL for **Buy** and **Sell** orders.
- This flexibility ensures that the indicator can be tailored to different market conditions and trading strategies.
4. **Visual Signals and Levels**:
- **Buy/Sell Signals**: Clearly marked on the chart with labels ("BUY" or "SELL").
- **TP and SL Levels**: Plotted on the chart for both long and short trades, making it easy to visualize risk and reward.
---
### **How to Use the Scalping Indicator**
#### **1. Setting Up the Indicator**
- Apply the indicator to your chart in TradingView.
- Configure the input parameters based on your trading preferences:
- **Fast Length**: The period for the Fast EMA (default: 5).
- **Slow Length**: The period for the Slow EMA (default: 13).
- **ATR Length**: The period for the ATR calculation (default: 14).
- **Buy/Sell TP and SL**: Enable/disable and set the percentage or ATR multiplier for TP and SL levels.
#### **2. Interpreting the Signals**
- **Buy Signal**:
- When the Fast EMA crosses above the Slow EMA, a "BUY" label appears below the price bar.
- The TP and SL levels for the long trade are plotted on the chart.
- **Sell Signal**:
- When the Fast EMA crosses below the Slow EMA, a "SELL" label appears above the price bar.
- The TP and SL levels for the short trade are plotted on the chart.
#### **3. Managing Trades**
- **Take Profit (TP)**:
- When the price reaches the initial TP level, the indicator automatically recalculates the next TP level based on the new close price.
- This allows traders to capture additional profits as the trend continues.
- **Stop Loss (SL)**:
- The SL level is based on the ATR multiplier, providing a dynamic buffer against market volatility.
- If the price hits the SL level, the trade is considered closed, and the indicator resets.
#### **4. Customization**
- Adjust the **Fast Length** and **Slow Length** to suit your trading timeframe (e.g., shorter lengths for scalping, longer lengths for swing trading).
- Modify the **ATR Multiplier** and **TP Percentage** to align with your risk-reward ratio.
- Enable/disable TP and SL for long and short trades based on your trading strategy.
---
### **Tips for Getting the Best Results**
1. **Combine with Price Action**:
- Use the Scalping Indicator in conjunction with support/resistance levels, candlestick patterns, or other technical analysis tools to confirm signals.
2. **Optimize for Your Timeframe**:
- For **scalping**, use shorter EMA lengths (e.g., Fast: 5, Slow: 13).
- For **swing trading**, use longer EMA lengths (e.g., Fast: 10, Slow: 20).
3. **Adjust Risk Management**:
- Use a smaller **ATR Multiplier** for tighter stop losses in low-volatility markets.
- Increase the **TP Percentage** to allow for larger price movements in high-volatility markets.
4. **Backtest and Practice**:
- Test the indicator on historical data to understand its performance in different market conditions.
- Use a demo account to practice trading with the indicator before applying it to live trading.
---
### **Conclusion**
The **Scalping Indicator** is a versatile and user-friendly tool for traders who want to capitalize on short-term price movements. By combining trend-following EMAs with dynamic TP and SL levels, it provides a clear and systematic approach to trading. Whether you're a scalper or a swing trader, this indicator can help you identify high-probability setups and manage risk effectively. Customize it to fit your strategy, and always remember to combine it with sound risk management principles for the best results.
