F!72 Dynamic Stoch KDJF!72 Dynamic Stoch KDJ
The F!72 Dynamic Stoch KDJ is an advanced momentum oscillator designed to enhance trend identification, overbought/oversold (OB/OS) zone detection, and volatility analysis. By integrating Stochastic RSI with the KDJ framework, this indicator provides a precise and adaptive approach to market dynamics across multiple timeframes.
Core Methodology: Understanding the KDJ Indicator
The KDJ indicator expands upon the traditional Stochastic Oscillator by introducing the J Line, a calculated momentum component that offers enhanced responsiveness to market fluctuations. The three primary components of this indicator are:
%K Line – Measures price momentum relative to recent highs and lows.
%D Line – A smoothed version of %K, acting as a signal confirmation tool.
J Line – A highly sensitive momentum extension, capable of detecting volatility spikes and early trend reversals before standard indicators react.
By incorporating the J Line, the indicator offers a more refined reading of price acceleration and deviation, making it particularly effective in high-volatility environments.
Adaptive Timeframe-Based Parameters
Unlike static oscillators, the F!72 Dynamic Stoch KDJ dynamically adjusts its length parameters based on the chart’s timeframe, optimizing readings for different trading styles:
Scalping Mode (Short-term) – Applied for timeframes up to 60 minutes, prioritizing quick momentum shifts. In those TF, the standard length is 8
Intraday Mode (Medium-term) – Optimized for timeframes between 1 hour and 1 day, balancing responsiveness with trend confirmation. In this cases the standard length of the indicator is 14
Swing/Position Mode (Long-term) – For daily and higher timeframes, filtering out short-term noise to focus on broader market movements. Here, the standard length is 50.
This adaptive parameterization ensures that traders receive relevant and context-specific momentum signals, whether executing short-term scalps or analyzing macro trends.
Key Features & Usability Enhancements
1) Overbought & Oversold Zones with Extreme Levels
Standard OB/OS thresholds at 80 and 20, identifying potential trend exhaustion and reversal points.
Extended extreme zones enhance detection of high probability mean-reversion opportunities in overextended markets.
2) J Line as a Volatility Detector
The J Line excels at capturing sharp price movements, making it a powerful tool for momentum acceleration analysis.
When the J Line sharply diverges from the %K and %D lines, it signals an impending trend shift or breakout.
3) Divergence Detection for Momentum Shifts
Automatic bullish and bearish divergences indicate momentum weakening or trend continuation potential, even when price action seems stable.
Hidden divergences help confirm trend strength during retracements.
4) Smart Alerts for Key Market Events
Alerts trigger when the %K Line enters Overbought/Oversold zones, providing actionable trade setups.
Crossovers between %K and %D Lines highlight potential trend reversals or continuation signals.
5) Customizable Smoothing for Precision Trading
Users can adjust %K and %D smoothing settings, fine-tuning the indicator’s sensitivity based on market conditions and individual trading preferences.
Technical Implementation
Developed in Pine Script V6 , ensuring compatibility with TradingView ’ s standard functions and calculations.
This guarantees accuracy and reliability, with all indicator values reflecting real-time market conditions without external data dependencies.
Disclaimer
This indicator is intended for technical analysis purposes only and does not constitute financial advice. Markets are inherently unpredictable, and past performance is not indicative of future results. Traders should perform independent analysis and apply risk management strategies when utilizing this tool.
Multitimeframe


Early Bird V2.1Early Bird V2.1
The Early Bird is designed for short-term traders looking to enter long positions early and near major or minor support levels. It helps traders trade short term reversals and continuation patterns, making it useful in trending and ranging markets. The indicator also provides take profit signals, assisting traders in managing positions effectively.
Using the Indicator - along with an easily improvable Strategy
Enter position at confirmation of green BUY signal at candle close. Set stop loss at lowest price point of the price swing, usually within 4 candles before entry point, or at -0,5% if the low is too far down.
Take profit at confirmation of TP signal at close of candle, one third of position size per TP signal. After first TP move stop loss to breakeven.
In upward trending markets, add to position at next BUY signal.
The RSI filter helps to avoid weak buy signals by ensuring price momentum is in favour of a long entry. During strong downtrends it less effective.
The indicator allows users to manually set support and resistance levels, and when enabled, prints an affirming signal to any BUY signal that is printed within a set range from the support. Similarly, resistance can be set to strengthen TP signals in accordance with the trader's planned exit and can be used to set take-profit areas to avoid overstaying in a trade.
This feature is particularly useful in ranging markets, where price moves between clear levels.
Timeframe Recommendations
Works best on the 15-minute timeframe for intraday trading.
Not ideal for scalping below the 5-minute timeframe due to increased noise.
Becomes less effective beyond the 1-hour timeframe, as signals become less frequent and less reactive.
Setting Alerts
To set alerts for the indicator’s signals in TradingView:
Right-click on the chart where the indicator is active.
Select "Add Alert" and choose Early Bird V2.1 as the condition.
Choose the type of signal you want to be alerted for:
"Buy Alert" → Notifies when a green buy signal appears.
"Take Profit Alert" → Notifies when an orange take profit signal appears.
"Buy in Support Alert" → Notifies when a buy signal prints near a manual support level.
"Take Profit in Resistance Alert" → Notifies when price reaches a resistance zone.
Adjust alert settings and choose whether you want a sound, popup, or push notification.
Click "Create" to activate the alert.
By using alerts, traders can stay informed without constantly watching the chart, improving efficiency and decision-making.
One very useful way of setting alerts is to set two Buy Alerts, one that sets of upon candle close, and another that sets off once per minute. The entries often require immediate action, so having an alert that warns of an incoming BUY signal can be the difference between making or missing the entry.

[COW] Super Levels V0.1An indicator that shows key levels of the day. This includes, but is not limited to, the daily open close, previous day open and close, the high and low of the current and past day, and more.
Its currently in development, but feel free to check it out! It is useful to see key levels and where the price might stick, reverse, or bust through!

Enhanced DMI with H-LinesEnhanced DMI Indicator with Automatic Help-Lines
This is a classic DMI (Directional Movement Index) indicator with a small but useful customization . Typically, when using DMI, you need to manually add reference lines for each asset to assess trend strength. I found this process tedious—so I automated it with this script.
Important Notice
• This indicator is not for sale .
• You are free to use it as-is forever.
• However, you use it at your own risk – trade responsibly.
Understanding the Indicator Lines
• Yellow (ADX) – Measures trend strength.
• Green (+DI) – Represents positive directional movement.
• Red (-DI) – Represents negative directional movement.
Help-Lines for ADX (Trend Strength)
These reference lines help interpret ADX (yellow line) movement more effectively:
Blue (20) : If the Yellow (ADX) line is below this level, there is no significant trend, and the indicator does not generate signals.
Orange dashed (25) : If the Yellow (ADX) line crosses this level from below, it suggests a potential trade opportunity.
Red dashed (40) : If the Yellow (ADX) line crosses this level, consider closing the trade.
Red solid (60) : If the Yellow (ADX) line crosses this level, it is strongly recommended to close the trade.
Trade Direction Considerations
If the Green (+DI) line is above the Red (-DI) line , consider a long position.
If the Red (-DI) line is above the Green (+DI) line , consider a short position.
Additional Signals for Stronger Confirmation
For a long position: If the green (+DI) line crosses above the orange dashed help-line (25) or a higher level and crosses above the yellow (ADX) line, this is an additional (stronger) signal to enter a long position.
For a short position: If the red (-DI) line crosses above the orange dashed help-line (25) or a higher level and crosses above the yellow (ADX) line, this is an additional (stronger) signal to enter a short position.
This customization simplifies DMI analysis, making it easier to identify trend strength and potential trade opportunities without manually adjusting reference lines. Enjoy and trade wisely!

WaveForgeWaveForge is a custom trend detection algorithm that identifies price deviations by analyzing multi-timeframe price action baselines, Triple Exponential Moving Averages (TEMA), Heikin-Ashi-based moving averages, and Simple Moving Averages (SMA). It highlights potential trading opportunities with color-coded signals, incorporating oversold and overbought (RSI) threshold breaches and the daily open price. This visual approach offers traders a more intuitive way to gauge market conditions and price movement strength.

RSI Targeted Pivots"Targeted RSI Pivots" is an innovative indicator designed to assist traders in identifying potential price targets based on user-defined RSI levels. Unlike traditional RSI indicators, this script calculates and projects pivot levels (L3, L2, L1, P, S1, S2, S3) using a unique algorithm that integrates RSI data from a selectable timeframe. Traders can customize RSI targets, toggle individual levels, and adjust visual settings to suit their analysis needs—all overlaid directly on the price chart for seamless integration into their workflow.
This script stands out by offering a novel approach to RSI-based analysis, combining multi-timeframe RSI calculations with dynamic price projections. It empowers traders with actionable insights into potential support and resistance zones, enhancing decision-making in various market conditions.
The source code is kept closed to protect the proprietary methodology behind the pivot calculations and to safeguard the intellectual property developed through extensive research and testing. By publishing it as a protected script in the Public Library, I aim to share this valuable tool with the TradingView community while preserving the uniqueness of its design. This ensures that traders can benefit from its functionality without compromising the innovative logic that drives it.

18 EMA FVG TBL VWAP • NinaComplete indicator combining Time-Based Liquidity levels with moving averages, FVG's and VWAP confirmation entries

[1% Trader] - Top Down AnalysisTop Down Analysis (TDA) indicator is an algorithm that constructs the Final Swing and identifies trends based on Dow Theory, the Smart Money Concept (SMC), and various technical indicators used by the top 1% of traders in Forex, Crypto, and Stock markets, among others. The Final Swing line is a critical level in price action, as it often acts as a decision point where the price either retests and continues the trend or breaks through, signaling a potential trend reversal.
===== Supporting Evidence =====
- Proven Effectiveness:
Real-world validation from successful traders and algorithmic trading programs
- Statistical Support:
Backtesting and forward testing have shown high predictive accuracy
- AI Pattern Discovery:
When using Unsupervised Reinforcement Learning AI to identify market patterns, one of the discovered patterns closely resembles the logic behind this indicator.


Ultimate Trading Strategy Proراهنمای جامع اندیکاتور Ultimate Trading Strategy Pro
این راهنما به شما کمک میکند تا به طور کامل با اندیکاتور "Ultimate Trading Strategy Pro" آشنا شوید، تنظیمات آن را به درستی پیکربندی کنید، نمودار را تحلیل کرده، سیگنالهای معاملاتی را تفسیر کنید و آلارمهای مورد نیاز خود را تنظیم نمایید.
بخش اول: تنظیمات اندیکاتور
این بخش به توضیح دقیق و کامل تمامی تنظیمات قابل تغییر اندیکاتور میپردازد. هر تنظیم به صورت جداگانه شرح داده شده و راهنمایی برای بهینهسازی آن بر اساس استراتژیهای معاملاتی مختلف ارائه میشود.
گروهبندی تنظیمات: تنظیمات اندیکاتور به گروههای مختلفی تقسیم شدهاند تا دسترسی و درک آنها آسانتر شود:
• General Settings (تنظیمات عمومی): تنظیمات پایه و کلی اندیکاتور.
• EMA Settings (تنظیمات میانگین متحرک نمایی): تنظیمات مربوط به میانگینهای متحرک نمایی سریع و کند.
• SuperTrend Settings (تنظیمات سوپر ترند): تنظیمات مربوط به اندیکاتور سوپر ترند.
• Bollinger Bands Settings (تنظیمات باندهای بولینگر): تنظیمات مربوط به باندهای بولینگر.
• Market Regime Settings (تنظیمات رژیم بازار): تنظیمات مربوط به فیلتر رژیم بازار برای تشخیص شرایط بازار.
• Risk Management (مدیریت ریسک): تنظیمات مربوط به مدیریت ریسک معاملات.
• Signal Filters (فیلترهای سیگنال): تنظیمات مربوط به فیلترهای مختلف برای تایید سیگنالها.
• Visualization Settings (تنظیمات بصری): تنظیمات مربوط به نمایش بصری اندیکاتور روی نمودار.
• Multi-Timeframe Settings (تنظیمات چند تایم فریم): تنظیمات مربوط به استفاده از تحلیل چند تایم فریم.
شرح دقیق تنظیمات:
1. General Settings (تنظیمات عمومی)
o Account Balance (
o )(موجودیحساب() (موجودی حساب ()(موجودیحساب(
)):
توضیح: مقدار اولیه موجودی حساب معاملاتی شما به دلار. این مقدار برای محاسبات مدیریت ریسک استفاده میشود.
مقدار پیشنهادی: مقدار واقعی موجودی حساب خود را وارد کنید.
بهینهسازی: این تنظیم تاثیر مستقیمی بر عملکرد اندیکاتور ندارد اما برای محاسبه دقیق حجم معاملات بر اساس ریسک مدیریت سرمایه ضروری است.
2. EMA Settings (تنظیمات میانگین متحرک نمایی)
o Fast EMA Length (دوره EMA سریع):
توضیح: دوره زمانی محاسبه میانگین متحرک نمایی سریع. EMA سریع به تغییرات قیمت حساستر است.
مقدار پیشنهادی: 20 (برای تایم فریمهای پایینتر و معاملات کوتاهمدت میتوان از مقادیر کمتر مانند 10 یا 12 استفاده کرد).
بهینهسازی:
مقادیر کمتر: سیگنالهای بیشتر و سریعتر، مناسب برای اسکالپینگ و معاملات کوتاهمدت، اما احتمال سیگنالهای اشتباه بیشتر.
مقادیر بیشتر: سیگنالهای کمتر و کندتر، مناسب برای معاملات بلندمدت و شناسایی روندهای قویتر، سیگنالهای اشتباه کمتر.
o Slow EMA Length (دوره EMA کند):
توضیح: دوره زمانی محاسبه میانگین متحرک نمایی کند. EMA کند به تغییرات قیمت حساسیت کمتری دارد و برای شناسایی روند کلی بازار استفاده میشود.
مقدار پیشنهادی: 50 (برای تایم فریمهای پایینتر میتوان از 30 یا 40 و برای تایم فریمهای بالاتر از 100 یا 200 استفاده کرد).
بهینهسازی:
مقادیر کمتر: واکنش سریعتر به تغییرات روند، اما ممکن است تحت تاثیر نوسانات کوتاهمدت قرار گیرد.
مقادیر بیشتر: شناسایی دقیقتر روند اصلی بازار، فیلتر نوسانات کوتاهمدت.
o EMA Source (منبع EMA):
توضیح: قیمت مورد استفاده برای محاسبه EMA.
مقدار پیشنهادی: Close (قیمت بسته شدن کندل).
بهینهسازی: معمولاً قیمت بسته شدن بهترین گزینه است، اما در برخی استراتژیها ممکن است استفاده از قیمتهای High، Low یا Open نیز مفید باشد.
3. SuperTrend Settings (تنظیمات سوپر ترند)
o SuperTrend ATR Period (دوره ATR سوپر ترند):
توضیح: دوره زمانی محاسبه میانگین محدوده واقعی (ATR) برای اندیکاتور سوپر ترند. ATR نوسانات بازار را اندازهگیری میکند.
مقدار پیشنهادی: 10 (برای تایم فریمهای پایینتر میتوان از 7 یا 8 و برای تایم فریمهای بالاتر از 14 یا 20 استفاده کرد).
بهینهسازی:
مقادیر کمتر: سوپر ترند به نوسانات قیمت حساستر میشود و سریعتر تغییر جهت میدهد.
مقادیر بیشتر: سوپر ترند نرمتر و با تاخیر بیشتری تغییر جهت میدهد، مناسب برای فیلتر نوسانات و تمرکز بر روندهای بزرگتر.
o SuperTrend Factor (فاکتور سوپر ترند):
توضیح: ضریب ضرب شده در ATR برای تعیین فاصله باند سوپر ترند از قیمت.
مقدار پیشنهادی: 3.0 (مقادیر بین 2 تا 3 معمولاً استفاده میشوند).
بهینهسازی:
مقادیر کمتر: باند سوپر ترند به قیمت نزدیکتر میشود، سیگنالهای بیشتر و حساستر، اما احتمال سیگنالهای اشتباه بیشتر.
مقادیر بیشتر: باند سوپر ترند از قیمت دورتر میشود، سیگنالهای کمتر و قویتر، فیلتر نوسانات بهتر.
4. Bollinger Bands Settings (تنظیمات باندهای بولینگر)
o BB Length (دوره BB):
توضیح: دوره زمانی محاسبه میانگین متحرک و انحراف معیار برای باندهای بولینگر.
مقدار پیشنهادی: 20 (مقدار استاندارد).
بهینهسازی: مشابه EMA، مقادیر کمتر برای حساسیت بیشتر و مقادیر بیشتر برای نرمتر شدن باندها.
o BB StdDev Multiplier (ضریب انحراف معیار BB):
توضیح: ضریب ضرب شده در انحراف معیار برای تعیین پهنای باندهای بولینگر.
مقدار پیشنهادی: 2.1 (مقادیر بین 2 تا 2.5 معمولاً استفاده میشوند).
بهینهسازی:
مقادیر کمتر: باندهای بولینگر باریکتر میشوند، حساسیت بیشتر به شکست باندها.
مقادیر بیشتر: باندهای بولینگر پهنتر میشوند، نوسانات بیشتری را در بر میگیرند، سیگنالهای شکست باند کمتر.
5. Market Regime Settings (تنظیمات رژیم بازار)
o Enable Market Regime Filter (فعالسازی فیلتر رژیم بازار):
توضیح: فعال یا غیرفعال کردن فیلتر رژیم بازار.
مقدار پیشنهادی: True (فعال).
بهینهسازی: فعال کردن این فیلتر به اندیکاتور کمک میکند تا در شرایط بازار مناسبتر سیگنال دهد و از سیگنالهای نامناسب در بازارهای پر نوسان یا بدون روند جلوگیری کند.
o Regime Lookback Period (دوره بازگشت رژیم):
توضیح: دوره زمانی برای محاسبه نوسانات و قدرت روند بازار برای تشخیص رژیم بازار.
مقدار پیشنهادی: 50.
بهینهسازی: مقادیر کمتر برای واکنش سریعتر به تغییرات رژیم بازار، مقادیر بیشتر برای تشخیص پایدارتر رژیم بازار.
o Volatility Threshold (آستانه نوسانات):
توضیح: آستانه نوسانات بازار برای تشخیص بازارهای پر نوسان.
مقدار پیشنهادی: 1.0.
بهینهسازی: افزایش آستانه باعث میشود اندیکاتور فقط بازارهای با نوسانات بسیار بالا را "پر نوسان" تشخیص دهد.
o Trend Strength Threshold (ADX) (آستانه قدرت روند (ADX)):
توضیح: آستانه قدرت روند بازار بر اساس اندیکاتور ADX برای تشخیص بازارهای دارای روند قوی.
مقدار پیشنهادی: 25.
بهینهسازی: افزایش آستانه باعث میشود اندیکاتور فقط روندهای بسیار قوی را "روند دار" تشخیص دهد.
6. Risk Management (مدیریت ریسک)
o Risk Per Trade (%) (ریسک در هر معامله (%)):
توضیح: درصد سرمایه که میخواهید در هر معامله ریسک کنید.
مقدار پیشنهادی: 1.0% (مقادیر بین 0.5% تا 2% معمولاً توصیه میشود).
بهینهسازی: بر اساس تحمل ریسک و استراتژی معاملاتی خود تنظیم کنید. ریسک کمتر برای معاملات امنتر، ریسک بیشتر برای معاملات پربازدهتر (با ریسک بیشتر).
o Max Risk Exposure (%) (حداکثر ریسک کلی (%)):
توضیح: حداکثر درصد سرمایه که میخواهید به طور همزمان در معاملات باز در معرض ریسک قرار دهید.
مقدار پیشنهادی: 10.0% (مقادیر بین 5% تا 20% بسته به استراتژی).
بهینهسازی: برای کنترل کلی ریسک پورتفوی خود تنظیم کنید.
o Enable Trailing Stop (فعالسازی حد ضرر متحرک):
توضیح: فعال یا غیرفعال کردن حد ضرر متحرک.
مقدار پیشنهادی: True (فعال).
بهینهسازی: حد ضرر متحرک به قفل سود و کاهش ریسک در معاملات روندی کمک میکند.
o Trailing Stop ATR Multiplier (ضریب ATR حد ضرر متحرک):
توضیح: ضریب ضرب شده در ATR برای محاسبه فاصله حد ضرر متحرک از قیمت.
مقدار پیشنهادی: 2.5.
بهینهسازی: مقادیر کمتر حد ضرر متحرک را به قیمت نزدیکتر میکند، حساسیت بیشتر به نوسانات، احتمال خروج زودهنگام از معامله بیشتر. مقادیر بیشتر حد ضرر متحرک را دورتر میکند، تحمل نوسانات بیشتر، اما سود بالقوه بیشتر در صورت ادامه روند.
o Stop Loss ATR Multiplier (ضریب ATR حد ضرر ثابت):
توضیح: ضریب ضرب شده در ATR برای محاسبه فاصله حد ضرر ثابت اولیه از قیمت ورود.
مقدار پیشنهادی: 2.0.
بهینهسازی: مشابه حد ضرر متحرک، مقادیر کمتر حد ضرر را نزدیکتر و مقادیر بیشتر دورتر میکند.
o Take Profit ATR Multiplier (ضریب ATR حد سود):
توضیح: ضریب ضرب شده در ATR برای محاسبه فاصله حد سود از قیمت ورود.
مقدار پیشنهادی: 4.0.
بهینهسازی: مقادیر کمتر حد سود را نزدیکتر و مقادیر بیشتر دورتر میکند. نسبت حد سود به حد ضرر (ریسک به ریوارد) را بر اساس استراتژی خود تنظیم کنید.
7. Signal Filters (فیلترهای سیگنال)
o Enable RSI Filter (فعالسازی فیلتر RSI):
توضیح: فعال یا غیرفعال کردن فیلتر RSI.
مقدار پیشنهادی: True (فعال).
بهینهسازی: فیلتر RSI به جلوگیری از ورود به معاملات در شرایط اشباع خرید یا فروش کمک میکند.
o RSI Period (دوره RSI):
توضیح: دوره زمانی محاسبه RSI.
مقدار پیشنهادی: 14 (مقدار استاندارد).
بهینهسازی: مقادیر کمتر RSI را حساستر و مقادیر بیشتر نرمتر میکند.
o RSI Overbought (اشباع خرید RSI):
توضیح: سطح RSI بالای این مقدار به عنوان اشباع خرید در نظر گرفته میشود.
مقدار پیشنهادی: 70.
بهینهسازی: بر اساس دارایی و شرایط بازار تنظیم کنید.
o RSI Oversold (اشباع فروش RSI):
توضیح: سطح RSI پایینتر از این مقدار به عنوان اشباع فروش در نظر گرفته میشود.
مقدار پیشنهادی: 30.
بهینهسازی: بر اساس دارایی و شرایط بازار تنظیم کنید.
o Enable MACD Filter (فعالسازی فیلتر MACD):
توضیح: فعال یا غیرفعال کردن فیلتر MACD.
مقدار پیشنهادی: True (فعال).
بهینهسازی: فیلتر MACD به تایید سیگنالها بر اساس تقاطع خطوط MACD و سیگنال کمک میکند.
o MACD Fast Length (دوره MACD سریع):
توضیح: دوره زمانی EMA سریع برای محاسبه MACD.
مقدار پیشنهادی: 12 (مقدار استاندارد).
بهینهسازی: مقادیر کمتر MACD را حساستر و مقادیر بیشتر نرمتر میکند.
o MACD Slow Length (دوره MACD کند):
توضیح: دوره زمانی EMA کند برای محاسبه MACD.
مقدار پیشنهادی: 26 (مقدار استاندارد).
بهینهسازی: مقادیر کمتر MACD را حساستر و مقادیر بیشتر نرمتر میکند.
o MACD Signal Length (دوره سیگنال MACD):
توضیح: دوره زمانی EMA برای خط سیگنال MACD.
مقدار پیشنهادی: 9 (مقدار استاندارد).
بهینهسازی: مقادیر کمتر خط سیگنال را حساستر و مقادیر بیشتر نرمتر میکند.
o Enable Volume Filter (فعالسازی فیلتر حجم):
توضیح: فعال یا غیرفعال کردن فیلتر حجم.
مقدار پیشنهادی: True (فعال).
بهینهسازی: فیلتر حجم به تایید سیگنالها با بررسی حجم معاملات کمک میکند.
o Volume Oscillator Period (دوره اسیلاتور حجم):
توضیح: دوره زمانی محاسبه اسیلاتور حجم.
مقدار پیشنهادی: 20.
بهینهسازی: بر اساس تایم فریم و نوسانات حجم معاملات تنظیم کنید.
8. Multi-Timeframe Settings (تنظیمات چند تایم فریم)
o Enable Multi-Timeframe Analysis (فعالسازی تحلیل چند تایم فریم):
توضیح: فعال یا غیرفعال کردن تحلیل چند تایم فریم.
مقدار پیشنهادی: False (غیرفعال) - در صورت نیاز به تحلیل چند تایم فریم فعال کنید.
بهینهسازی: برای تایید سیگنالها از تایم فریم بالاتر و کاهش سیگنالهای اشتباه مفید است.
o MTF Timeframe (تایم فریم MTF):
توضیح: تایم فریم مورد استفاده برای تحلیل چند تایم فریم (در صورت فعال بودن).
مقدار پیشنهادی: 60 دقیقه (برای تایم فریمهای 5 و 15 دقیقهای) یا 240 دقیقه (برای تایم فریمهای 30 و 60 دقیقهای).
بهینهسازی: تایم فریم MTF باید بزرگتر از تایم فریم نمودار اصلی باشد. معمولاً 4 برابر یا بیشتر تایم فریم اصلی توصیه میشود.
9. Visualization Settings (تنظیمات بصری)
o Show Support/Resistance (نمایش حمایت/مقاومت):
توضیح: نمایش یا عدم نمایش سطوح حمایت و مقاومت محاسبه شده توسط اندیکاتور.
مقدار پیشنهادی: True (فعال).
بهینهسازی: سطوح حمایت و مقاومت میتوانند به تشخیص نقاط ورود و خروج احتمالی کمک کنند.
o Show Position Info (نمایش اطلاعات موقعیت):
توضیح: نمایش یا عدم نمایش اطلاعات مربوط به موقعیتهای معاملاتی باز (حد ضرر، حد سود، حد ضرر متحرک).
مقدار پیشنهادی: True (فعال).
بهینهسازی: نمایش اطلاعات موقعیت به مدیریت بهتر معاملات کمک میکند.
بخش دوم: نمودارخوانی و تفسیر سیگنالها
این بخش به آموزش گام به گام نحوه خواندن نمودار، تفسیر سیگنالهای خرید و فروش و درک عناصر بصری اندیکاتور میپردازد.
عناصر بصری اندیکاتور:
• میانگینهای متحرک نمایی (EMA): خطوط آبی (EMA سریع) و نارنجی (EMA کند). تقاطع این خطوط میتواند نشاندهنده تغییر روند باشد.
• سوپر ترند (SuperTrend): خط سبز (روند صعودی) و قرمز (روند نزولی). تغییر رنگ سوپر ترند و عبور قیمت از آن سیگنالهای اصلی خرید و فروش را ایجاد میکند.
• باندهای بولینگر (Bollinger Bands): سه خط خاکستری (باند بالا، باند میانی، باند پایین). پهنای باندها نوسانات بازار را نشان میدهد. شکست قیمت از باندها میتواند سیگنال معاملاتی باشد.
• سطوح حمایت و مقاومت (Support/Resistance): دایرههای سبز (حمایت) و قرمز (مقاومت). این سطوح مناطق احتمالی برگشت قیمت را نشان میدهند.
• سیگنالهای خرید و فروش (Buy/Sell Signals):
o سیگنال خرید (Buy): برچسب "Buy" سبز رنگ در پایین کندل، فلش سبز رو به بالا (▲) در پایین کندل.
o سیگنال فروش (Sell): برچسب "Sell" قرمز رنگ در بالای کندل، فلش قرمز رو به پایین (▼) در بالای کندل.
• رنگ پسزمینه نمودار (Background Color):
o سبز (Trending Quiet): بازار رونددار با نوسانات کم.
o قرمز (Trending Volatile): بازار رونددار با نوسانات زیاد.
o زرد (Ranging Volatile): بازار بدون روند با نوسانات زیاد.
o خاکستری (Ranging Quiet): بازار بدون روند با نوسانات کم.
• سطوح حد ضرر (Stop Loss)، حد سود (Take Profit) و حد ضرر متحرک (Trailing Stop): خطوط صلیب قرمز (حد ضرر)، صلیب سبز (حد سود) و خط پلهای بنفش (حد ضرر متحرک). این خطوط سطوح خروج از معامله را نشان میدهند.
نحوه خواندن نمودار و تفسیر سیگنالها:
1. تشخیص روند کلی بازار:
o به رنگ سوپر ترند و موقعیت قیمت نسبت به سوپر ترند توجه کنید. سوپر ترند سبز و قیمت بالای آن نشاندهنده روند صعودی است. سوپر ترند قرمز و قیمت پایین آن نشاندهنده روند نزولی است.
o به موقعیت EMA سریع نسبت به EMA کند توجه کنید. EMA سریع بالاتر از EMA کند نشاندهنده روند صعودی و EMA سریع پایینتر از EMA کند نشاندهنده روند نزولی است.
o رنگ پسزمینه نمودار نیز میتواند به تشخیص رژیم بازار و روند کلی کمک کند.
2. شناسایی سیگنالهای خرید و فروش:
o سیگنال خرید: زمانی که قیمت از زیر خط سوپر ترند به بالای آن عبور میکند (کراساور). برچسب "Buy" و فلش سبز ظاهر میشوند.
o سیگنال فروش: زمانی که قیمت از بالای خط سوپر ترند به پایین آن عبور میکند (کراساندر). برچسب "Sell" و فلش قرمز ظاهر میشوند.
3. تایید سیگنالها با فیلترها:
o فیلتر RSI: در سیگنالهای خرید، RSI باید زیر سطح اشباع فروش (RSI Oversold) باشد. در سیگنالهای فروش، RSI باید بالای سطح اشباع خرید (RSI Overbought) باشد.
o فیلتر MACD: در سیگنالهای خرید، خط MACD باید خط سیگنال را به سمت بالا قطع کند (کراساور). در سیگنالهای فروش، خط MACD باید خط سیگنال را به سمت پایین قطع کند (کراساندر).
o فیلتر حجم: حجم معاملات باید در زمان سیگنال خرید یا فروش افزایش یابد. اسیلاتور حجم (Vol Osc) باید مثبت باشد.
o فیلتر MTF: در صورت فعال بودن MTF، EMA سریع تایم فریم MTF باید بالاتر از EMA کند تایم فریم MTF باشد برای سیگنالهای خرید و برعکس برای سیگنالهای فروش.
o فیلتر رژیم بازار: اندیکاتور در بازارهای "Trending Quiet" و "Trending Volatile" سیگنالهای بهتری ارائه میدهد. از معاملات در بازارهای "Ranging Volatile" و "Ranging Quiet" با احتیاط بیشتری استفاده کنید یا فیلتر رژیم بازار را غیرفعال کنید.
4. استفاده از سطوح حمایت و مقاومت:
o سطوح حمایت (دایرههای سبز) میتوانند نقاط ورود مناسبی برای معاملات خرید باشند.
o سطوح مقاومت (دایرههای قرمز) میتوانند نقاط ورود مناسبی برای معاملات فروش باشند.
o این سطوح همچنین میتوانند به تعیین سطوح حد سود و حد ضرر کمک کنند.
5. مدیریت ریسک با حد ضرر و حد سود:
o حد ضرر (خط صلیب قرمز) برای محدود کردن ضرر در معاملات استفاده میشود.
o حد سود (خط صلیب سبز) برای قفل سود در معاملات استفاده میشود.
o حد ضرر متحرک (خط پلهای بنفش) به طور خودکار با حرکت قیمت در جهت سود، حد ضرر را تنظیم میکند تا سود را حفظ کند.
نکات مهم:
• هیچ اندیکاتوری به تنهایی 100% دقیق نیست. از اندیکاتور "Ultimate Trading Strategy Pro" به عنوان بخشی از استراتژی معاملاتی خود استفاده کنید و آن را با تحلیلهای دیگر (تحلیل بنیادی، پرایس اکشن و غیره) ترکیب کنید.
• تنظیمات اندیکاتور را بر اساس دارایی، تایم فریم و استراتژی معاملاتی خود بهینهسازی کنید.
• همیشه مدیریت ریسک را در معاملات خود رعایت کنید و از حجم معاملات مناسب استفاده کنید.
بخش سوم: تنظیم آلارمها
این بخش راهنمای دقیق برای تنظیم آلارمها با توجه به محدودیت "Any alert() function call" و نحوه استفاده موثر از آلارمها را ارائه میدهد.
نحوه تنظیم آلارم در TradingView:
1. روی نمودار راست کلیک کنید.
2. گزینه "Add alert" را انتخاب کنید.
3. در پنجره "Create Alert"، بخش "Condition" را تنظیم کنید:
o Condition: اندیکاتور "Ultimate Trading Strategy Pro" را انتخاب کنید.
o Trigger: شرایط آلارم را انتخاب کنید. برای این اندیکاتور، میتوانید از شرایط زیر استفاده کنید:
Ultimate Trading Strategy Pro: Long Condition: برای آلارم سیگنال خرید.
Ultimate Trading Strategy Pro: Short Condition: برای آلارم سیگنال فروش.
Ultimate Trading Strategy Pro: Exit Long: برای آلارم خروج از معامله خرید (حد ضرر/حد سود فعال شد).
Ultimate Trading Strategy Pro: Exit Short: برای آلارم خروج از معامله فروش (حد ضرر/حد سود فعال شد).
o Options:
Once Per Bar Close: آلارم فقط در بسته شدن کندل فعال میشود (توصیه میشود).
Once Per Bar: آلارم در هر کندل که شرط برقرار باشد فعال میشود (ممکن است آلارمهای زیادی ایجاد کند).
Once: آلارم فقط یک بار فعال میشود و غیرفعال میگردد.
Every Time: آلارم به طور مداوم تا زمانی که شرط برقرار باشد فعال میشود (توصیه نمیشود).
o Alert name: یک نام برای آلارم خود وارد کنید (مثلاً "سیگنال خرید EURUSD").
o Message: پیام آلارم را سفارشی کنید. پیامهای پیشفرض در کد اندیکاتور تنظیم شدهاند:
سیگنال خرید: "سیگنال خرید از اندیکاتور Ultimate Strategy Pro"
سیگنال فروش: "سیگنال فروش از اندیکاتور Ultimate Strategy Pro"
خروج از معامله خرید: "خروج از معامله خرید - حد ضرر/حد سود فعال شد"
خروج از معامله فروش: "خروج از معامله فروش - حد ضرر/حد سود فعال شد"
4. گزینه های Notification: روش دریافت آلارم را انتخاب کنید (نمایش پنجره، ارسال ایمیل، اعلان در اپلیکیشن TradingView، پخش صدا).
5. روی دکمه "Create" کلیک کنید.
استفاده موثر از آلارمها:
• آلارم برای سیگنالهای اصلی: برای دریافت اطلاع از سیگنالهای خرید و فروش اصلی اندیکاتور آلارم تنظیم کنید.
• آلارم برای خروج از معاملات: برای اطلاع از فعال شدن حد ضرر یا حد سود و خروج از معامله آلارم تنظیم کنید.
• تنظیم آلارم بر اساس استراتژی: اگر از فیلترهای خاصی استفاده میکنید، آلارمها را بر اساس سیگنالهای تایید شده توسط فیلترها تنظیم کنید.
• مدیریت آلارمها: تعداد زیادی آلارم ممکن است گیجکننده باشد. فقط برای سیگنالها و شرایط مهم آلارم تنظیم کنید.
• آزمایش آلارمها: قبل از استفاده واقعی، آلارمها را آزمایش کنید تا مطمئن شوید به درستی کار میکنند.
بخش چهارم: مثالهای عملی
این بخش چندین مثال کاربردی برای تنظیمات، نمودارخوانی و آلارمها برای درک بهتر و استفاده عملی از اندیکاتور ارائه میدهد.
مثال 1: تنظیمات برای اسکالپینگ در تایم فریم 5 دقیقهای
تنظیمات مقدار پیشنهادی توضیح
EMA Fast Length 10 EMA سریعتر برای سیگنالهای سریعتر در تایم فریم پایین.
EMA Slow Length 30 EMA کندتر برای تشخیص روند کلی کوتاهمدت.
SuperTrend ATR Period 7 سوپر ترند حساستر به نوسانات قیمت برای سیگنالهای سریعتر.
SuperTrend Factor 2.5 فاکتور کمتر برای باند سوپر ترند نزدیکتر به قیمت و سیگنالهای بیشتر.
BB Length 20 مقدار استاندارد.
BB StdDev Multiplier 2.0 مقدار استاندارد.
RSI Period 10 RSI حساستر برای تشخیص سریعتر اشباع خرید/فروش.
RSI Overbought 70 سطح اشباع خرید استاندارد.
RSI Oversold 30 سطح اشباع فروش استاندارد.
MACD Fast Length 12 مقدار استاندارد.
MACD Slow Length 26 مقدار استاندارد.
MACD Signal Length 9 مقدار استاندارد.
Volume Oscillator Period 15 دوره کوتاهتر برای اسیلاتور حجم حساستر.
Regime Lookback Period 30 دوره کوتاهتر برای تشخیص سریعتر رژیم بازار.
Volatility Threshold 1.2 آستانه نوسانات کمی بالاتر برای فیلتر بازارهای بسیار پر نوسان.
Trend Strength Threshold 20 آستانه قدرت روند کمی پایینتر برای تشخیص روندهای ضعیفتر در تایم فریم پایین.
Risk Per Trade (%) 0.5% ریسک کمتر برای معاملات سریع و متعدد اسکالپینگ.
Trailing Stop ATR Mult 2.0 حد ضرر متحرک نزدیکتر برای قفل سود سریعتر.
Stop Loss ATR Mult 1.5 حد ضرر ثابت نزدیکتر برای معاملات اسکالپینگ.
TP ATR Mult 3.0 حد سود با نسبت ریسک به ریوارد مناسب برای اسکالپینگ.
MTF Timeframe 30 دقیقه استفاده از تایم فریم 30 دقیقهای برای تایید روند کلی.
مثال 2: تنظیمات برای معاملات روزانه (Day Trading) در تایم فریم 30 دقیقهای
تنظیمات مقدار پیشنهادی توضیح
EMA Fast Length 20 مقدار استاندارد برای تایم فریم 30 دقیقهای.
EMA Slow Length 50 مقدار استاندارد برای تایم فریم 30 دقیقهای.
SuperTrend ATR Period 10 مقدار استاندارد برای تایم فریم 30 دقیقهای.
SuperTrend Factor 3.0 مقدار استاندارد برای تایم فریم 30 دقیقهای.
BB Length 20 مقدار استاندارد.
BB StdDev Multiplier 2.1 مقدار استاندارد.
RSI Period 14 مقدار استاندارد.
RSI Overbought 70 سطح اشباع خرید استاندارد.
RSI Oversold 30 سطح اشباع فروش استاندارد.
MACD Fast Length 12 مقدار استاندارد.
MACD Slow Length 26 مقدار استاندارد.
MACD Signal Length 9 مقدار استاندارد.
Volume Oscillator Period 20 مقدار استاندارد.
Regime Lookback Period 50 مقدار استاندارد.
Volatility Threshold 1.0 مقدار استاندارد.
Trend Strength Threshold 25 مقدار استاندارد.
Risk Per Trade (%) 1% ریسک استاندارد برای معاملات روزانه.
Trailing Stop ATR Mult 2.5 حد ضرر متحرک استاندارد.
Stop Loss ATR Mult 2.0 حد ضرر ثابت استاندارد.
TP ATR Mult 4.0 حد سود با نسبت ریسک به ریوارد استاندارد.
MTF Timeframe 4 ساعته استفاده از تایم فریم 4 ساعته برای تایید روند کلی.
مثال 3: نمودارخوانی و تفسیر سیگنال خرید
1. نمودار را در تایم فریم 30 دقیقهای باز کنید.
2. به دنبال سیگنال خرید باشید: زمانی که قیمت از زیر خط سوپر ترند قرمز به بالای خط سوپر ترند سبز عبور میکند، یک برچسب "Buy" سبز و فلش سبز در پایین کندل ظاهر میشود.
3. فیلترها را بررسی کنید:
o RSI: RSI باید زیر 30 (اشباع فروش) باشد.
o MACD: خط MACD باید خط سیگنال را به سمت بالا قطع کرده باشد.
o Volume Oscillator: اسیلاتور حجم باید مثبت باشد.
o MTF (در صورت فعال بودن): در تایم فریم 4 ساعته، EMA سریع باید بالاتر از EMA کند باشد.
4. رژیم بازار: رنگ پسزمینه نمودار باید سبز ("Trending Quiet") یا قرمز ("Trending Volatile") باشد.
5. سطح حمایت: به دنبال سطوح حمایت نزدیک به قیمت ورود باشید.
6. ورود به معامله: در صورت تایید تمامی شرایط، در کندل بعدی پس از سیگنال خرید وارد معامله خرید شوید.
7. تنظیم حد ضرر و حد سود: حد ضرر را در زیر سطح حمایت یا بر اساس ضریب ATR حد ضرر تنظیم کنید. حد سود را بر اساس ضریب ATR حد سود تنظیم کنید.
8. فعالسازی آلارم: برای سیگنال خرید و خروج از معامله آلارم تنظیم کنید.
مثال 4: تنظیم آلارم برای سیگنال فروش EURUSD در تایم فریم 60 دقیقهای
1. در TradingView نمودار EURUSD را در تایم فریم 60 دقیقهای باز کنید.
2. روی نمودار راست کلیک کنید و "Add alert" را انتخاب کنید.
3. Condition: "Ultimate Trading Strategy Pro" را انتخاب کنید.
4. Trigger: "Ultimate Trading Strategy Pro: Short Condition" را انتخاب کنید.
5. Options: "Once Per Bar Close" را انتخاب کنید.
6. Alert name: "سیگنال فروش EURUSD 60 دقیقه" را وارد کنید.
7. Message: "سیگنال فروش EURUSD در تایم فریم 60 دقیقهای از اندیکاتور Ultimate Strategy Pro" را وارد کنید.
8. Notification: روش دریافت آلارم را انتخاب کنید.
9. روی "Create" کلیک کنید.
با استفاده از این راهنما و مثالهای عملی، شما میتوانید به طور کامل از اندیکاتور "Ultimate Trading Strategy Pro" استفاده کنید و استراتژی معاملاتی خود را بهبود بخشید. به یاد داشته باشید که تمرین و آزمایش تنظیمات مختلف برای تایم فریمها و داراییهای مختلف، کلید موفقیت در استفاده از این اندیکاتور است.

CVOLB_WVF with CM_WVF - Enhanced Visualization with Alerts 2設定說明
主要參數
時間範圍:
Start Date(預設 2025-01-01)與 End Date(預設 2026-01-01):定義回測範圍。若數據超出範圍,可能需調整。
風險管理:
Stop Loss %(預設 1.0%):每筆交易的最大虧損。
Take Profit 1 %(預設 4.0%)與 Take Profit 2 %(預設 8.0%):分階段止盈,分別平倉 50% 和剩餘部位。
Short Trailing Stop Buffer %(預設 1.0%):空頭追蹤止損的緩衝。
EMA 設定:
EMA Length for Trailing Stop(預設 21):基準止損 EMA 週期。
Trend EMA Length(預設 13):基準趨勢 EMA 週期。
Short EMA Length(預設 7)與 Long EMA Length(預設 55):動態調整的短/長週期。
Short Trend EMA Length(預設 5)與 Long Trend EMA Length(預設 34):趨勢 EMA 的短/長週期。
Use ATR to Adjust EMA(預設 true):
啟用 ATR 動態調整 EMA。
成交量與 WVF:
Volume Spike Multiplier(預設 2.0):成交量觸發倍數。
WVF Spike Multiplier(預設 1.5):WVF 波動觸發倍數。
交易方向:
Trade Direction(預設 "Both"):可選 "Long Only"(僅多頭)、"Short Only"(僅空頭)或 "Both"(雙向)。
推薦設定
短線交易:縮短 ema_length_base 到 10-15,trend_ema_length_base 到 8-10,適合 5 分鐘或 15 分鐘圖。
長線交易:延長 ema_length_base 到 50,trend_ema_length_base 到 20,適合日線圖。
高波動市場:啟用 use_atr_for_ema,降低 volume_threshold 到 1.5。
特色
動態適應市場波動:
ATR 調整 EMA 長度,高波動時用短EMA快速反應,低波動時用長EMA過濾噪音。
多重信號確認:
結合 WVF(波動)、成交量和趨勢EMA,確保入場信號強度和可靠性。
靈活的風險管理:
支援固定止損、分階段止盈和Trailing Stop,提供多層次利潤鎖定。
視覺化與警報:
圖表顯示EMA線、入場信號、成交量/WVF標記,並提供警報功能,方便即時監控。
可自訂性:
參數(如EMA週期、止盈止損、成交量倍數)可調整,適應不同市場和交易風格。

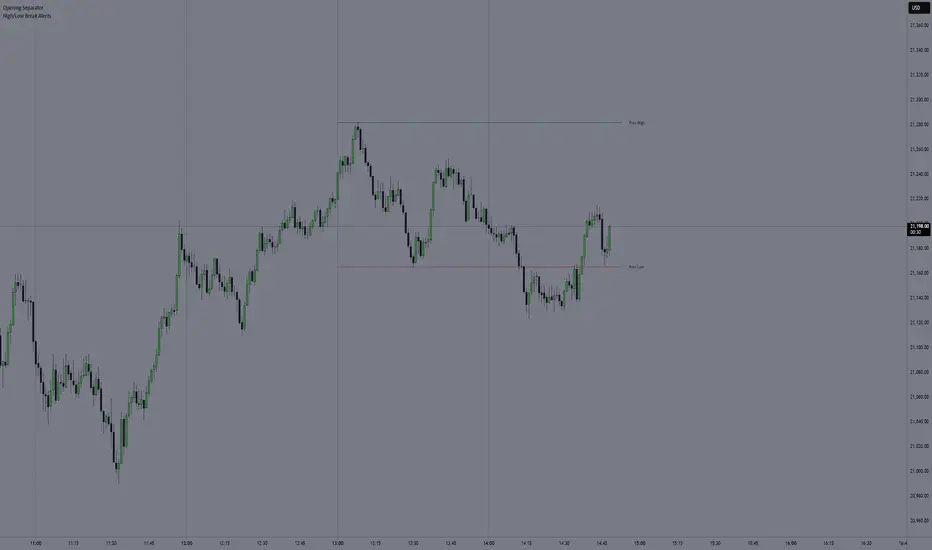
Custom Previous High/Low + Breakout AlertsThis indicator plots the previous high and low of the selected timeframe and alerts you when the price breaks either level.
To prevent spam, it triggers only once per period. If both the high and low break within the same period, you will receive an alert for each, but no duplicates if price hovers around these levels.
How to Set Up Alerts
1. Choose Your Timeframe
- In the indicator settings, select the timeframe for the high/low reference.
- Example: If you select 1 hour, the indicator will plot the previous 1-hour high and low and alert you when either level is broken
2. Create an Alert
- Condition → High/Low Break Alerts
- Function → Any alert() function call
Optional:
- If you want alerts only for high breakouts or low breakouts, select High Breakout or Low Breakout and use "Once Per Bar" as the trigger. (It will still alert only once per period.)
3. Setting Alerts for Multiple Timeframes
- If you want to create another alert for a different timeframe, first select the new timeframe in the indicator settings, then create a new alert
- Note: Previous alerts will continue to notify you based on the timeframe they were originally set for, even if you change the timeframe in the indicator settings.
V4 Ultimate Bitcoin Trading Strategy Proراهنمای جامع استفاده از استراتژی معاملاتی بیتکوین (نسخه Pro V4)
---
#### **1. تنظیمات کلی (General Settings)**
- **Account Balance ($)**: موجودی حساب شما (حداقل 100 دلار)
- **نمونه تنظیم**: 10000 دلار
---
#### **2. تشخیص رژیم بازار (Market Regime Settings)**
- **Enable Market Regime Filter**: فعال/غیرفعال کردن فیلتر رژیم بازار
- **Regime Lookback Period (50)**: دوره تحلیل روند (10-200)
- **Volatility Threshold (1.0)**: آستانه نوسان (0.1-5.0)
- **ADX Threshold (25)**: قدرت روند (10-50)
**📊 راهنمای تنظیمات:**
- **رژیمهای بازار**:
- **Trending Volatile**: روند قوی + نوسان بالا (بهترین شرایط برای معامله)
- **Ranging Volatile**: نوسان بالا بدون روند مشخص
- **Trending Quiet**: روند آرام
- **Ranging Quiet**: بازار رنج با نوسان کم
- **تنظیمات پیشنهادی**:
- اسکالپینگ (15M-1H): Volatility Threshold = 0.8-1.2
- سوئینگ تریدینگ (4H-D): Volatility Threshold = 1.5-2.5
---
#### **3. مدیریت ریسک (Risk Management)**
- **Risk Per Trade (%) (1.0)**: درصد ریسک در هر معامله (0.1-5%)
- **Max Risk Exposure (%) (10.0)**: حداکثر ریسک همزمان (1-50%)
- **Trailing Stop Multiplier (2.5)**: ضریب تریلینگ استاپ (0.5-10)
- **Stop Loss ATR Multiplier (2.0)**: ضریب استاپ لاس (0.5-10)
- **Take Profit ATR Multiplier (4.0)**: ضریب تیک پروفیت (0.5-10)
**🎯 فرمولهای کلیدی**:
- **اندازه پوزیشن**: `(موجودی حساب * درصد ریسک) / (ورودی - استاپ لاس)`
- **حد سود/ضرر**: مبتنی بر ATR 14 دوره
---
#### **4. تنظیمات اندیکاتورها**
**الف) EMA (میانگین متحرک نمایی)**:
- **Fast Length (20)**: EMA کوتاهمدت (پیشنهادی: 9-21)
- **Slow Length (50)**: EMA بلندمدت (پیشنهادی: 50-200)
- **Source**: قیمت پایانی (Close)
**ب) SuperTrend**:
- **ATR Period (10)**: دوره محاسبه نوسان (پیشنهادی: 7-14)
- **Factor (3.0)**: حساسیت سیگنال (پیشنهادی: 2-4)
**ج) Bollinger Bands**:
- **Length (20)**: دوره محاسبه (پیشنهادی: 20)
- **StdDev (2.1)**: انحراف معیار (پیشنهادی: 2.0-2.5)
---
#### **5. فیلترهای سیگنال (Signal Filters)**
**الف) RSI**:
- **Period (14)**: دوره RSI
- **Overbought (70)**: اشباع خرید
- **Oversold (30)**: اشباع فروش
**ب) MACD**:
- **Fast (12)**, **Slow (26)**, **Signal (9)**: تنظیمات استاندارد
**ج) Volume**:
- **Period (20)**: دوره اسیلاتور حجم
**⚖️ تنظیمات ترکیبی**:
- در بازارهای رنج: فعال کردن فیلترهای RSI و MACD
- در روندهای قوی: غیرفعال کردن فیلترها برای کاهش تأخیر
---
#### **6. تحلیل چندزمانه (Multi-Timeframe)**
- **Enable MTF Analysis**: فعال/غیرفعال
- **MTF Timeframe (60)**: تایم فریم بالاتر (پیشنهادی: 4H برای تحلیل روزانه)
---
#### **7. استراتژی معاملاتی**
**📈 سیگنال خرید**:
1. قیمت بالای SuperTrend
2. قیمت بالای میانگین بولینگر
3. EMA سریع > EMA کند
4. RSI < 30 (اشباع فروش)
5. MACD خط سیگنال را به بالا قطع کند
6. حجم بالاتر از میانگین
**📉 سیگنال فروش**:
1. قیمت زیر SuperTrend
2. قیمت زیر میانگین بولینگر
3. EMA سریع < EMA کند
4. RSI > 70 (اشباع خرید)
5. MACD خط سیگنال را به پایین قطع کند
6. حجم بالاتر از میانگین
---
#### **8. تنظیمات زمانی پیشنهادی**
| تایم فریم | EMA سریع | EMA کند | SuperTrend Factor | ATR Multiplier |
|-----------|----------|---------|-------------------|----------------|
| 15 دقیقه | 9 | 21 | 2.5 | 1.5 |
| 1 ساعت | 12 | 26 | 3.0 | 2.0 |
| 4 ساعت | 20 | 50 | 3.5 | 2.5 |
| روزانه | 50 | 200 | 4.0 | 3.0 |
---
#### **9. نکات اجرایی**
1. **بکتست** حتماً انجام دهید (حداقل 200 معامله)
2. در بازارهای **اخباری** فیلترها را غیرفعال کنید
3. از ترکیب با **سطحاt کلیدی** قیمتی استفاده کنید
4. **حداکثر 3% ریسک** در روز توصیه میشود
5. در صورت 3 سیگنال متوالی زیانده، استراتژی را بازبینی کنید
---
#### **10. مثال عملی**
**سناریو خرید در تایم فریم 4 ساعته**:
- قیمت: 42,000 دلار
- SuperTrend: 41,500 دلار
- EMA 20 > EMA 50
- RSI: 28
- حجم 20% بالاتر از میانگین
- **اندازه پوزیشن**: (10000 * 1%) / (42000 - 41500) = 0.2 BTC
- **حد ضرر**: 41,500 دلار
- **حد سود**: 43,000 دلار
### 🎨 راهنمای کامل رنگها و عناصر نمودار در استراتژی معاملاتی
---
#### **1. پسزمینه رژیم بازار (Market Regime Background)**
- **🔴 قرمز روشن (Trending Volatile)**:
بازار در حالتی با **روند قوی + نوسانات بالا** - بهترین شرایط برای معاملات جهتدار
- **🟠 نارنجی (Ranging Volatile)**:
بازار **بدون روند مشخص + نوسانات بالا** - نیاز به احتیاط بیشتر
- **🟢 سبز (Trending Quiet)**:
بازار با **روند آرام و پایدار** - مناسب برای معاملات میانمدت
- **🔵 خاکستری آبی (Ranging Quiet)**:
بازار **رنج با نوسانات کم** - بهتر است از معاملات اجتناب شود
---
#### **2. اندیکاتورهای اصلی**
**الف) میانگین متحرک (EMA)**:
- **🔵 آبی (Fast EMA)**:
میانگین متحرک سریع (پیشفرض: 20 دوره) - نشانگر حرکت کوتاهمدت قیمت
- **🟠 نارنجی (Slow EMA)**:
میانگین متحرک کند (پیشفرض: 50 دوره) - نشانگر روند بلندمدت
**ب) سوپرترند (SuperTrend)**:
- **🟢 سبز**:
سیگنال **خرید** - وقتی قیمت بالای خط سوپرترند باشد
- **🔴 قرمز**:
سیگنال **فروش** - وقتی قیمت زیر خط سوپرترند باشد
**ج) باندهای بولینگر (Bollinger Bands)**:
- **⚪ خاکستری (Upper/Lower)**:
محدوده نوسانات قیمت - شکست بالای باند فوقانی=اشباع خرید، شکست زیر باند تحتانی=اشباع فروش
- **⚪ خطچی خاکستری (Middle)**:
میانگین متحرک ساده (SMA) - مرکز نوسانات بازار
---
#### **3. سطوح کلیدی**
- **✖️ قرمز (Resistance)**:
سطح مقاومت - جایی که فشار فروش افزایش مییابد
- **✔️ سبز (Support)**:
سطح حمایت - جایی که فشار خرید افزایش مییابد
- **⛔ قرمز (Stop Loss)**:
حد ضرر - نقطه خروج از معامله در صورت حرکت نامطلوب قیمت
- **💰 سبز (Take Profit)**:
حد سود - نقطه هدف برای کسب سود
- **🟣 بنفش (Trailing Stop)**:
تریلینگ استاپ - حد ضرر متحرک که با حرکت قیمت به روز میشود
---
#### **4. سیگنالها و برچسبها**
- **🟢 برچسب سبز (Buy Signal)**:
سیگنال خرید با جزئیات:
- اندازه پوزیشن (بر حسب واحد ارز)
- حد ضرر و سود
- موقعیت: پایین کندلها
- **🔴 برچسب قرمز (Sell Signal)**:
سیگنال فروش با جزئیات:
- اندازه پوزیشن
- حد ضرر و سود
- موقعیت: بالای کندلها
- **🔵 برچسب آبی (Risk/Reward)**:
نسبت ریسک به ریوارد - محاسبه شده بر اساس فاصله حد سود و ضرر
---
#### **5. سایر عناصر**
- **📊 هیستوگرام MACD**:
- خط آبی: MACD Line
- خط نارنجی: Signal Line
- میلهها: تفاوت بین دو خط
- **📈 خط RSI**:
- بالای 70 = اشباع خرید
- زیر 30 = اشباع فروش
- **📊 اسیلاتور حجم**:
- میلههای سبز: حجم بالاتر از میانگین
- میلههای قرمز: حجم پایینتر از میانگین
---
#### **6. نکات تفسیر رنگها**
1. **تلفیق رنگها**:
- ترکیب **سبز سوپرترند + آبی EMA** = تأیید روند صعودی
- ترکیب **قرمز سوپرترند + نارنجی EMA** = تأیید روند نزولی
2. **هشدارها**:
- رنگهای **قرمز پررنگ** در پسزمینه = احتمال نوسانات شدید
- رنگهای **خاکستری** = شرایط نامشخص بازار
3. **تایید سیگنال**:
- همپوشانی **سیگنال خرید + حمایت سبز** = اعتبار بیشتر
- همپوشانی **سیگنال فروش + مقاومت قرمز** = اطمینان بالاتر
---
با درک صحیح از این نمادها و رنگها، میتوانید به سرعت شرایط بازار را تحلیل کرده و تصمیمات معاملاتی آگاهانهتری بگیرید! 🚀

Multiple Timeframe Moving AveragesThis indicator plots three user-defined moving averages (SMA, EMA, WMA, or VWMA), each pulled from a different timeframe.
Think of it as a 'smoothed' price line for the short-term, medium-term, and long-term, all overlaid on your current chart.
Default MA length is 200, but you can tweak it.

Neon Momentum Waves StrategyIntroduction
The Neon Momentum Waves Strategy is a momentum-based indicator designed to help traders visualize potential shifts in market direction. It builds upon a MACD-style calculation while incorporating an enhanced visual representation of momentum waves. This approach may assist traders in identifying areas of increasing or decreasing momentum, potentially aligning with market trends or reversals.
How It Works
This strategy is based on a modified MACD (Moving Average Convergence Divergence) method, calculating the difference between two Exponential Moving Averages (EMAs). The momentum wave represents this difference, while an additional smoothing line (signal line) helps highlight potential momentum shifts.
Key Components:
Momentum Calculation:
Uses a fast EMA (12-period) and a slow EMA (26-period) to measure short-term and long-term momentum.
A signal line (20-period EMA of the MACD difference) smooths fluctuations.
The histogram (momentum wave) represents the divergence between the MACD value and the signal line.
Interpreting Momentum Changes:
Momentum Increasing: When the histogram rises above the zero line, it may indicate strengthening upward movement.
Momentum Decreasing: When the histogram moves below the zero line, it may signal a weakening trend or downward momentum.
Potential Exhaustion Points: Users can define custom threshold levels (default: ±10) to highlight when momentum is significantly strong or weak.
Visual Enhancements:
The neon glow effect is created by layering multiple plots with decreasing opacity, enhancing the clarity of momentum shifts.
Aqua-colored waves highlight upward momentum, while purple waves represent downward momentum.
Horizontal reference lines mark the zero line and user-defined thresholds to improve interpretability.
How It Differs from Traditional Indicators
Improved Visualization: Unlike standard MACD histograms, this approach provides clearer visual cues using a neon-style wave format.
Customizable Thresholds: Rather than relying solely on MACD crossovers, users can adjust sensitivity settings to better suit their trading style.
Momentum-Based Approach: The strategy is focused on visualizing shifts in momentum strength, rather than predicting price movements.
Potential Use Cases
Momentum Trend Awareness: Helps traders identify periods where momentum appears to be strengthening or fading.
Market Structure Analysis: May complement other indicators to assess whether price action aligns with momentum changes.
Flexible Timeframe Application: Can be used across different timeframes, depending on the trader’s strategy.
Important Considerations
This strategy is purely momentum-based and does not incorporate volume, fundamental factors, or price action confirmation.
Momentum shifts do not guarantee price direction changes—they should be considered alongside broader market context.
The strategy may perform differently in trending vs. ranging markets, so adjustments in sensitivity may be needed.
Risk management is essential—traders should apply proper stop-losses and position sizing techniques in line with their risk tolerance.
Conclusion
The Neon Momentum Waves Strategy provides a visually enhanced method of tracking momentum, allowing traders to observe potential changes in market strength. While not a predictive tool, it serves as a complementary indicator that may help traders in momentum-based decision-making. As with any technical tool, it should be used as part of a broader strategy that considers multiple factors in market analysis.

[1% Trader] - Draw on LiquidityThe Draw on Liquidity (DOL) indicator is a tool that identifies the highest and lowest prices of the last month, last week, and yesterday. These are key points where the price of the asset often retests before making a large movement.

Reaper Signals (BITX)
**Reaper Signals (BITX)** is a comprehensive market analysis tool designed to identify extreme price reversals, trend shifts, and liquidity grabs. By utilizing statistical deviations, retracement levels, and momentum shifts, this indicator helps traders anticipate potential turning points in the market.
### **Key Features:**
🔹 **Reversal Zones & Trend Shifts**
- Detects extreme market conditions based on price deviations from statistical norms.
- Highlights areas where price is likely to react, signaling potential reversals.
🔹 **Retracement Levels for Trend Confirmation**
- Incorporates Fibonacci-based retracement levels to assess price pullbacks and trend continuations.
- Helps traders identify key areas of support and resistance where price action is likely to react.
🔹 **Dynamic Trend Analysis**
- Evaluates price movement to determine market conditions (Bullish, Bearish, or Neutral).
- Trend direction is further validated with multi-timeframe liquidity grabs for deeper insights.
🔹 **Buy & Sell Signals**
- Generates trade signals at high-probability reversal points.
- Alerts traders when price crosses critical threshold levels, indicating potential trade opportunities.
🔹 **Adaptive Market Pressure Insights**
- Measures market pressure based on statistical calculations to determine whether conditions favor strong trends or consolidation.
🔹 **Multi-Timeframe Liquidity Grabs**
- Allows traders to analyze liquidity movements from a higher timeframe for enhanced confirmation.
With a combination of statistical analysis, retracement zones, and trend-based logic, **Reaper Signals (BITX)** provides traders with an advanced toolset to navigate market movements confidently.

18 EMA FVG • NinaMoving averages and multi timeframe fair value gaps on one indicator to support my strategy

Dual HTF Candle Boxes For past verificationKey Features:
Higher Timeframe (HTF) Candle Visualization:
The script displays candlestick data (open, high, low, close) from two user-defined higher timeframes (Interval1 and Interval2) overlaid on the current chart.
Depending on the current chart's timeframe (e.g., 1-minute, 5-minute, 15-minute, etc.), it automatically selects appropriate higher timeframes for Interval1 and Interval2 (e.g., 15-minute and 1-hour for a 1-minute chart).
Users can customize these higher timeframes via input parameters.
Candle Box Display:
It draws boxes to represent the range of higher timeframe candles:
Full Range (High to Low): Optionally displayed with customizable colors and line styles.
Body (Open to Close): Optionally shown separately, with distinct colors for bullish (green by default) and bearish (red by default) candles.
Wicks: The areas between the body and the high/low are filled with a separate color (yellow by default).
Users can toggle whether to show the full range, body, or both, and adjust colors, widths, and styles.
Midline and Range Information:
Optionally displays a midline (average of high and low) for each higher timeframe candle, with customizable color, width, and style (solid or dashed).
Can show the range in pips (high to low) and/or the open-to-close range as a percentage, with labels above the candles. This is particularly useful for forex trading, where pip values are adjusted based on the ticker's minimum tick size.
Previous Day/Week High and Low Lines:
Draws horizontal lines for:
PDH (Previous Day High): Red by default.
PDL (Previous Day Low): Blue by default.
PWH (Previous Week High): Green by default.
PWL (Previous Week Low): Orange by default.
These lines are overlaid on the chart with customizable colors and styles (solid or dashed).
Labels (e.g., "PDH," "PDL") are added at user-defined offsets for clarity.
Customization Options:
Users can enable/disable each feature (e.g., Interval1, Interval2, PDH, PDL, etc.).
Colors, line widths, and styles are adjustable via inputs.
Starting positions for lines and labels can be offset to the right for better visibility on the chart.

EMA20 50 100 200 timeframe adjustableEMA 20 50 100 200 with timeframe adjustable,easier to focus reaction when 1m price touched bigger timeframe,like 15m or 1H

neXt FVG MTF PRO [cognyto]The neXt FVG Multi-Timeframe Indicator represents a remarkable edge in Fair Value Gap analysis. It offers traders a comprehensive and simplified interface to simultaneously monitor Fair Value Gaps across up to 9 different configurable timeframes . This feature shows traders exclusively the closest and most relevant gaps, enabling more precise top-down price action analysis. This makes it particularly valuable for strategies focused on market liquidity and inefficiencies.
Here are the 10 fundamental features that distinguish this indicator
1. Intelligent Visualisation of Next Gaps
An advanced filtering system is implemented to prioritise the visualisation of the nearest FVGs, hence its name -next-, offering a clean FVGs layout on the screen and improving analysis precision. The visualisation system continuously updates according to market price evolution, and as FVGs appear, are mitigated, or eliminated across different timeframes, it updates to ensure a structured and efficient interface.
2. Top-Down Multi-Timeframe Analysis
An efficient visualisation system is implemented to simultaneously manage up to 9 different timeframes. The differentiation between FVGs and their timeframes is established through proportional length in their visual presentation, where higher timeframes extend further to the right, establishing a clear visual hierarchy. The further right the gap extends, the stronger its significance. This structure allows visualization of both current timeframe gaps and those of higher timeframes, facilitating comprehensive market analysis.
3. Alerts
The indicator incorporates a complete notification system that allows users to stay informed in real-time about a wide range of critical events related to Gaps. This system includes customisable alerts for new Fair Value Gaps formation, mitigation notifications, and precise identification of significant gap breakout patterns, technically known as Breakaway gaps.
4. Mitigation
Mitigations represent a fundamental element in technical analysis, identifying zones where price has reached equilibrium. Considering the analytical importance of mitigated gaps, the indicator maintains their visualisation with a specific different color distinction. Additionally, it includes optional functionality for removing mitigated gaps, which can be activated according to user preferences.
5. BISI and SIBI
In addition to the FVGs present in all timeframes, the indicator facilitates precise configuration of BISI and SIBI gaps in the current timeframe, maintaining dynamic visualisation during the additional analysis process alongside other timeframes. This feature optimises the evaluation of historical market imbalances and inefficiencies, offering significant analytical perspectives in the current timeframe, and even refining market entry or exit strategies.
6. Breakaway-Gaps
The indicator provides advanced functionality for identifying and analysing Breakaway-Gaps, presenting in a structured manner the corresponding candle formations that create the Gap. This feature allows precise evaluation of strong market movements, including the assessment of potential retracements and directional patterns in high volatility conditions.
7. Consequent-Encroachment (C.E.)
The indicator implements advanced functionality that visualizes the midpoint of the displacement candle that generates the gap, using precise calculation based on the opening and closing levels of that candle.
8. FVG Fulfilment
The indicator offers advanced configuration options for FVG fullfilmet conditions through two main criteria: confirmation through candle closure that exceeds the established FVG limits, or validation through the intersection of extreme candle levels (maximum/minimum) with the FVG threshold.
9. FVG-Visualisations
Gaps are visualised on the platform once the third candle formation is complete. The system provides optional visualisation functionality during the formation process, although this feature is specifically recommended for predictive analysis, being most effective during daily or weekly market closing intervals. This feature maintains its consistency exclusively in the active timeframe.
10. Customisation
The indicator presents a wide range of advanced customisation options, facilitating comprehensive modification of visual elements. This includes professional adaptation of color palettes, typographic dimensions, line configurations, and design attributes, allowing precise optimisation according to specific user analytical requirements.
This indicator is available exclusively on TradingView. To access it, please see the ‘Author's Instructions’ above and visit our website.
DISCLAIMER
This indicator is provided for informational and educational purposes only. It does not constitute financial advice, trading advice, or any other type of advice, and should not be interpreted as a recommendation to buy, sell, or hold any investment or security of any kind. The information provided by this indicator is not intended as a substitute for professional financial advice. Users of this indicator bear sole responsibility for their trading and investment decisions, including the interpretation of market data and signals generated by this indicator. Past performance is not indicative of future results. Trading financial markets carries substantial risk of loss. Users should conduct their own research, seek professional advice when needed, and exercise due diligence before making any trading or investment decisions.
