Multitimeframe

TA Monks - EntriesEntry tool for users who depend on setting entry, stop and profit target based on a candle from the M1, M5 or M15 chart. Created following the Photon FX entry models, this tool allows for automatic lot size calculation and it's easy to set up per forex pair/gold.
All the user must do is set their account balance, risk percentage, target reward, asset pair and the rest is automatically set on the charts with the tool.
Tips:
- Activate a level that once hit, set stop loss at a particular level, default is at the break even
- Set entry type as either STOP or LIMIT
a) On Stop, the tool will activate the trade once price goes above the entry line (formed by the candle size + entry buffer set per pair)
b) On Limit, the same activation level as in STOP is required for the tool to activate the trade but it allows the user to enter Limit at a lower level based on the percentage of the entry candle (default is 0.5, which means 50%). In this mode, The user waits for the liquidity candle to be gained and the enter at a lower price of the range within such candle, increasing the R with the risk of missing the trade.
- On the right bottom corner, you will have certain key informations about the trade, such as time opened, time closed, MFE (maximum forward excursion - how many pips price went in favor of the trade), MAE (maximum adversary excursion - how many pips price went past the selected candle's size without buffer), LC (Liquidity candle size), XBf (extra Buffer - only appears when activated in the menu)
- Extra Buffer setting allow user to add extra buffer for the entry and extra buffer for the Stop Loss that has been set per asset pair. Note that the entry buffer only works with the STOP entry mode and if you want to change the entry level on LIMIT, you must use the limit entry percentage setting.
- If you trade an asset pair that is not supported by the tool, simply copy the code and ask an LLM to update it with the necessary pair. You dont need to know how to code, just let the AI do the hard work for you (preferably, you know the basics and you can ask the AI to read the script and update just the right snippets).
Feel free to adjust and adapt the code to your needs. Let me know if you made any cool changes that I might benefit from as well.

VSA_MACD_FVG StrategyThis version gives you more control over:
All key calculation periods
Visual appearance of FVG rectangles
Colors of buy/sell signals
Transparency of FVG areas

London & NY Sessions | TradeAcyLondon & NY Sessions | TradeAcy
Visualize key market sessions with this simple overlay indicator! Marks London Open (3:00 EST, blue), London Close (11:00 EST, yellow), NY Open (9:30 EST, green), and NY Close (16:15 EST, red) with vertical boxes and labels. Customize session times and trading days (default: Monday–Friday) via settings. Perfect for traders tracking major market hours.

RSI CON PUNTOS DE COMPRA/VENTA (MIO)Rsi con puntos de posibles compras/ventas, creado para posibles entradas

London & NY Sessions | TradeAcyLondon & NY Sessions | TradeAcy
Visualize key market sessions with this simple overlay indicator! Marks London Open (3:00 EST, blue), London Close (11:00 EST, yellow), NY Open (9:30 EST, green), and NY Close (16:15 EST, red) with vertical boxes and labels. Customize session times and trading days (default: Monday–Friday) via settings. Perfect for traders tracking major market hours.

Sunday Open & Intraday Rectangles (Customizable Colors)sunday open...london open candlle and 13:00 open candlee

Dynamic 1-Hour EMAThis indicator places a dynamic 1h EMA on the chart. It doesn't matter what timeframe you choose to display, the EMA will always be 1h. This allows for granular comparison across timeframes. Depending on your strategy this is useful for trend/range determination, or scalp entries and exits.


Triple HMA Multi-TimeFrameThis indicator plots three separate Hull Moving Averages (HMAs), each with its own period, timeframe, color, and line width. By using PineScript’s request.security function, it retrieves data from different timeframes and calculates the HMA on each of them, so you can see multiple trends at once without having to switch charts.
How it works:
1) You can set a distinct period and timeframe for each of the three HMAs. For example, you might choose a fast HMA (Period 50) on the current chart timeframe, a medium HMA (Period 100) on a higher timeframe (such as 30 minutes), and a slow HMA (Period 200) on an even higher timeframe (like H4).
2) Each HMA can be customized by color and line width, making it easier to distinguish the different timeframes at a glance.
3) The script uses barmerge.gaps_on to replicate values in between higher timeframe bars, giving a continuous look on lower timeframe charts.
Key inputs:
- HMA 1 Period and Timeframe: Allows you to choose the period (like 50) and timeframe (for instance, leave blank to use the current chart’s timeframe).
- HMA 2 Period and Timeframe: For a second HMA, you might set 100 on the “30” minute timeframe.
- HMA 3 Period and Timeframe: Often configured for a longer timeframe like 240 minutes (H4) or any other resolution you prefer.
- Colors and line widths are freely adjustable for each HMA, so you can create a clear visual separation among them.
This setup gives you a multi-timeframe perspective in one chart, allowing you to monitor short-, medium-, and long-term trends simultaneously.

Advanced Strong Buy/Sell with SMA7, RSI5, MACD, Volumegold indicator especially for 3 minutes timeframe .

GOLD RubensThis powerful indicator combines multi-timeframe analysis with trend detection and supply/demand zone identification. It leverages custom timeframes for calculating key metrics such as ATR, EMAs, MACD, and a custom trend indicator ("AlphaTrend") while simultaneously using a separate timeframe for pinpointing swing highs and lows to mark potential supply and demand areas.
Key features include:
Multi-Timeframe Analysis: Separate timeframes for period calculations and for drawing supply/demand zones allow for precise tuning.
Trend Detection: The indicator integrates ADX, MACD, and a dynamic volume-based oscillator to assess market trends and provide clear buy/sell signals.
Supply/Demand Zones: Identifies key price areas using pivot analysis, highlighting potential resistance (supply) and support (demand) zones.
Optional Visuals: Additional features like zigzag lines and price action labels enhance clarity and offer extra insights into market structure.
Alerts: Built-in alert conditions notify users of significant trend changes and crossovers for timely trade signals.
This system is designed to help traders quickly identify strong trends, reversals, and key areas of support and resistance, thereby facilitating more informed trading decisions.

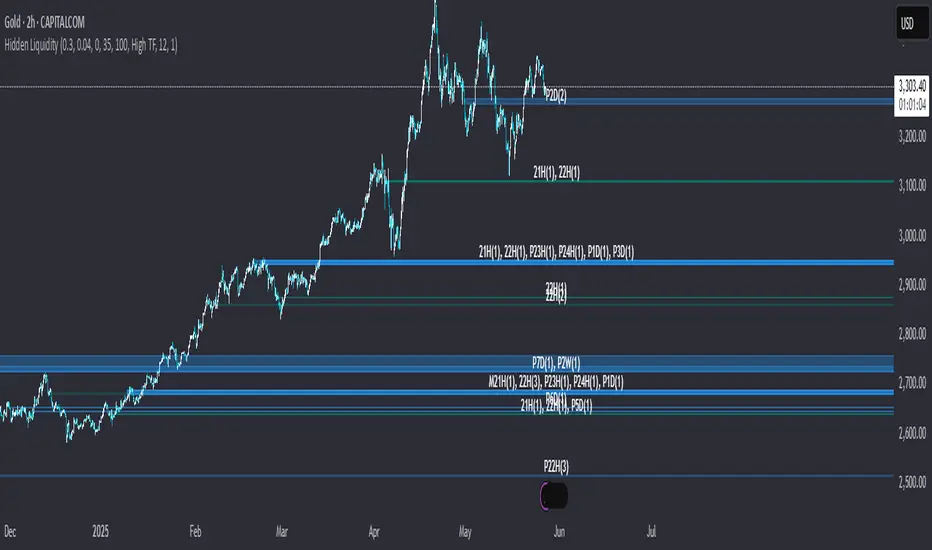
Hidden LiquidityHidden Liquidity Indicator: Detecting Breaker Blocks and Hidden Order Blocks (HOBs)
The Hidden Liquidity Indicator is a powerful tool designed to assist traders in identifying breaker blocks and hidden order blocks (HOBs). By analyzing untouched candle bodies within order blocks, it provides a systematic approach to evaluating fair value gaps (FVGs) and order blocks based on engulfing candles.
Features of the Hidden Liquidity Indicator
This indicator effectively differentiates between complete HOBs, partial HOBs and partially mitigated HOBs (PMHOBs), allowing traders to assess market structure with precision. The key classifications include:
HOB (Hidden Order Block): The candle body fully aligns within the FVGs without being touched by wicks, establishing a strong and reliable breaker block.
PMHOB (Partial Mitigated Hidden Order Block) : The candle body is mitigated by less than 50%, making it a weaker version of the Hidden OB.
PHOBs (Partial Hidden Orderblock) : The candle body fits at least by 50% in the FVG making it also weaker than a common HOB
For an HOB to be considered valid, its equilibrium must be crossed by the FVGs, ensuring a focused and high-quality analysis of market structure.
Visualization and Market Structure Analysis
The Hidden Liquidity Indicator utilizes distinct color codes to enhance readability and clarity:
Bullish HOBs – Green
Bearish HOBs – Red
PMHOBs – Orange
PHOBs - Blue
Multi-Timeframe Analysis (MTF)
The indicator is capable of identifying HOBs,PHOBS and PMHOBs across all timeframes. Traders can seamlessly integrate their preferred timeframes by configuring the settings in TradingView.
Settings
You can choose wether you want the indicator to show PHOBs and PMHOBs
Why Use the Hidden Liquidity Indicator?
This indicator provides a structured and precise methodology for analyzing order blocks and breaker blocks. By focusing on untouched candle bodies and equilibrium levels, it offers a unique perspective on market structure that is often overlooked by traditional order block indicators. Its multi-timeframe analysis capability makes it an indispensable tool for traders seeking to refine their market strategy and enhance decision-making.
This guide serves as a comprehensive reference for optimizing the Hidden Liquidity Indicator, enabling traders to leverage its full potential for effective market analys
SYNC PROTrading-Sessions & Opening Prices – Erklärung & Anwendung
Der Finanzmarkt ist in verschiedene Handelssitzungen (Sessions) unterteilt, die von den wichtigsten globalen Finanzzentren bestimmt werden. Jede dieser Sitzungen hat spezifische Merkmale in Bezug auf Liquidität, Volatilität und Handelsmuster. Zusätzlich spielen die Opening Prices (Eröffnungspreise) eine entscheidende Rolle für die Marktrichtung und das institutionelle Orderflow-Verhalten.

ICT Kill ZonesA simple way to ensure you are trading at the best Time of Day to maximize volatility and volume. I highly suggest using this with the ICT Concepts algo from LUX ALGO. Enjoy! Let me know if there are any other scripts you'd like to see! This is my first one.

Sessions for Indices @brkdgndrmzICT Killzone Sessions Boxes & Deviations is a convenience indicator that marks out past and future ICT killzones for AM Session, PM Session, and am 08:20 open.
The boxes highlights the highest and lowest candle opens of that session/killzone, which is what the deviations are based on. Two lines mark out the highest high and lowest low of that session.
All times are set to GMT-5 so these boxes should work across most exchanges. Times and code can be changed if a few don't match up.
Included are week of day labels for your convenience.
It is seen in the time period of am 08:20 - 5m.
For those who are unfamiliar, ICT Killzones are optimal times to look for trades during or before a session, often providing entry for trades with orderblock tests, FVG fills or stophunts.
Please note: This indicator only works well on 1HR timeframe and below. The default max timeframe setting is set to 60min, which can be changed in the menu.

Sessions for Forex @brkdgndrmzICT Killzone Sessions Boxes & Deviations is a convenience indicator that marks out past and future ICT killzones for Asia, London, and New York, London Close and CBDR.
The boxes highlights the highest and lowest candle opens of that session/killzone, which is what the deviations are based on. Two lines mark out the highest high and lowest low of that session.
This indicator also includes New York midnight opening price and a vertical divider showing you that time.
All times are set to GMT-5 so these boxes should work across most exchanges. Times and code can be changed if a few don't match up.
Included are week of day labels for your convenience.
For those who are unfamiliar, ICT Killzones are optimal times to look for trades during or before a session, often providing entry for trades with orderblock tests, FVG fills or stophunts.
Please note: This indicator only works well on 1HR timeframe and below. The default max timeframe setting is set to 60min, which can be changed in the menu.


Magic Price Action Concepts✨ Magic Price Action Concept - Auto | Advanced Trading Indicator for TradingView
Magic Price Action Concept - Auto is a cutting-edge market structure trading indicator designed to identify Break of Structure (BOS), Change of Character (CHoCH), Order Blocks, Fair Value Gaps (FVG), and more. This AI-enhanced Smart Money Concepts (SMC) tool helps traders analyze forex, stocks, crypto, and indices with precision, making trend identification and liquidity mapping fully automated.
🔥 Key Features:
✅ Automated Market Structure Analysis – Detects BOS, CHoCH, and swing/internal structures effortlessly.
✅ Smart Order Blocks & Fair Value Gaps – Identify high-probability entry & exit zones with ease.
✅ Multi-Timeframe Trend Scanner (MTF) – Analyzes trends across 15m, 1H, 4H, and Daily charts.
✅ Premium vs. Discount Zones – Visualize market inefficiencies and liquidity levels instantly.
✅ Works for All Markets – Ideal for forex, stocks, crypto, commodities, and indices.
📊 Upgrade Your Trading Strategy – Gain a professional trading edge with Magic Price Action Concept - Auto and dominate the markets.
💡 Best for: Forex traders, crypto traders, smart money trading, price action traders, and technical analysts.
🚀 Get Magic Price Action Concept - Auto on TradingView Now & Trade Like a Pro!
#MagicPriceAction #TradingView #PriceAction #SmartMoneyConcepts #ForexTrading #CryptoTrading #OrderBlocks #FairValueGaps #MarketStructure #StockMarket #DayTrading #SwingTrading #TradingIndicator #BreakOfStructure #ChangeOfCharacter #TechnicalAnalysis #ForexSignals #TradeLikeAPro

ddawg TF BoxUse this indicator to help visualize higher timeframe candles on top of your lower timeframe chart. Helpful for studying market movement.

Breaker Blocks MultiTimeframe
This indicator is a refined take on ICT's "Breaker Blocks" also known as Unicorns
This indicator only displays the body part of blocks, instead of including wicks like many other indicators do.
This script indentifies Hidden Liquidity - breaker blocks that are order blocks through a Fair Value Gap, which can be a good entry point when used in conjunction with ICT principals.
The indicator will only show timeframes that are higher than or the same as the current chart timeframe.
For Example, only blocks 12h or higher will show on a 12 hour chart. It will not show 4h blocks on a 12h chart. You would need to go to a 4h chart to see all Breaker Blocks that are 4h or higher drawn.
There is options to change the colours of the boxes.
There is options to weaken the colour of blocks that have been tapped by a wick and thus partially mitigated.
There is a 0.5 level drawn on each box too which can also be a good entry point.
Please do your own research and backtesting.
Current Timeframes available include: 1h, 4h, 8h, 12h, 1D, 2D, 3D, 4D, 5D, 1W, 1M
FOR USE: Please contact via message here on Trading View. Access provided for a 1 month trial and then lifetime for set fee.

Order Blocks MultiTimeframeThis indicator is a refined take on ICT's "Order Blocks" also known as Supply and Demand
This indicator only displays the body part of blocks, instead of including wicks like many other indicators do.
This script indentifies Order Blocks which can be a good entry point when used in conjunction with ICT principals.
The indicator will only show timeframes that are higher than or the same as the current chart timeframe.
For Example, only blocks 12h or higher will show on a 12 hour chart. It will not show 4h blocks on a 12h chart. You would need to go to a 4h chart to see all Order Blocks that are 4h or higher drawn.
There is options to change the colours of the boxes.
There is options to weaken the colour of blocks that have been tapped by a wick and thus partially mitigated.
There is a 0.5 level drawn on each box too which can also be a good entry point.
Please do your own research and backtesting.
Current Timeframes available include: 1h, 4h, 8h, 12h, 1D, 2D, 3D, 4D, 5D, 1W, 1M
FOR USE: Please contact via message here on Trading View. Access provided for a 1 month trial and then lifetime for set fee.

F!72 Dynamic Stoch KDJF!72 Dynamic Stoch KDJ
The F!72 Dynamic Stoch KDJ is an advanced momentum oscillator designed to enhance trend identification, overbought/oversold (OB/OS) zone detection, and volatility analysis. By integrating Stochastic RSI with the KDJ framework, this indicator provides a precise and adaptive approach to market dynamics across multiple timeframes.
Core Methodology: Understanding the KDJ Indicator
The KDJ indicator expands upon the traditional Stochastic Oscillator by introducing the J Line, a calculated momentum component that offers enhanced responsiveness to market fluctuations. The three primary components of this indicator are:
%K Line – Measures price momentum relative to recent highs and lows.
%D Line – A smoothed version of %K, acting as a signal confirmation tool.
J Line – A highly sensitive momentum extension, capable of detecting volatility spikes and early trend reversals before standard indicators react.
By incorporating the J Line, the indicator offers a more refined reading of price acceleration and deviation, making it particularly effective in high-volatility environments.
Adaptive Timeframe-Based Parameters
Unlike static oscillators, the F!72 Dynamic Stoch KDJ dynamically adjusts its length parameters based on the chart’s timeframe, optimizing readings for different trading styles:
Scalping Mode (Short-term) – Applied for timeframes up to 60 minutes, prioritizing quick momentum shifts. In those TF, the standard length is 8
Intraday Mode (Medium-term) – Optimized for timeframes between 1 hour and 1 day, balancing responsiveness with trend confirmation. In this cases the standard length of the indicator is 14
Swing/Position Mode (Long-term) – For daily and higher timeframes, filtering out short-term noise to focus on broader market movements. Here, the standard length is 50.
This adaptive parameterization ensures that traders receive relevant and context-specific momentum signals, whether executing short-term scalps or analyzing macro trends.
Key Features & Usability Enhancements
1) Overbought & Oversold Zones with Extreme Levels
Standard OB/OS thresholds at 80 and 20, identifying potential trend exhaustion and reversal points.
Extended extreme zones enhance detection of high probability mean-reversion opportunities in overextended markets.
2) J Line as a Volatility Detector
The J Line excels at capturing sharp price movements, making it a powerful tool for momentum acceleration analysis.
When the J Line sharply diverges from the %K and %D lines, it signals an impending trend shift or breakout.
3) Divergence Detection for Momentum Shifts
Automatic bullish and bearish divergences indicate momentum weakening or trend continuation potential, even when price action seems stable.
Hidden divergences help confirm trend strength during retracements.
4) Smart Alerts for Key Market Events
Alerts trigger when the %K Line enters Overbought/Oversold zones, providing actionable trade setups.
Crossovers between %K and %D Lines highlight potential trend reversals or continuation signals.
5) Customizable Smoothing for Precision Trading
Users can adjust %K and %D smoothing settings, fine-tuning the indicator’s sensitivity based on market conditions and individual trading preferences.
Technical Implementation
Developed in Pine Script V6 , ensuring compatibility with TradingView ’ s standard functions and calculations.
This guarantees accuracy and reliability, with all indicator values reflecting real-time market conditions without external data dependencies.
Disclaimer
This indicator is intended for technical analysis purposes only and does not constitute financial advice. Markets are inherently unpredictable, and past performance is not indicative of future results. Traders should perform independent analysis and apply risk management strategies when utilizing this tool.
