Multitimeframe


Very Steep & Crossed Lin Reg_Published Ver.1.1このスクリプトについて/Summary of this Script
このスクリプトは、LinRegが急上昇をしている銘柄をTrading Viewのスクリーニングで発見するためのものです。LinRegが急上昇する過程で、下側の線並びに50MAなど他の指標との重なりのあるポイントでエントリーすることで、低リスクエントリーを可能にすることを狙っています。チャート上で使用するものではありません。
This script is for screening stocks that have "Very steep & crossed, triangle shaped LinReg" chart.
To find out stocks that have those shaped chart as much as possible, it helps our low risk entry strategy.
このスクリプトの目的/This Script's objective, condition & specification is as following
<目的>
TradingViewのリストにある銘柄の中から、線形回帰が急上昇して、交差している銘柄をスクリーニング結果に表出すること。
<条件>
-今日以降で線形回帰が交差するチャート
<仕様>
**Trading ViewのPine script ver5**
このスクリプトの使い方How to use this script for Trading View Pine Screening
日本語
1. チャートにPine Scriptを設定する
2. チャート上では非表示にする (スクリーナー用のため)
3. Pineスクリーナー用のリストを作成する(新規が良い)
4. Pine Screenerの画面(jp.tradingview.com/pine-screener/)で、「スクリーニングするリストの指定」 → 「使用するPineスクリーナーの選択」をする
5. Pine ScreenerのScreener Signalの設定をする (0.1以上など)
6. スキャンを実行する
7. 結果が出た銘柄を入れるための、リストを作成する(新規)
8. Trading Viewのスーパーチャートで、目視検証をする(前提は日足で、急上昇で三角に交差しているLinReg銘柄を探すこと)
English
How to use this script for Trading View Pine Screening
1. Set Pine Script on the chart
2. Hide it on the chart (for the screener)
3. Create a list for the Pine Screener (a new one is better)
4. On the Pine Screener screen (/pine-screener/), select "Specify list to screen" → "Select Pine Screener to use"
5. Set the Screener Signal for Pine Screener (0.1 or higher, etc.)
6. Run the scan
7. Create a list (new) to put stocks with results
8. Visually verify on Trading View's Super Chart (the premise is to look for LinReg stocks that are rising sharply and crossing a triangle on the daily chart)
注意事項/Notes : Not prediction, assumption based on past data of Linear Regression
Pine Script doesn't have capability to predict future chart shape.
So, this script is developed provides selecting similar chart pattern of "steep triangle shaped linear regression" based on using past data.
Definition is as followings.
*These description will be translated in English soon, but not yet as of 24th Feb, 2025.
🔎 交差の定義
「線形回帰の上側の線と下側の線が交差する」という状況は、以下のように定義できます:
過去のデータから 上側の線と下側の線の距離が縮まっている(収束している)
その傾向が続くと 近い将来に交差する可能性がある
📌 交差の可能性を定義するための要素
以下の3つの要素を組み合わせて、交差の可能性をスクリーニングできます。
① 上側の線と下側の線の差(スプレッド)が縮小している
pinescript
コピーする
編集する
spread_now = linreg_upper - linreg_lower
spread_prev = linreg_upper - linreg_lower
spread_shrinking = spread_now < spread_prev
spread_now … 現在の線形回帰バンドの幅
spread_prev … 1本前のローソク足の線形回帰バンドの幅
spread_shrinking … バンド幅が縮小している(交差しそう)
② 線形回帰の上側の線の傾きが下がり、下側の線の傾きが上がっている
pinescript
コピーする
編集する
slope_upper = linreg_upper - linreg_upper
slope_lower = linreg_lower - linreg_lower
converging = slope_upper < 0 and slope_lower > 0
slope_upper … 上側の線の傾き(負なら下降)
slope_lower … 下側の線の傾き(正なら上昇)
converging … 上側の線が下がり、下側の線が上がっている(交差に向かっている)
③ 交差までの推定日数が近い
pinescript
コピーする
編集する
estimated_days_to_cross = spread_now / (abs(slope_upper) + abs(slope_lower))
soon_to_cross = estimated_days_to_cross < 5
estimated_days_to_cross … 交差するまでの推定日数(幅 ÷ 傾きの変化量)
soon_to_cross … 5日以内に交差しそうなら true
✅ 交差の可能性をスクリーニング
pinescript
コピーする
編集する
screener_condition = spread_shrinking and converging and soon_to_cross
spread_shrinking … 線形回帰バンドの幅が縮小
converging … 上側の線が下降し、下側の線が上昇
soon_to_cross … 5日以内に交差しそう
📌 TradingView の Pine Script に組み込む
これらの要素を組み合わせて、TradingView のスクリーニング用 Pine Script に落とし込むと、以下のようになります。
pinescript
コピーする
編集する
//version=5
indicator("Linear Regression Convergence Screener", overlay=false)
// === 設定 ===
length = 100 // 線形回帰の計算期間
mult = 2.0 // 標準偏差の倍率
// === 線形回帰の計算 ===
linreg_mid = ta.linreg(close, length, 0) // 中心線
std_dev = ta.stdev(close, length) // 標準偏差
linreg_upper = linreg_mid + (std_dev * mult) // 上側の線
linreg_lower = linreg_mid - (std_dev * mult) // 下側の線
// === 交差の可能性の判定 ===
// ① 上側の線と下側の線の差が縮小
spread_now = linreg_upper - linreg_lower
spread_prev = linreg_upper - linreg_lower
spread_shrinking = spread_now < spread_prev
// ② 上側の線が下がり、下側の線が上がっている
slope_upper = linreg_upper - linreg_upper
slope_lower = linreg_lower - linreg_lower
converging = slope_upper < 0 and slope_lower > 0
// ③ 交差までの推定日数が5日以内
estimated_days_to_cross = spread_now / (abs(slope_upper) + abs(slope_lower))
soon_to_cross = estimated_days_to_cross < 5
// === スクリーニング条件 ===
screener_condition = spread_shrinking and converging and soon_to_cross
// === プロット(スクリーニング結果) ===
plot(screener_condition ? 1 : na, title="Screener Signal", style=plot.style_columns, color=color.green)
✅ スクリプトの動作
交差する可能性のある銘柄をスクリーニング
過去のデータをもとに「バンドが縮小」「上側が下降」「下側が上昇」「5日以内に交差しそう」な銘柄を選定
TradingViewのスクリーナーで Screener Signal が 1 の銘柄をチェック
🔎 まとめ
📌 交差の可能性を定義するには?
バンドの幅が縮小
上側の線が下降し、下側の線が上昇
交差までの推定日数を計算
📌 スクリプトで交差の可能性をスクリーニング
spread_shrinking → 線形回帰バンドの幅が縮小
converging → 上側の線が下がり、下側の線が上がっている
soon_to_cross → 交差までの推定日数が5日以内
📌 TradingViewのスクリーナーで使う
plot() を追加 してエラー回避
Screener Signal が 1 の銘柄をスクリーニング

Automate Multi-Timeframe Period Separators - By KaVeHVersion 1.0
Overview
The Automate Multi-Timeframe Period Separators indicator automatically plots vertical separators on your chart to visually distinguish different time intervals. It helps traders quickly identify key session changes, daily transitions, and custom time references without manually drawing lines.
Unlike standard period separators, this script offers enhanced customization options, supports multiple timeframes, and adapts dynamically to different chart resolutions.
Key Features
✅ Multi-Timeframe Support – Works across all timeframes, from seconds to months.
✅ Customizable Time References – Choose between session start time or midnight (00:00) as the reference point.
✅ Time Zone Flexibility – Supports multiple exchange-based and user-defined time zones.
✅ Multiple Line Styles – Customize separator lines with solid, dashed, or dotted styles.
✅ Performance Optimized – Efficiently manages up to 500 separators without cluttering the chart.
How It Works
🔹 This script automatically detects session changes or day boundaries based on user preferences.
🔹 It dynamically adjusts separators based on the current chart timeframe to ensure clarity and relevance.
🔹 Users can modify separator colors, line styles, widths, and display preferences from the settings panel.
What Makes This Indicator Unique?
🔹 More Flexible than Built-in TradingView Separators – Allows custom time references, multiple time zones, and improved styling options.
🔹 Not a Simple Clone – Unlike existing open-source scripts, this indicator introduces dynamic MTF logic, optimized visibility conditions, and smarter separator management.
🔹 Continuously Updated – This is the first official release, and future updates will refine the logic further.
Timeframe Alignment:
M1 timeframe -> M15 separator
M3 timeframe -> M30 separator
M5 timeframe -> H1 separator
M15 timeframe -> H4 separator
H1 timeframe -> D1 separator
H4 timeframe -> W1 separator
How to Use
1️⃣ Add the indicator to your chart.
2️⃣ Configure your preferred time reference (Session Start / Midnight).
3️⃣ Choose a custom time zone if necessary.
4️⃣ Adjust separator styles, colors, and line width to fit your trading strategy.
5️⃣ Enjoy a clearer, more structured chart layout!
🔹 Important Note:
This is not a duplicate of any existing open-source indicator. It introduces unique logic for better time-based chart structuring, ensuring a clutter-free trading experience.
💡 If you have any suggestions or feature requests, feel free to share them!
🚀 Enhance Your Trading with Smarter Time Separators!

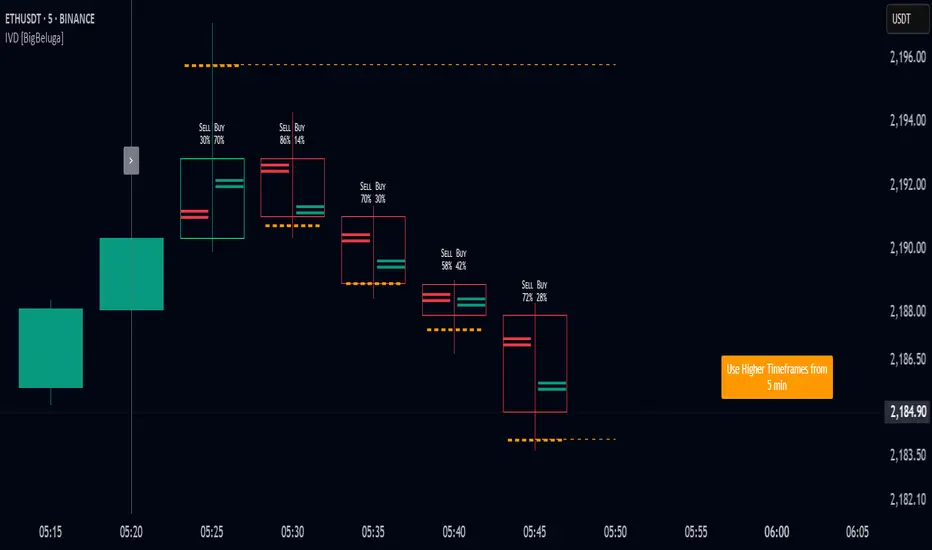
Intrabar Volume Distribution [BigBeluga]Intrabar Volume Distribution is an advanced volume and order flow indicator that visualizes the buy and sell volume distribution within each candlestick.
🔔 Before Use:
Turn off the background color of your candles for clear visibility.
Overlay the indicator on the top layout to ensure accurate alignment with the price chart.
🔵 Key Features:
Inside Bar Volume Visualization:
Each candlestick is divided into two columns:
Left column displays the sell % volume amount.
Right column displays the buy % volume amount.
Provides a clear representation of buyer-seller activity within individual bars.
Percentage Volume Labels:
Labels above each bar show the percentage share of sell and buy volume relative to the total (100%).
Quickly assess market sentiment and volume imbalances.
Point of Control (POC) Levels:
Orange dashed lines mark the POC inside each bar, indicating the price level with the highest traded volume.
Helps identify key liquidity zones within individual candlesticks.
Multi-Timeframe Volume Analysis:
The indicator automatically uses a timeframe 20-30 times lower than the current one to gather detailed volume data.
For each higher timeframe candle, it collects 20-30 bars of lower timeframe data for precise volume mapping.
Each bar is divided into 100 volume bins to capture detailed volume distribution across the price range.
Bins are filled based on the aggregated volume from the lower timeframe data.
Lookback Period:
Allows traders to select how many bars to display with delta and volume information.
The beginning of the selected lookback period is marked with a gray line and label for quick reference.
Indicator displays up to 80 bars back
🔵 Usage:
Order Flow Analysis: Monitor buy/sell volume distribution to spot potential reversals or continuations.
Liquidity Identification: Use POC levels to locate areas of strong market interest and potential support/resistance.
Volume Imbalance Detection: Pay attention to percentage labels for quick recognition of buyer or seller dominance.
Scalping & Intraday Trading: Ideal for traders seeking real-time insight into order flow and volume behavior.
Historical Analysis: Adjust the lookback period to analyze past price action and volume activity.
Intrabar Volume Distribution is a powerful tool for traders aiming to gain deeper insight into market sentiment through detailed volume analysis, allowing for more informed trading decisions based on real-time order flow dynamics.
Market DNA: Structure, Volume, Range, and SessionsMarket DNA: Structure, Volume, Range, and Sessions**
The Market DNA indicator combines market structure, volume analysis, trading ranges, and global trading sessions into a single, comprehensive tool for traders. It helps identify key price levels, volume patterns, consolidation phases, and active market periods, enabling informed trading decisions.
Market Structure Detects swing highs and lows using `ta.pivothigh` and `ta.pivotlow`, plotting them as red/green triangles to highlight support/resistance and trend reversals.
- Fractal Volume Zones (FVG): Highlights areas of significant buying/selling pressure by comparing current volume to an average over a lookback period; high-volume zones are marked with a semi-transparent blue background.
- Trading Range: Defines a price channel using the Average True Range (ATR) and a multiplier, creating upper/lower bands to identify consolidation, breakouts, and potential trade levels.
- Market Sessions: Highlights major global trading sessions (Asia, Europe, US) with colored backgrounds (purple, teal, yellow) to indicate liquidity and volatility shifts.
How It Works
- Swing points help analyze trends and reversals.
- FVG confirms price movements with high volume for stronger signals.
- Trading range bands assist in identifying breakout opportunities and setting stops/take-profits.
- Session highlights allow traders to adapt strategies based on regional activity.
Customization
- Adjust `swing_length` for sensitivity in detecting turning points.
- Modify `volume_lookback` to control volume averaging.
- Tune `range_multiplier` for wider/narrower trading bands.
- Enable/disable session highlighting via `session_highlight`.
Use Cases
- Identify trends and key levels using swing points and FVG.
- Spot breakout opportunities with trading range bands.
- Adapt strategies to regional trading sessions for optimal timing.
This all-in-one indicator provides a clear, customizable view of the market, empowering traders to make data-driven decisions across asset classes and timeframes.

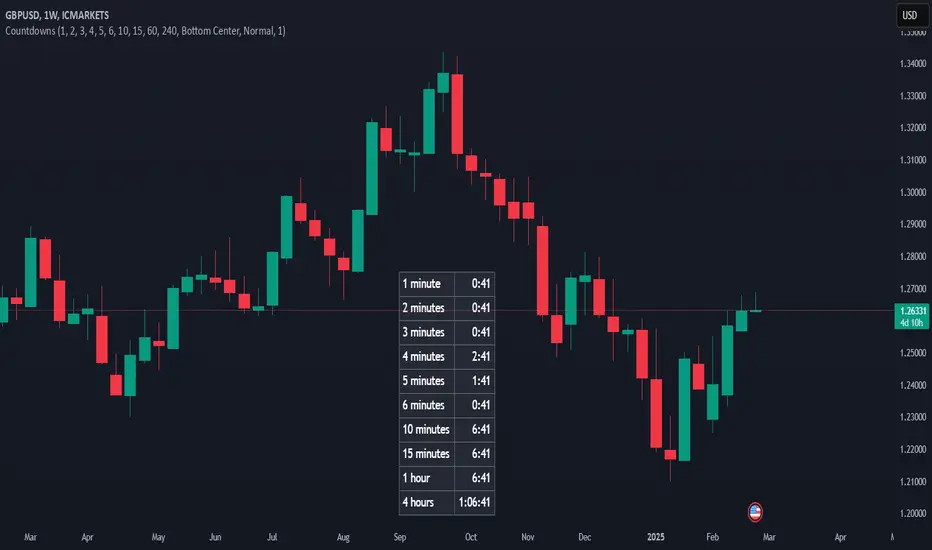
CountdownsDisplays a table of countdowns of the current bar on different time frames.
It shows how much time is left until candle close if we were to change the chart to that time frame, but without the need to do so.
An adaptation of 'Countdown Candle RRS' by reza9300 (), including up to 10 customizable time frames, plus some additional table styling options.
Usage:
Add the indicator to your chart to see a table of countdown timers.
Adjust the settings to customize the appearance and to check / uncheck which time frames to include.
Notes:
Updates are based on price changes, so counters may appear 'frozen' or 'lagging' when there is no real time tick update in price.
Ema SinyalBu indikatör istediğiniz periyotte EMA sinyallerinin fiyata göre al sat durumunu gösterir. (İstediğiniz Ema Seviyesini seçebilirsiniz.)

Weekly, Daily, 4H, 1H, 15M & Monthly High/LowThis Indicator is useful to identify High lows in different timeframes.

OHLC OLHC - Monthly, Weekly, Daily and HourlyThis indicator plots the previous day's (or any selected timeframe’s) Open, High, Low, and Close (OHLC) levels on the current chart. It helps traders analyze historical price levels to identify support and resistance zones.
Key Features:
Multi-Timeframe Support:
Users can select a timeframe (D, W, M, etc.) to fetch previous OHLC data.
The script requests OHLC values from the selected timeframe and overlays them on the current chart.
Customizable Display Options:
Users can choose to display only the last OHLC levels instead of all past session levels.
Users can extend the OHLC lines across the chart.
Background Highlighting:
The script fills the background only for the Previous Open and Previous Close levels, making them visually distinct.
Previous High and Low levels do not have background color.
This script is particularly useful for day traders and swing traders who rely on key price levels to make trading decisions. Let me know if you need further refinements!

Serum Toolkit Tracker [ST]Serum Toolkit Tracker is a comprehensive tool designed to analyze and verify the information generated by Serum Toolkit functions across multiple tickers and timeframes selected by the user.
Features:
1.Customizable Design:
> Adjust the widget size and location to suit your needs.
> Personalize colors to match your style or visual preferences.
> The parameters of each tool are fully customizable, adapting to the specific needs of each trader.
> Enable or disable only the information you wish to observe, allowing for a more focused analysis.
> Enable or disable only the tickers you wish to monitor.
2.Latest Signal:
> Displays the signals generated by the main Serum indicator.
> Includes a counter indicating the number of candles since the last signal was triggered.
3.Current Trend Status:
> Reflects the trend direction of the ticker, similar to the main indicator’s dashboard.
4.Current Hyper Cloud Status:
Green Background: Indicates a Bullish condition.
Red Background: Indicates a Bearish condition.
Upper: Price above the cloud.
Inner: Price within the cloud.
Lower: Price below the cloud.
5.Current Dynamic Trail Status:
Bullish ❋: Signals a squeeze when the dynamic trail is bullish.
Bearish ❋: Signals a squeeze when the dynamic trail is bearish.
6.Current Market Bias Status:
Green Background: Indicates a Bullish bias.
Red Background: Indicates a Bearish bias.
> Displays the distance from the current price to the market bias (xx%).
7.Current Trend Driver Status.
8.Market Structure Status:
Green Background: Indicates Bullish structure.
Red Background: Indicates Bearish structure.
> Shows a counter when a Break of Structure (BOS) is detected.
9.Custom Sorting:
> Organize data in ascending or descending order based on:
Signal counter.
Distance of the price from the market bias.

Follow Line Indicator// Follow The Line
// This Pine Script™ code is subject to the terms of the Mozilla Public License 2.0 at mozilla.org
// © DeeKay677
// Originalay found at usethinkscript.com
// Originally authors: Converted to ToS from TV by bigboss. Original © Dreadblitz
// DISCLAIMER:
// This script is for informational and educational purposes only. It should not be considered financial advice, trading advice, or an endorsement of any particular trading strategy.
// Trading involves significant risk, and past performance is not indicative of future results.
// The author of this script assumes no responsibility for any trading losses or financial decisions made using this script.
// Users should conduct their own research, consult a professional financial advisor, and use proper risk management before making any investment decisions.
// By using this script, you acknowledge and agree that the author is not liable for any damages, losses, or consequences resulting from its use.

Cumulative Price Change AlertCumulative Price Change Alert
Version: 1.0
Author: QCodeTrader 🚀
Overview 🔍
The Cumulative Price Change Alert indicator analyzes the percentage change between the current and previous open prices and sums these changes over a user-defined number of bars. It then generates visual buy and sell signals using arrows and labels on the chart, helping traders spot cumulative price momentum and potential trading opportunities.
Key Features ⚙️
Customizable Timeframe 🕒:
Use a custom timeframe or default to the chart's timeframe for price data.
User-Defined Summation 🔢:
Specify the number of bars to sum, allowing you to analyze cumulative price changes.
Custom Buy & Sell Conditions 🔔:
Set individual percentage change thresholds and cumulative sum thresholds to tailor signals for
your strategy.
Visual Alerts 🚀:
Displays green upward arrows for buy signals and red downward arrows for sell signals directly
on the chart.
Informative Labels 📝:
Provides labels with formatted percentage change and cumulative sum details for the analyzed
bars.
Versatile Application 📊:
Suitable for stocks, forex, crypto, commodities, and more.
How It Works ⚡
Price Change Calculation ➗:
The indicator calculates the percentage change between the current bar's open price and the
previous bar's open price.
Cumulative Sum ➕:
It then sums these percentage changes over the last N bars (as specified by the user).
Signal Generation 🚦:
Buy Signal 🟢: When both the individual percentage change and the cumulative sum exceed
their respective buy thresholds, a green arrow and label are displayed.
Sell Signal 🔴: Conversely, if the individual change and cumulative sum fall below the sell
thresholds, a red arrow and label are shown.
How to Use 💡
Add the Indicator ➕:
Apply the indicator to your chart.
Customize Settings ⚙️:
Set a custom timeframe if desired.
Define the number of bars to sum.
Adjust the buy/sell percentage change and cumulative sum thresholds to match your trading
strategy.
Interpret Visual Cues 👀:
Monitor the chart for green or red arrows and corresponding labels that signal potential buy or
sell opportunities based on cumulative price movements.
Settings Explained 🛠️
Custom Timeframe:
Select an alternative timeframe for analysis, or leave empty to use the current chart's timeframe.
Number of Last Bars to Sum:
Determines how many bars are used to compute the cumulative percentage change.
Buy Condition - Min % Change:
The minimum individual percentage change required to consider a buy signal.
Buy Condition - Min Sum of Bars:
The minimum cumulative percentage change over the defined bars needed for a buy signal.
Sell Condition - Max % Change:
The maximum individual percentage change threshold for a sell signal.
Sell Condition - Max Sum of Bars:
The maximum cumulative percentage change over the defined bars for triggering a sell signal.
Best Use Cases 🎯
Momentum Identification 📈:
Quickly spot strong cumulative price movements and momentum shifts.
Entry/Exit Signals 🚪:
Use the visual signals to determine potential entry and exit points in your trading.
Versatile Strategy Application 🔄:
Effective for scalping, swing trading, and longer-term analysis across various markets.
UPD: uncheck labels for better performance

Multi-Timeframe EMAsMulti 200EMAs displayed on any timeframe. You can configure them in the settings

Lunar Phase Indicator [ by Nikhil Kunche ]
The Lunar Phase Indicator & Strategy is a proprietary, high-precision lunar cycle-based trading system designed for traders seeking an independent, self-sustaining strategy with quantifiable edge. Unlike traditional technical indicators that require integration into existing strategies, this tool alone can serve as a standalone strategy with well-defined trade signals based on astronomical cycles.
This system leverages the lunar cycle’s mathematical predictability to dynamically generate trading signals by detecting key lunar phases. Full Moon signals a Long entry, while New Moon signals a Short entry. The indicator intelligently overlays candle color changes—yellow for Full Moon (Long bias), purple for New Moon (Short bias)—allowing traders to visually track lunar influence on price action.
Extensively backtested with robust results, this premium indicator + strategy bundle is available exclusively for paid subscribers.
Core Functionalities & Technical Aspects
1. Lunar Cycle Computation
Utilizes a high-precision synodic month constant (29.530588853 days) for lunar phase calculations.
Employs a Julian Date transformation to accurately map price data to lunar cycle events.
Implements a custom phase threshold algorithm to detect exact Full Moon and New Moon occurrences.
2. Dynamic Candle Overlay & Visual Representation
Automated candle coloring:
Full Moon (Long Bias): Candles are tinted yellow.
New Moon (Short Bias): Candles are tinted purple.
Lunar phase detection symbols:
🌑 New Moon (Top of price bars, Short signal)
🌕 Full Moon (Bottom of price bars, Long signal)
Adaptive timeframe logic optimizes the display across different chart resolutions.
3. Automated Trading Strategy
Self-contained trading logic generates precise Long & Short entries without requiring additional indicators.
Trade execution conditions:
Full Moon → Long Entry: If no active Short position, initiates a Long trade.
New Moon → Short Entry: If no active Long position, initiates a Short trade.
Trade exits dynamically when phase shifts.
Profitability tracking module:
Displays active trade status, net profit, and win rate on the chart.
**No repainting—**signals are fully systematic and verifiable via backtesting.
4. Backtesting & Performance
Designed with realistic capital allocation, configurable via percent equity-based position sizing.
Integrated historical performance tracking enables detailed evaluation of win rates, profit factor, and strategy efficiency.
Highly optimized execution framework ensures seamless performance across all markets and timeframes.
Why Choose This Indicator & Strategy?
✅ Stand-alone strategy: No need for external indicators—lunar cycles alone determine trade signals.
✅ Quantifiably effective: Built-in backtesting engine validates the edge.
✅ Zero lag: Uses predictive astronomical modeling, unlike lagging indicators.
✅ Exclusive to subscribers: This proprietary strategy is only available to paying users.
💡 Get access now and start leveraging the power of lunar cycles in trading! 🚀🌑🌕

MA Ribbon Buy & Sell SignalsMoving Averages:
The script calculates simple moving averages for 15, 30, 150, and 200 periods and plots them on your chart.
Signal Conditions:
A buy signal is generated when the 15 MA crosses above the 30 MA and the closing price is above the 150 and 200 MAs (indicating an overall uptrend).
A sell signal is generated when the 15 MA crosses below the 30 MA and the closing price is below the 150 and 200 MAs (indicating an overall downtrend).
Visual Cues:
The script uses green arrows below the bar for buy signals and red arrows above the bar for sell signals.

Serum Toolkit [ST]Serum is an advanced tool designed for technical analysis. This indicator combines multiple approaches and algorithms to provide information and make buy and sell decisions, as well as trend and volume analysis. Its integrated features include multiple tools for long-term and short-term analysis.
characteristics
1. Buy/Sell Signals: Trend following signals differentiated by "+" for a stronger or weaker signal, provided with their own take profit. It is important not to follow the signals blindly, since it is advisable to use other types of confirmations for greater effectiveness. You can also adjust the sensitivity of the signals; The higher the value, the fewer false signals you will encounter, but the signals will be delayed further. You should find a middle ground; the default value is a good starting point.
2. Reversal Signals: Reversal signals to help traders find price reversal zones. These are also differentiated by "+" and should not be used as the sole confirmation.
3. Colored Bars: For better visualization of trend-following or reversal signals. You can activate gradient coloring for even better visualization.
4. Dashboard: Provides information on volatility, trend direction and strength, and signals from multiple time periods for quick visualization of market status. You can also customize the size and position.
5. Hyper Cloud: A multifunctional tool to facilitate the detection of trends with potential reversal zones and the ability to modify its position to detect possible rebound areas. Inspired by Ichimoku clouds, but with a modern approach adapted to the current market.
6. Dynamic Trail: Based on the concept of moving averages and volatility, a robust tool to help detect micro-trends. Ideal for confirming follow-up signals. You can also activate the opposite trailing to detect possible reversal zones or anticipate a change in direction.
7. Market Bias: Another approach to trend detection, but with upper and lower bands. Ideal for identifying reversal zones, overbought or oversold levels when the price exits the bands, TP or SL zones, and visualizing volatility when the bands compress or expand.
8. Trend Driver: Basic indicator based on ATR to detect micro and macro trends. You can adjust the periods to suit your preferences.
9. Tools: Basic tools for every trader, fully customizable. Optimized for the current market and the modern trader.
10. Market Structure: Real-time market structure (BOS and CHoCH). Customizable to detect internal structure and swings. Ideal for identifying trends through price action.
11. Order Blocks: Detection of the most significant order blocks based on previous structure and volume profile. You can customize the number of order blocks and the timeframe for greater precision.
12. Alerts: Multiple customized alerts for all tools.
Here are some examples of using Serum’s tools:
example 1:
1. Bullish Hype Cloud.
2. Bullish Market Bias.
3. Strong Bullish Signal.
4. Price made a pullback on Hyper Cloud.
5. Oscillator made a pullback on the long-term moving average.
6. Bullish market structure.
> After observing these conditions, along with a failed bearish signal, we can speculate that the price will have an upward movement.
7. We closed the trade because a bearish divergence was detected, the oscillator is overbought, and there is a bearish cross on the long-term moving average.
example 2:
1. Strong Bullish Signal, accompanied by a candle with a body, engulfing pattern, and breaking the Bollinger Band and opposite Dynamic Trail.
2. Compression of the Bollinger Band, indicating an imminent large price movement (Squeeze).
3. Bullish Dynamic Trail.
4. On the daily timeframe, we have a bullish market structure, and on the 30-minute timeframe, a strong bullish signal.
> After observing these conditions, there is a high probability of a strong bullish movement. We open a long position with a stop loss below the Dynamic Trail.
5. We closed the trade because a bearish divergence was detected, the oscillator is overbought, and there is a bearish cross on the long-term moving average.
example 3:
1. Strong Bearish Signal, accompanied by a candle with a body, engulfing pattern.
2. Price rejection at the Market Bias and Hyper Cloud, both in bearish conditions.
3. Bearish Smart Flow.
> After observing these conditions, there is a high probability of a bearish movement. We open a short position with a stop loss above the last high.
4. We closed the trade because a bullish signal was detected, the oscillator has a bullish signal, and there is a bullish cross on the long-term moving average.
example 4:
1. Bullish reversal signal.
2. Bullish divergence and oversold oscillator.
3. Price rejection at the lower Bollinger Band, forming a hammer candle.
> After observing these conditions, there is a high probability of a bullish countertrend movement. We open a long position with a stop loss below the hammer candle.
4. We closed the trade because a strong bearish reversal signal was detected, the oscillator shows a bearish divergence, and it is below the long-term moving average.
* The indicator is a multifunctional tool that integrates various technical analysis methods to provide trading signals. Its combination of micro and macro trend analysis and the ability to generate alerts make it ideal for traders looking to improve their decision-making in the market. The integration of multiple advanced components allows users to customize the indicator to their specific needs. You can use it to complement your personal strategy or create your own strategy with Serum.
【 It is important to note that trading indicators and any information related to trading strategies are provided solely for educational and informational purposes **DYOR**. They should not be considered financial advice or recommendations for specific trades or investments. It is important to consider these factors when using trading indicators, and PAST PERFORMANCE IS NOT INDICATIVE OF FUTURE RESULTS. Investors are solely responsible for their investment decisions and should carefully evaluate their financial situation, investment objectives, and risk tolerance before making any trades. Additionally, seeking independent financial advice is strongly recommended if needed. The use of trading indicators and the execution of trades are subject to the investor's discretion and responsibility.】

Mon to Fri + LSE and NYSE📌 Highlight Custom Days & Market Hours Indicator 📌
🔹 Overview:
This script allows traders to visually highlight specific weekdays and market sessions directly on their TradingView charts. With customizable checkboxes, you can choose which days of the week to highlight, along with session times for the New York Stock Exchange (NYSE) and London Stock Exchange (LSE).
🔹 Features:
✅ Select individual weekdays (Monday–Friday) to highlight in blue
✅ Highlight NYSE open hours (2:30 PM – 9:30 PM UK time) in green
✅ Highlight LSE open hours (8:00 AM – 4:30 PM UK time) in orange
✅ Ensures NYSE & LSE sessions are only highlighted on weekdays (no weekends)
✅ Clean and simple visualization for enhanced market awareness
🔹 How to Use:
1️⃣ Add the indicator to your TradingView chart
2️⃣ Use the settings panel to enable/disable specific weekdays
3️⃣ Toggle NYSE or LSE session highlights based on your trading preference
🚀 Perfect for traders who follow institutional sessions and want better time-based confluence in their strategies!

CCI EMA RitzThis Pine Script strategy is designed to generate buy and sell signals based on the Commodity Channel Index (CCI) with certain input, while also plotting Exponential Moving Averages (EMAs) for trend confirmation. This strategy helps traders identify momentum shifts while using EMAs as trend filters for additional confirmation. Let me know your suggestions. 🚀

LDO Support and Resistance with Trend LinesUnderstanding the Indicator on Your Chart
Support Lines (Green): These horizontal lines represent price levels where LDO is likely to find buying interest, preventing further declines. They turn a semi-transparent green when the price is above them and blue when below.
Resistance Lines (Blue): These horizontal lines indicate price levels where selling pressure may halt upward movements. They turn a semi-transparent blue when the price is below them and green when above.
Trend Lines (Blue for Resistance, Green for Support): Diagonal lines show the overall trend direction. Blue trend lines indicate resistance (price may struggle to rise above), and green trend lines indicate support (price may find a floor).
Pivots: Small triangles appear above or below candles to mark pivot highs (resistance) and pivot lows (support), helping you identify key turning points.
Customizing the Indicator
You can tweak the indicator’s behavior through the settings panel. Here’s what each input does:
Show Trend Lines? (Default: True)
Enables or disables the display of trend lines on the chart. Set to false to hide trend lines if you only want support/resistance levels.
Choose Higher Time Frame
Select a higher timeframe (e.g., 1H, 4H, 1D) to display support and resistance levels from that timeframe on your current chart (e.g., 5M or 15M).
Pivot Length Settings (Current and Higher Timeframe):
Pivot Length Left Hand Side (Current/HTF): Adjusts how many bars to the left the indicator looks to identify pivot lows (default: 15 for current, 20 for HTF).
Pivot Length Right Hand Side (Current/HTF): Adjusts how many bars to the right the indicator looks to identify pivot highs (default: 10 for current, 15 for HTF).
Increase these values for fewer, more significant pivots; decrease for more frequent pivots.
Pivot Sources (Trend 1 and Trend 2 Pivots):
Select the price source (e.g., low, high) for calculating pivot lows and highs. Default is low for pivot lows and high for pivot highs.
Line Width Settings:
Lower Time Frame Line Width (Default: 5): Sets the thickness of support/resistance lines on the current timeframe.
Higher Time Frame Line Width (Default: 18): Sets the thickness of support/resistance lines on the higher timeframe.
Show Support & Resistance? (Default: True)
Enables or disables the display of horizontal support and resistance lines. Set to false to hide them if you only want trend lines.
Alert Settings (Under “Alerts” Group):
Enable Trend Line Alerts? (Default: True): Turns alerts on or off for trend line hits.
Alert on Resistance Trend Lines? (Default: True): Enables alerts when the price hits resistance trend lines.
Alert on Support Trend Lines? (Default: True): Enables alerts when the price hits support trend lines.
Alert Message: Customize the alert message format (default: “Price hit trend line at {0}”, where {0} is replaced by the price).
Setting Up Alerts
Enable Alerts in the Indicator:
In the indicator settings, ensure “Enable Trend Line Alerts?” is set to true, and choose whether to alert on resistance or support trend lines.
Create a TradingView Alert:
Click the “Alerts” button (bell icon) at the top of the chart.
Select “Create Alert” and choose this indicator from the “Condition” dropdown.
Set the alert frequency (e.g., once per bar, only once), notification method (e.g., email, popup), and save the alert.
Test the Alerts:
ICT SB Time (Lee B)A minimal and clean indicator that simply plots the ICT Silver Bullet time windows for you on the chart with vertical lines.
It also has the option to show other important times, like 00:00, 8:30, and 9:30. Toggles in settings let you change line color, turn any of them off temporarily, and can limit their visibility to only the lower timeframes for less clutter.
I hope you find this indicator useful... and happy trading!
Lee B

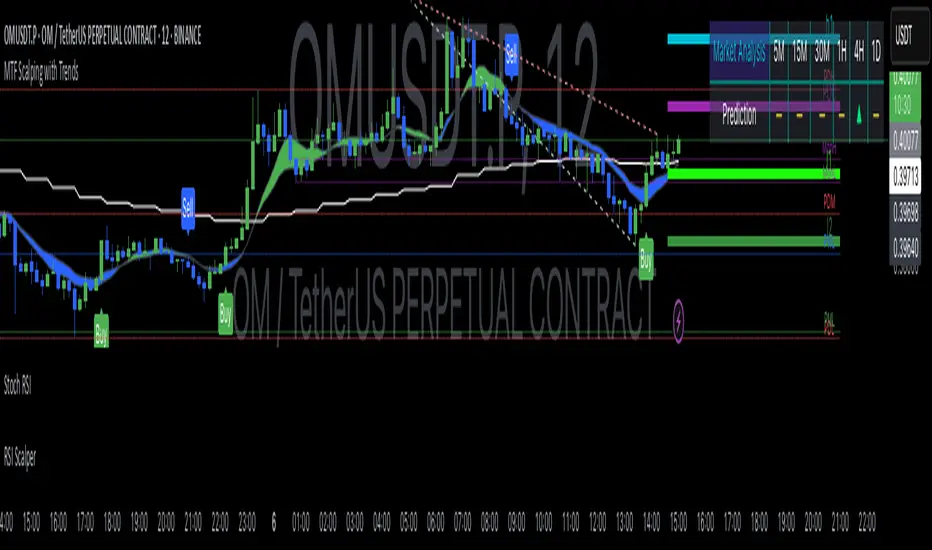
MTF Sentiment Pro [THRAXX]Thraxx MTF Sentiment Pro - Advanced Multi-Timeframe Analysis with Volume Integration
A powerful, fully customizable multi-timeframe sentiment indicator that combines price action, volume analysis, and multiple technical indicators to provide comprehensive market analysis across any timeframe combination.
Key Features:
- Custom Timeframe Analysis
- Fully customizable timeframe selection
- Choose and modify any 7 timeframes for analysis
- Individual timeframe visibility toggles
- Dynamic LTF (Lower Timeframe) and HTF (Higher Timeframe) calculations
- Advanced Technical Analysis Integration
- EMA (Exponential Moving Average) analysis with customizable length
- RSI (Relative Strength Index) integration
- MACD (Moving Average Convergence Divergence) signals
- Bollinger Bands analysis
- All technical indicators can be weighted individually
- Volume Analysis Integration
- VWAP (Volume Weighted Average Price) consideration
- OBV (On Balance Volume) analysis
- Customizable weight for volume indicators
- Enhanced accuracy through volume confirmation
- Sentiment Calculation
- Multi-factor scoring system
- Weighted indicator importance
- Combined technical and volume analysis
- Advanced filtering of market noise
- Visual Customization
- Fully customizable color scheme
- Adjustable table position
- Custom text colors
- Flexible header and background styling
- Clean, organized display
- Indicator Settings
- Enable/disable individual indicators
- Adjust indicator parameters
- Customize calculation weights
- Fine-tune analysis sensitivity
Trading Applications:
1. Trend Analysis
- Identify strong trends across multiple timeframes
- Spot potential trend reversals
- Validate trend strength with volume
- Monitor trend alignment
2. Trade Entry/Exit
- Find high-probability entry points
- Confirm trade direction
- Time market exits
- Validate trade decisions
3. Risk Management
- Assess market conditions across timeframes
- Identify conflicting signals
- Gauge trend strength
- Monitor market structure
4. Market Analysis
- Comprehensive market overview
- Multi-timeframe context
- Volume-validated movements
- Technical confirmation
Perfect for:
- Day traders seeking multiple timeframe confirmation
- Swing traders analyzing trend strength
- Position traders monitoring market structure
- Any trader wanting comprehensive market analysis
The indicator combines multiple forms of analysis into one easy-to-read display, helping traders make more informed decisions based on price action, volume, and technical analysis across their chosen timeframes.
Note: This indicator works best when used in conjunction with your existing trading strategy and risk management rules. The multiple analysis factors help confirm trades but should not be used as the sole basis for trading decisions.

MTF Sentiment [THRAXX]The Thraxx MTF Sentiment indicator is a powerful multi-timeframe analysis tool that helps traders gauge market sentiment across different timeframes simultaneously. This indicator provides a clear visual representation of bullish and bearish conditions by analyzing multiple technical factors including EMA, RSI, and price action.
Key Features:
- Multi-timeframe analysis covering 5m, 15m, 30m, 1H, 2H, 4H, and Daily timeframes
- LTF (Lower Timeframe) and HTF (Higher Timeframe) overall sentiment calculations
- Fully customizable visibility toggles for each timeframe
- Comprehensive color customization options for better visual clarity
- Clean table display with adjustable positioning
Technical Analysis Method:
The indicator evaluates three key factors for each timeframe:
1. Price position relative to 21 EMA
2. RSI (14) position relative to centerline
3. Higher highs and higher lows condition
Trading Signals:
- LTF Overall: Calculated using a 2-out-of-3 rule for shorter timeframes (5m, 15m, 30m)
- HTF Overall: Calculated using a 3-out-of-4 rule for longer timeframes (1H, 2H, 4H, Daily)
Customization Options:
- Table position (top/bottom, left/center/right)
- Individual timeframe visibility
- Color settings for all elements (headers, text, backgrounds, signals)
- Maintains accurate calculations even when timeframes are hidden
This indicator is perfect for traders who want to:
- Get a quick overview of market sentiment across multiple timeframes
- Identify potential trend alignments and divergences
- Make informed trading decisions based on multi-timeframe analysis
- Customize their analysis view to match their trading style
The clean, organized display makes it easy to spot sentiment shifts across different time horizons, helping traders make more informed decisions about market direction and potential trading opportunities.
