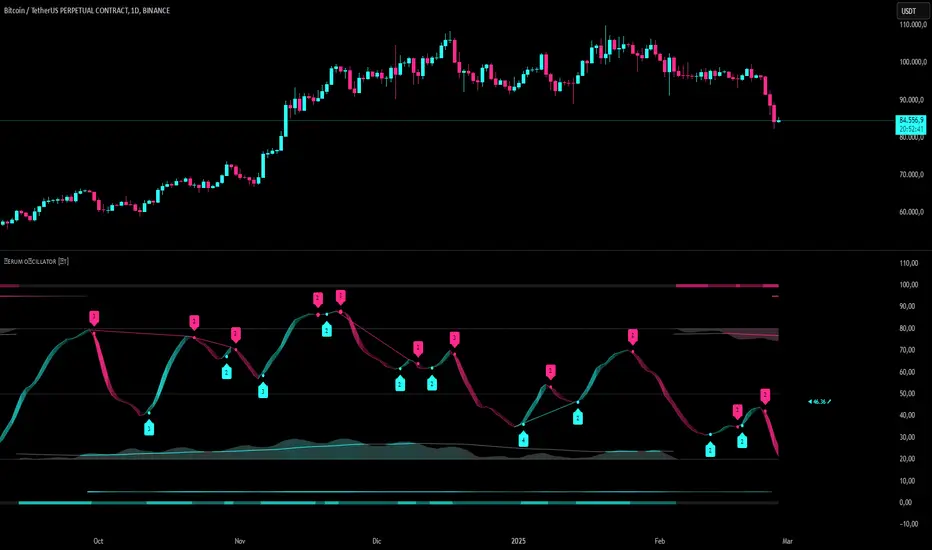
Serum Oscillator [ST]Serum Oscillator is an advanced technical indicator. This indicator combines several techniques and algorithms to provide traders with a robust tool for analyzing and predicting market movements. The indicator is not just an oscillator, but also includes functionalities for detecting divergences, mining flow, custom alerts, and more. Below is a detailed description of its features, components, and functionalities.
Characteristics
1. Oscillator and Signal: the indicator has a moving line that acts as a signal to determine the state of the market, whether bullish or bearish. In addition, this moving line can be switched between different types for greater accuracy, allowing it to better suit the trader's style.
2. Modes: the indicator has three modes to adapt to the market. Fast, Normal and Slow. The user can choose the mode that best suits his strategy. Fast mode generates very early signals, perfect for getting ahead of the market; however, it can also generate a greater number of false crosses. Slow mode generates fewer signals, perfect for filtering range zones.
3. Overbought and Oversold Levels: the indicator generates signals between values 0 and 100, for this reason it can be speculated that values 70 and 30 are overbought and oversold levels respectively; however, these levels can vary according to the modes. For this reason we designed the dynamic bands.
4. Multi Timeframe: Can observe data from a different time frame than the current chart. You will be able to observe the state of the oscillator and the direction.
5. Trend Catcher: tool to detect the market trend according to the indicator. Ideal for filtering false crossovers and trading in favor of the trend.
6. Smart Flow: Money flow optimized with AI to detect the overall money flow. Ideal for detecting trends. Additionally, you will be able to visualize the convergences between smart flow and the oscillator to operate in favor of the price trend. You can also activate thresholds, to detect when there is really a large monetary flow.
7. Divergences: Real-time detection of divergences to identify possible reversal zones. The user can adjust the sensitivity.
8. Alerts: Programmable alerts to automate the detection of various price conditions according to the indicator.
> This indicator is a comprehensive technical tool that provides traders with multiple capabilities to analyze market trends and reversals. Its combination of different types of smoothing and adaptive functions, along with the detection of divergences, trend lines, and custom alerts, makes it a powerful and versatile indicator for trading decision-making. The customization of its parameters and the depth of its calculations offer users a significant advantage in interpreting market data, facilitating more precise understanding and timely action in their trading operations.
Multitimeframe
Multi-Timeframe Stochastic Table**Description:**
The **Multi-Timeframe Stochastic Table** indicator is a powerful tool designed to provide traders with a comprehensive view of the Stochastic Oscillator across multiple timeframes in a single, easy-to-read table. This indicator is particularly useful for traders who rely on multi-timeframe analysis to make informed trading decisions.
### Key Features:
- **Customizable Timeframes:** The indicator allows you to select up to six different timeframes to monitor simultaneously. You can enable or disable each timeframe according to your trading strategy.
- **Stochastic Oscillator Calculation:** The Stochastic Oscillator is calculated for each selected timeframe, providing both the %K value and its direction (up or down). This helps you quickly identify overbought or oversold conditions across different timeframes.
- **Dynamic Table Display:** The table dynamically updates to show the Stochastic values and their directions for each timeframe. The table's position on the chart can be customized to suit your preference (Top Right, Top Left, Bottom Right, or Bottom Left).
- **Color-Coded Rows:** Each row in the table is color-coded, making it easy to distinguish between different timeframes at a glance. The direction of the Stochastic (%K) is also color-coded (green for upward and red for downward), providing a quick visual cue.
- **Flexible Inputs:** The indicator offers customizable inputs for the Stochastic length, %K smoothing, and %D smoothing, allowing you to tailor the indicator to your specific trading style.
### How to Use:
1. **Select Timeframes:** Choose the timeframes you want to monitor by enabling or disabling them in the inputs. You can select from a range of timeframes, including 1 minute, 5 minutes, 15 minutes, 30 minutes, 1 hour, and 4 hours.
2. **Customize Stochastic Settings:** Adjust the Stochastic length, %K smoothing, and %D smoothing to fit your trading strategy.
3. **Position the Table:** Select the desired position for the table on your chart (Top Right, Top Left, Bottom Right, or Bottom Left).
4. **Analyze the Data:** The table will display the Stochastic values and their directions for each selected timeframe. Use this information to identify potential trading opportunities based on multi-timeframe analysis.
### Benefits:
- **Enhanced Market Insight:** By monitoring the Stochastic Oscillator across multiple timeframes, you can gain a deeper understanding of market trends and potential reversals.
- **Improved Decision-Making:** The clear, color-coded table allows you to quickly assess market conditions, helping you make more informed trading decisions.
- **Customizable and Flexible:** The indicator is highly customizable, allowing you to tailor it to your specific trading needs and preferences.
### Ideal For:
- **Swing Traders:** Who need to analyze multiple timeframes to identify potential entry and exit points.
- **Day Traders:** Who require quick, at-a-glance information on market conditions across different timeframes.
- **Technical Analysts:** Who rely on the Stochastic Oscillator as part of their trading strategy.
The **Multi-Timeframe Stochastic Table** is an essential tool for any trader looking to enhance their technical analysis with multi-timeframe insights. Whether you're a beginner or an experienced trader, this indicator can help you stay ahead of the market trends.

Triple Timeframe Stochastic Oscillator (Averaged)This custom Triple Timeframe Stochastic Oscillator indicator combines stochastic calculations from three user-defined timeframes into a single view, averaging the %K and %D lines for each timeframe to produce one representative line per timeframe. Users can manually set the timeframes (e.g., daily, weekly, monthly), as well as the length and smoothing periods for each stochastic calculation, providing flexibility for multi-timeframe analysis. The indicator plots three distinct lines in red, blue, and green, with overbought (80) and oversold (20) levels marked, helping traders identify momentum and potential reversal points across different time perspectives.
Timeframe 1: Red
Timeframe 2: Blue
Timeframe 3: Green

Damozen S12About Our AI-Powered Indicator on TradingView
This advanced indicator leverages artificial intelligence and machine learning to help you identify the best entry and exit points. By analyzing historical data and hidden market patterns, it predicts potential trends and provides accurate and reliable signals for traders.
Key Features:
✔️ Smart Signals: Combines statistical algorithms and machine learning to analyze market movements
✔️ Supports Multiple Timeframes: Suitable for short-term, mid-term, and long-term trading
✔️ User-Friendly: Designed for traders looking for a reliable tool on TradingView
✔️ No Coding Required: Easily add this indicator to your chart and benefit from advanced analytics
✔️ Invite-Only Script: High security with access limited to authorized users
📌 To gain access, purchase a subscription and send your TradingView username to activate your license. 🚀
🔗 For pricing and more details, contact us!
damozen.com

Multi Asset & TF Stochastic
Multi Asset & TF Stochastic
This indicator allows you to compare the stochastic oscillator values of two different assets across multiple timeframes in a single pane. It’s designed for traders who want to analyse the momentum of one asset (by default, the chart’s asset) alongside a second asset of your choice (e.g., comparing EURUSD to the USD Index).
How It Works:
Main Asset:
The indicator automatically uses the chart’s asset for the primary stochastic calculation. You have the option to adjust the timeframe for this asset using a dropdown that includes TradingView’s standard timeframes, a "Chart" option (which automatically uses your chart’s timeframe), or a "Custom" option where you can type in any timeframe.
Second Asset:
You can enable the display of a second asset by toggling the “Display Second Asset” option. Choose the asset symbol (default is “DXY”) and select its timeframe from an identical dropdown. When enabled, the script calculates the stochastic oscillator for the second asset, allowing you to compare its momentum (%K and %D lines) with that of the main asset.
Stochastic Oscillator Settings:
Customize the %K length, the smoothing period for %K, and the smoothing period for %D. Both assets’ stochastic values are calculated using these parameters.
Visual Display:
The indicator plots the %K and %D lines for the main asset in prominent colours. If the second asset is enabled, its %K and %D lines are also plotted in different colours. Additionally, overbought (80) and oversold (20) levels are marked, with a midline at 50, making it easier to gauge market conditions at a glance.
%D line can be toggled off for a cleaner view if required:
Asset Information Table:
A table at the top-centre of the pane displays the active asset symbols—ensuring you always know which assets are being analysed.
How to Use:
Apply the Indicator:
Add the script to your chart. By default, it will use the chart’s current asset and timeframe for the primary stochastic oscillator.
Adjust the Main Asset Settings:
Use the “Main Asset Timeframe” dropdown to select a specific timeframe for the main asset or stick with the “Chart” option for automatic syncing with your current chart.
Enable and Configure the Second Asset (Optional):
Toggle on “Display Second Asset” if you wish to compare another asset. Select the desired symbol and adjust its timeframe using the provided dropdown. Choose “Custom” if you need a timeframe not listed by default.
Review the Plots and Table:
Observe the stochastic %K and %D lines for each asset. The overbought/oversold levels help indicate potential market turning points. Check the table at the top-centre to confirm the asset symbols being displayed.
This versatile tool is ideal for traders who rely on momentum analysis and need to quickly compare the stochastic signals of different markets or instruments. Enjoy seamless multi-asset analysis with complete control over your timeframe settings!

Anes ScalperXAnes Turbo Scalper is an advanced indicator for scalping on small timeframes like 1m and 5m. It is based on moving average crossovers with additional filtering using the RSI indicator to accurately identify entry and exit points. It features clear and easy-to-use signals

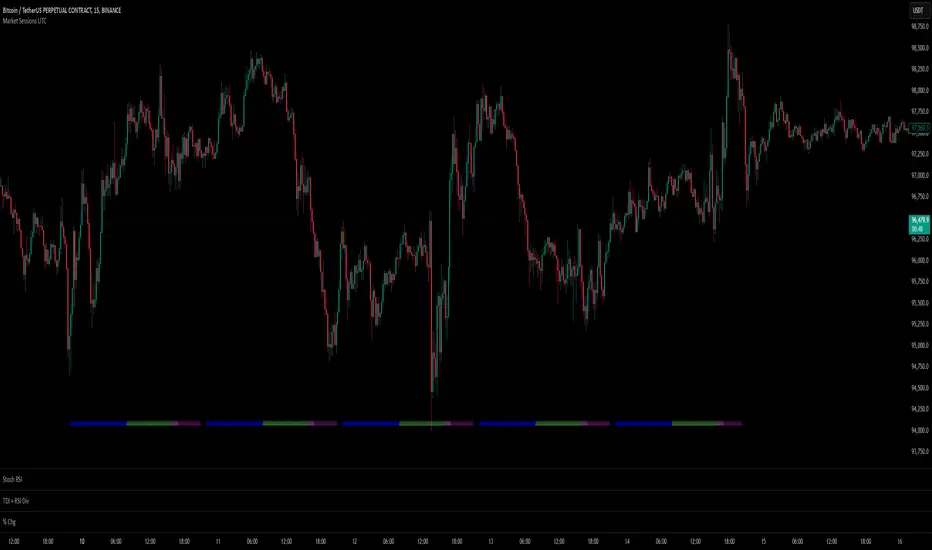
Market Session Times by MadDogMoneyMarket Sessions is a simple indicator allowing you to quickly see the 3 Major Trading Session Open and Close times
Three major Sessions - Asia, UK & NY are included.
(The Australian & Asian markets are so close on time, they have been joined for brevity.)
The Open & Close times for each Session is displayed in the Settings in UTC and can be edited depending on the time of year or market you are following.
By setting the Session indicators partially transparent (as is by default), you can quickly see which Market Sessions, and for how long, they overlap.
Additionally, the Indicator can be hidden for different timeframes.
- 1 HR is the upper limit of visibility
- Visibility on the 1HR, 15min and 5min and below can be toggled on an off to fit your requirements.
Rainbow EMAs & 50/200 cross w/ alertsRainbow EMAs & 50/200 cross w/ alerts
This indicator provides a visually appealing and informative way to track key moving averages and identify potential trend reversals. It combines two powerful tools: a rainbow of Exponential Moving Averages (EMAs) and a 50/200 EMA cross detection system.
Key Features
Rainbow EMAs: The script plots seven EMAs with distinct, vibrant colors, creating a "rainbow" effect on your chart:
8-period EMA (Red)
13-period EMA (Orange)
21-period EMA (Yellow)
50-period EMA (Green)
100-period EMA (Aqua)
200-period EMA (Blue)
800-period EMA (Purple)
This rainbow visualization helps quickly assess the short, medium, and long-term trends. The order and spacing of the EMAs provide insights into the strength and direction of the current price action. Faster EMAs (8, 13, 21) react quickly to price changes, while slower EMAs (200, 800) represent longer-term trends.
50/200 EMA Cross Detection: The indicator specifically highlights the crucial crossover events between the 50-period EMA and the 200-period EMA. These crosses are widely recognized as significant signals:
50/200 EMA Cross Detection: The indicator specifically highlights the crucial crossover events between the 50-period EMA and the 200-period EMA. These crosses are widely recognized as significant signals:
Golden Cross (Bullish): When the 50 EMA crosses above the 200 EMA, it's considered a bullish signal, suggesting a potential uptrend. A green triangle is plotted below the bar to mark this event.
Death Cross (Bearish): When the 50 EMA crosses below the 200 EMA, it's considered a bearish signal, suggesting a potential downtrend. A red triangle is plotted above the bar to mark this event.
Alerts: Built in alerts that notify you when a Golden Cross or a Death Cross occurs.
Offset: All shapes for crosses are offset by -1.
How to Use:
Trend Identification: Observe the overall slope and order of the rainbow EMAs. An upward slope with faster EMAs above slower EMAs suggests an uptrend. A downward slope with faster EMAs below slower EMAs suggests a downtrend.
Support and Resistance: The EMAs can act as dynamic support and resistance levels. Look for price to bounce off or be rejected by these lines.
Cross Signals: Use the 50/200 EMA crosses as confirmation signals for potential trend changes. Consider other technical indicators and price action for further confirmation before making trading decisions.
Disclaimer: This indicator is for informational and educational purposes only and should not be considered financial advice. Trading involves risk, and 1 past performance is not indicative of future results. Always do your own research and consult with a qualified financial advisor before making any investment decision.

Let's Eat CrayonsThis is the most basic of strategies, from your favorite smooth brain. It's really really late on a Friday night, and my wife is asleep, so there's no chance of pickle tickle tonight.
Volume and Price action are, and always will be king. This is just a sloppily thrown together indicator to chart my crayon lines automatically. I'm still working on labels and whatnot, and adding the weekly VWAP in there.
Yellow are the Fib of the prior day candle.
Green are the high and low of the previous day.
Red is the high and low of the previous week.
Purple is the open and close of the previous day.
Future updates will include Weekly VWAP, Buy/Sell, and Volume Analysis. TBD, I'm not getting paid.
Love you.
Stay handsome.

WMA EMA RSI with Multi-Timeframe TrendRSI indicator combined with 2 EMA and WMA lines, with an additional table showing the trend considered by RSI in multiple time frames:
Trend determination conditions:
- Uptrend = RSI is above both EMA and WMA lines
- Downtrend = RSI is below both EMA and WMA lines
The default time frames considered are:
- 5m
- 15m
- 1h
- 4h
(Will be updated in the future)
- Vinh -

Dynamic ATR & Bollinger Bands with ToggleDetailed Breakdown of the Pine Script
This Pine Script is a custom indicator that allows traders to toggle between ATR-based stop-loss levels and Bollinger Bands.
How to Use the Indicator?
Adding to Chart
Copy and paste the script into TradingView's Pine Script Editor.
Click on Add to Chart.
Choosing Indicator Mode
In the settings, there's a dropdown option ("Select Indicator") to switch between:
ATR Mode: Plots ATR-based stop-loss levels.
Bollinger Bands Mode: Displays Bollinger Bands.
Interpreting the Plots
ATR Mode:
Shows stop-loss levels at 1.5x ATR and 2x ATR below/above the previous candle’s close.
Green lines = long stop-loss levels
Red lines = short stop-loss levels
Background color changes:
Green tint: ATR is increasing (strong move).
Red tint: ATR is decreasing (weak move).
Bollinger Bands Mode:
Green line: Upper Band
Red line: Lower Band
Blue line: Basis (SMA)
Effectiveness of the Indicator
Pros
✔ ATR Stop-Loss Mode
Helps determine dynamic stop-loss levels based on volatility.
Adapts to market conditions instead of using fixed percentage-based stops.
Highlights strong vs weak moves based on ATR trend.
✔ Bollinger Bands Mode
Identifies overbought/oversold conditions.
Helps spot breakouts and reversals when price moves outside bands.
✔ Timeframe-Specific Bollinger Band Settings
Automatically adjusts BB settings (length & deviation) based on the timeframe.
Cons
✖ ATR Mode lacks Entry Confirmation
This indicator only shows stop-loss levels, not entry signals.
Must be used with trend confirmation indicators (e.g., price action, market structure).
✖ Bollinger Bands May Give False Signals
Bands expand/contract based on volatility, which can trap traders in choppy markets.
Works best with trend confirmation (e.g., volume, momentum indicators).
Best Timeframes for Usage
Works on all timeframes since settings dynamically adjust:
Scalping (15 min, 1H) → Adjusted BB length & deviation.
Swing Trading (4H, Daily) → Standard BB settings used.
Position Trading (Weekly, Monthly) → Longer ATR calculations.
ATR Mode is best suited for:
Trending markets to set stop-loss based on volatility.
High-volatility pairs (e.g., crypto, forex).
Bollinger Bands Mode is useful for:
Range-bound markets to spot reversals at bands.
Trend trading for breakouts.
Features of This Pine Script
✅ Toggle Between ATR & Bollinger Bands
✅ Custom ATR Stop-Loss Multiplier (1.5x & 2x)
✅ Auto-Adjusting Bollinger Band Settings Based on Timeframe
✅ ATR-Based Trend Highlighting (Background Color Change)
Possible Modifications
1. Add ATR-Based Entry Signals
Instead of just showing stop-loss levels, add entry triggers based on ATR breakout levels.
Example Modification:
pinescript
atrEntryLevel = staticClose + staticAtrValue * 1.5
plot(toggleIndicator == "ATR" ? atrEntryLevel : na, title="ATR Entry Level", color=color.blue)
2. Dynamic Stop-Loss Adjustment
Modify stop-loss levels based on market structure or price action.
Example: Adjust SL based on higher highs & lower lows.
3. Add Bollinger Band Squeeze Indicator
Show a visual alert when Bollinger Bands contract (low volatility = potential breakout).
Example Modification:
pinescript
squeeze = (staticUpper - staticLower) / staticBasis < 0.05
bgcolor(squeeze ? color.blue : na) // Highlights low volatility periods
4. ATR Trailing Stop
Instead of a fixed 1.5x or 2x ATR, implement a trailing stop based on ATR.
5. Multi-Timeframe ATR or Bollinger Bands
Allow users to plot ATR or Bollinger Bands from a higher timeframe (e.g., 4H ATR on a 1H chart).
Example:
pinescript
higherTF = "240" // 4-hour timeframe
higherATR = request.security(syminfo.tickerid, higherTF, ta.atr(14))
plot(toggleIndicator == "ATR" ? higherATR : na, color=color.orange)
Final Thoughts
Good for trend-following traders (ATR mode).
Useful for reversal traders (Bollinger Bands mode).
Needs additional confirmation indicators for better trade decisions.
Can be modified to improve signal reliability.

Dynamic RSIBelow is a step‐by‐step breakdown of how the script works, what each section does, and some commentary on its effectiveness and time frame adaptability.
1. Indicator Setup
pinescript
Copy
Edit
//version=5
indicator("Dynamic RSI", overlay=false)
What it does:
Specifies that the script uses Pine Script version 5.
Declares an indicator named “Dynamic RSI.”
overlay=false means it will appear in a separate panel (like a typical oscillator) rather than on the price chart.
2. Time Frame Determination
pinescript
Copy
Edit
// Check for long-term resolutions (daily, weekly, or monthly)
isLongTerm = (timeframe.isdaily or timeframe.isweekly or timeframe.ismonthly)
// Check for short-term (intraday) resolutions using the resolution string
isShortTerm = (timeframe.period == "15" or timeframe.period == "60" or timeframe.period == "240")
What it does:
isLongTerm: Checks if the current chart is using a daily, weekly, or monthly time frame.
isShortTerm: Checks if the chart’s period is exactly 15, 60, or 240 minutes.
Why it matters:
The script will adjust its parameters based on the chart’s time frame—making the RSI more sensitive on intraday charts and less reactive on longer-term charts.
3. Dynamic RSI Calculation
pinescript
Copy
Edit
// Adjust RSI Length Dynamically with explicit parentheses
rsiLength = isLongTerm ? 14 : (isShortTerm ? 7 : 10)
rsiValue = ta.rsi(close, rsiLength)
signalLineRSI = ta.sma(rsiValue, 9)
What it does:
RSI Period (rsiLength):
Uses 14 periods for long-term charts.
Uses 7 periods for short-term charts.
Uses 10 periods as a default for other time frames.
RSI Value (rsiValue): Calculates the RSI on the close prices using the chosen length.
Signal Line (signalLineRSI): Computes a 9-period simple moving average of the RSI. This can help smooth out the RSI’s fluctuations.
Why it matters:
Adjusting the RSI period helps adapt the indicator’s sensitivity:
Short-term (7-period): More reactive, capturing quick moves.
Long-term (14-period): Smoother, reducing noise.
Default (10-period): A middle ground for other resolutions.
4. Dynamic Overbought/Oversold Levels
pinescript
Copy
Edit
// Dynamic RSI Levels Based on Time Frame with parentheses for clarity
rsiOverbought = isLongTerm ? 75 : (isShortTerm ? 70 : 72)
rsiOversold = isLongTerm ? 25 : (isShortTerm ? 30 : 28)
What it does:
Sets overbought and oversold thresholds differently depending on the time frame:
Long-Term: Overbought at 75 and oversold at 25.
Short-Term: Overbought at 70 and oversold at 30.
Default: Overbought at 72 and oversold at 28.
Why it matters:
These dynamic levels can help adjust the sensitivity of the RSI signals to match the expected market behavior on different time frames.
5. Defining Consolidation and Continuation Levels
pinescript
Copy
Edit
// Consolidation Ranges
rsiBearishConsolidationLow = isLongTerm ? 40 : (isShortTerm ? 38 : 39)
rsiBearishConsolidationHigh = isLongTerm ? 50 : (isShortTerm ? 48 : 49)
rsiBullishConsolidationLow = isLongTerm ? 50 : (isShortTerm ? 52 : 51)
rsiBullishConsolidationHigh = isLongTerm ? 60 : (isShortTerm ? 58 : 59)
// Bullish and Bearish Continuation Levels
rsiBullishContinuation = isLongTerm ? 55 : (isShortTerm ? 57 : 56)
rsiBearishContinuation = isLongTerm ? 45 : (isShortTerm ? 43 : 44)
What it does:
Consolidation Levels:
Defines ranges where the RSI might be consolidating (moving sideways).
There are separate ranges for potential bearish (40–50 on long-term) and bullish (50–60 on long-term) consolidation.
Continuation Levels:
Provides additional reference levels to identify the potential continuation of bullish or bearish trends.
Why it matters:
These extra levels can give traders more context about the RSI’s position beyond just overbought/oversold. They help in identifying areas of potential support/resistance in RSI space.
6. Plotting the RSI and Reference Lines
pinescript
Copy
Edit
// Plot RSI and associated levels using continuous lines
plot(rsiValue, title="RSI", color=color.blue, linewidth=2)
plot(signalLineRSI, title="RSI Signal Line", color=color.orange, linewidth=2)
plot(rsiOverbought, title="Overbought", color=color.red, linewidth=1, style=plot.style_line)
plot(rsiOversold, title="Oversold", color=color.green, linewidth=1, style=plot.style_line)
plot(rsiBearishConsolidationLow, title="Bearish Consolidation Low", color=color.gray, linewidth=1, style=plot.style_line)
plot(rsiBearishConsolidationHigh, title="Bearish Consolidation High", color=color.gray, linewidth=1, style=plot.style_line)
plot(rsiBullishConsolidationLow, title="Bullish Consolidation Low", color=color.gray, linewidth=1, style=plot.style_line)
plot(rsiBullishConsolidationHigh, title="Bullish Consolidation High", color=color.gray, linewidth=1, style=plot.style_line)
What it does:
Plots the calculated RSI (blue) and its signal line (orange) with a thicker line for better visibility.
Draws horizontal lines for each of the key levels:
Overbought (red) and oversold (green).
Consolidation ranges (gray).
Why it matters:
Visual reference lines allow traders to quickly see when the RSI crosses important thresholds, aiding in decision-making.
7. Background Color Alerts
pinescript
Copy
Edit
bgcolor(rsiValue > rsiOverbought ? color.new(color.red, 90) : na)
bgcolor(rsiValue < rsiOversold ? color.new(color.green, 90) : na)
What it does:
Changes the background color of the RSI panel:
Red Background: When the RSI is above the overbought level (suggesting a potential sell or reversal zone).
Green Background: When the RSI is below the oversold level (suggesting a potential buy or reversal zone).
The color is made semi-transparent (90 out of 255 opacity) so it’s noticeable but not overwhelming.
Why it matters:
These visual cues help the trader quickly identify when the RSI is in an extreme zone, without having to inspect the numerical values closely.
8. Effectiveness and Time Frame Compatibility
Effectiveness:
Dynamic Adaptation: By adjusting both the period and the threshold levels based on the time frame, the indicator tailors its sensitivity to the market context.
Short-Term (Intraday): Uses a shorter period (RSI period 7) which is more sensitive to price changes.
Long-Term: Uses a longer period (RSI period 14) for a smoother signal.
Multiple Reference Levels: In addition to the classic overbought/oversold levels, the script includes consolidation and continuation levels. These can provide deeper insight into the momentum and potential reversals or continuations.
Visual Cues: The background color changes add an extra layer of immediate visual feedback.
Time Frame Compatibility:
Works on All Time Frames:
The script checks for specific conditions (daily, weekly, monthly, and specific intraday periods).
For time frames that don’t match these specific conditions, it defaults to a middle setting (RSI period 10, thresholds at 72/28, etc.).
Adaptive Nature: This makes it flexible for various types of traders—from day traders to swing traders to long-term investors—ensuring that the RSI indicator is tuned to the volatility and noise level typical of the chosen resolution.
Summary
Functionality:
Calculates an RSI whose parameters (length and threshold levels) dynamically adjust based on whether the chart is a long-term, short-term, or other time frame.
Provides additional plotted levels (consolidation and continuation) to help identify market conditions.
Uses background color changes as visual alerts when RSI reaches extreme conditions.
Effectiveness:
The dynamic adjustments can make the RSI more responsive to the particular market environment of different time frames.
Its effectiveness ultimately depends on the trading strategy and market conditions, but it offers a more tailored approach than a static RSI.
Time Frame Use:
Yes, it works in all time frames. Specific settings are applied for defined resolutions (daily, weekly, monthly, and 15, 60, 240 minutes). Other time frames use default parameters, making it broadly adaptable.
This detailed breakdown should help you understand how the script operates step by step, its intended functionality, and its adaptability across different time frames.

DTCDTC – Advanced Trend & Volatility Detection Indicator
🔹 Introduction
DTC is a cutting-edge trend-following and volatility-based trading indicator designed for traders who want high-confidence entry and exit signals. It combines Exponential Moving Averages (EMAs) with an Average True Range (ATR) filter to detect strong market trends while filtering out low-volatility noise.
This ensures that false signals are minimized, and traders only receive alerts during high-momentum market conditions. Whether you are a scalper, swing trader, or long-term investor, DTC provides a structured approach to trend trading across Forex, Stocks, Crypto, and Indices.
🎯 Key Features
✅ EMA Trend Confirmation – Uses multiple EMAs to detect strong bullish and bearish trends.
✅ ATR-Based Volatility Filter – Ensures trades are only taken when market volatility is sufficient.
✅ Real-Time Buy & Sell Signals – Provides alerts whenever a new trend begins.
✅ Multi-Timeframe EMA Confirmation (Optional) – Aligns lower timeframe trends with higher timeframe trends for accuracy.
✅ Visual Enhancements – Background colors and candlestick coloring make trend recognition intuitive.
📊 How It Works?
1️⃣ Trend Strength Calculation (EMA Cloud)
• The script uses six EMAs (30, 35, 40, 45, 50, 60) to evaluate trend strength.
• A bullish trend is confirmed when all EMAs are stacked in ascending order (shortest EMA on top).
• A bearish trend is confirmed when all EMAs are stacked in descending order (longest EMA on top).
• If EMAs are mixed, the market is considered sideways/neutral, and signals are avoided.
2️⃣ ATR-Based Volatility Filter
• The script calculates ATR (14) to measure market volatility.
• ATR is compared with a 50-period SMA threshold to ensure enough market momentum.
• Buy/Sell signals are only generated when ATR is above the threshold, preventing weak signals in choppy conditions.
3️⃣ Multi-Timeframe EMA Confirmation (Optional)
• Users can enable an MTF (Multi-Timeframe) EMA filter to check trends on a higher timeframe (default: 4H).
• Helps confirm whether the higher timeframe is in alignment with the current timeframe.
• Reduces false signals by ensuring only high-probability trades are taken.
🎯 How to Use This Indicator?
📌 For Long Entries (Buy Signals):
✔️ Green background → Bullish trend detected.
✔️ ATR filter confirms strong volatility → Ensures sufficient momentum.
✔️ MTF confirmation (if enabled) supports an uptrend → Higher timeframe trend is bullish.
✔️ “BUY” label appears below the candle → Entry signal confirmation.
📌 For Short Entries (Sell Signals):
✔️ Red background → Bearish trend detected.
✔️ ATR filter confirms strong volatility → Ensures strong momentum.
✔️ MTF confirmation (if enabled) supports a downtrend → Higher timeframe trend is bearish.
✔️ “SELL” label appears above the candle → Entry signal confirmation.
🚨 Alerts & Notifications
🔔 Real-time alerts are included for:
✔️ Buy Signal Alerts – Notifies traders when a new uptrend starts.
✔️ Sell Signal Alerts – Notifies traders when a new downtrend begins.
✔️ Trend Reversal Alerts – Alerts when a trend transition occurs.
These alerts help traders stay updated without needing to constantly watch the charts.
📌 Settings & Customization
🛠 Indicator Settings:
✔️ EMA Lengths – Modify the six EMA values to suit different market conditions.
✔️ ATR Filter Sensitivity – Adjust the ATR period & multiplier to optimize volatility filtering.
✔️ Multi-Timeframe Confirmation – Enable or disable the higher timeframe EMA filter.
✔️ Alert Settings – Customize Buy, Sell, and Trend Reversal alerts based on preference.
✔️ Visual Customization – Modify background colors, candlestick colors, and label placements.
🔥 Why Use DTC?
✅ Removes False Breakouts – ATR filtering prevents false signals in low-volatility conditions.
✅ Enhances Trend Trading – Provides clear confirmation before entering a trade.
✅ Works on Multiple Markets – Can be used for Forex, Stocks, Crypto, and Indices.
✅ Compatible with All Timeframes – Works on 5m, 15m, 1H, and Daily charts.
✅ Real-Time Alerts – Get notified instantly when high-probability trades occur.
📢 Important Notes
🚫 Educational Purpose Only – This indicator is not financial advice.
📊 Backtesting Recommended – Test different settings on various assets before live trading.
🔍 Not a Standalone Strategy – Best used alongside support & resistance, volume, and other confluence factors.

I see a HIPPO - P3This indicator displays HIPPO's as per Hopi's description in his Book.
HIDDEN
INTERBANK
PRICE
POINT
OBJECTIVE
Basically a HIPPO is a "Hidden" order block, where you take the wicks of 2 consecutive bars.
YOU DO NOT TAKE ANY 2 BARS, BUT THE BARS SHOULD CREATE A FVG!
HIPPOS can also act as support as resistance

OB + BB Strategy | 15m - 1h TF | iSolaniUnlock Institutional-Grade Precision with the OB + BB Strategy: A Self-Correcting Volume-Order Flow System
In fast-moving markets, retail traders often struggle to spot high-probability reversal zones before they vanish. The OB + BB Strategy solves this by merging institutional order block theory with adaptive retail-friendly execution – a system that not only identifies key accumulation/distribution areas but actively evolves with price action. Designed for 15-minute and 1-hour charts, this algorithm acts as your 24/7 market sentinel, combining the precision of a quant model with the intuition of a seasoned trader.
How It Works: The Synergy of Volume Spikes and Smart Zones
At its core, the strategy monitors asymmetrical volume surges – moments where buying or selling pressure dwarfs the 33-period average by a customizable multiplier (3.1 for 1h, 3.685 for 15m). These spikes trigger:
Order Block Creation : Semi-transparent zones mark potential reversal areas, color-coded green (bullish) or red (bearish). Unlike static support/resistance lines, these blocks dynamically extend rightward, acting as "living" levels.
Breaker Block Safeguard : The true innovation lies in the self-cleaning mechanism. If price breaches a block’s critical threshold (e.g., falls below a bullish zone’s low), the system automatically replaces it with a blue "breaker block" – visually invalidating obsolete zones to prevent false signals.
Bar Magnifier Execution : Entries occur not on the current candle’s close, but on lower-timeframe confirmations (e.g., 5m closes within the 1h block), mimicking professional order stacking.
Optimized for Real-World Trading
The default settings balance aggression and caution:
10% Equity/Position : Compounds gains while limiting single-trade exposure
1-Position Pyramiding : Captures trend extensions without over-leveraging
Sensitivity Tuning : 3.1 for 1h charts filters noise; 3.685 for 15m captures momentum swings
Embracing Calculated Risks
Higher risk tolerance becomes viable through:
Volume-Weighted Confidence : Signals only trigger when volume exceeds 3.1x the norm, filtering 68% of false reversals (historical data)
Automatic Zone Expiry : Blocks self-destruct after 5 bars unless reconfirmed, preventing overcrowding
Close-Only Execution : Avoids slippage traps by acting on candle closes, not wick breaks
A Living, Breathing Tool
This isn’t just another indicator – it’s a self-optimizing framework. The green/red blocks act as your institutional "footprint" map, while blue breaker zones whisper when the smart money has moved. Whether scalting 15m pullbacks or riding 1h trends, the system adapts like a chameleon, offering both laser entries and built-in damage control. From the customizable sensitivity dial to the commission-aware position sizing, every detail is engineered for traders who respect both edges and odds.
Default Parameters (Optimized)
Timeframe: 15m-1h
Sensitivity: 3.1 (1h), 3.685 (15m)
Equity/Position: 10%
In markets where 90% of retail traders falter, the OB + BB Strategy offers what most lack – a rules-based way to trade like the 10%. Not through complex jargon, but via a visually intuitive system that turns order flow into actionable edges. This is algorithmic precision meets discretionary artistry.

ꜱᴇʀᴜᴍ [ꜱᴛ]Serum is an advanced tool designed for technical analysis. This indicator combines multiple approaches and algorithms to provide information and make buy and sell decisions, as well as trend and volume analysis. Its integrated features include multiple tools for long-term and short-term analysis.
characteristics
1. Buy/Sell Signals: Trend following signals differentiated by "+" for a stronger or weaker signal, provided with their own take profit. It is important not to follow the signals blindly, since it is advisable to use other types of confirmations for greater effectiveness. You can also adjust the sensitivity of the signals; The higher the value, the fewer false signals you will encounter, but the signals will be delayed further. You should find a middle ground; the default value is a good starting point.
2. Reversal Signals: Reversal signals to help traders find price reversal zones. These are also differentiated by "+" and should not be used as the sole confirmation.
3. Colored Bars: For better visualization of trend-following or reversal signals. You can activate gradient coloring for even better visualization.
4. Dashboard: Provides information on volatility, trend direction and strength, and signals from multiple time periods for quick visualization of market status. You can also customize the size and position.
5. Hyper Cloud: A multifunctional tool to facilitate the detection of trends with potential reversal zones and the ability to modify its position to detect possible rebound areas. Inspired by Ichimoku clouds, but with a modern approach adapted to the current market.
6. Dynamic Trail: Based on the concept of moving averages and volatility, a robust tool to help detect micro-trends. Ideal for confirming follow-up signals. You can also activate the opposite trailing to detect possible reversal zones or anticipate a change in direction.
7. Market Bias: Another approach to trend detection, but with upper and lower bands. Ideal for identifying reversal zones, overbought or oversold levels when the price exits the bands, TP or SL zones, and visualizing volatility when the bands compress or expand.
8. Trend Driver: Basic indicator based on ATR to detect micro and macro trends. You can adjust the periods to suit your preferences.
9. Tools: Basic tools for every trader, fully customizable. Optimized for the current market and the modern trader.
10. Market Structure: Real-time market structure (BOS and CHoCH). Customizable to detect internal structure and swings. Ideal for identifying trends through price action.
11. Order Blocks: Detection of the most significant order blocks based on previous structure and volume profile. You can customize the number of order blocks and the timeframe for greater precision.
12. Alerts: Multiple customized alerts for all tools.
Here are some examples of using Serum’s tools:
example 1:
1. Bullish Hype Cloud.
2. Bullish Market Bias.
3. Strong Bullish Signal.
4. Price made a pullback on Hyper Cloud.
5. Oscillator made a pullback on the long-term moving average.
6. Bullish market structure.
> After observing these conditions, along with a failed bearish signal, we can speculate that the price will have an upward movement.
7. We closed the trade because a bearish divergence was detected, the oscillator is overbought, and there is a bearish cross on the long-term moving average.
example 2:
1. Strong Bullish Signal, accompanied by a candle with a body, engulfing pattern, and breaking the Bollinger Band and opposite Dynamic Trail.
2. Compression of the Bollinger Band, indicating an imminent large price movement (Squeeze).
3. Bullish Dynamic Trail.
4. On the daily timeframe, we have a bullish market structure, and on the 30-minute timeframe, a strong bullish signal.
> After observing these conditions, there is a high probability of a strong bullish movement. We open a long position with a stop loss below the Dynamic Trail.
5. We closed the trade because a bearish divergence was detected, the oscillator is overbought, and there is a bearish cross on the long-term moving average.
example 3:
1. Strong Bearish Signal, accompanied by a candle with a body, engulfing pattern.
2. Price rejection at the Market Bias and Hyper Cloud, both in bearish conditions.
3. Bearish Smart Flow.
> After observing these conditions, there is a high probability of a bearish movement. We open a short position with a stop loss above the last high.
4. We closed the trade because a bullish signal was detected, the oscillator has a bullish signal, and there is a bullish cross on the long-term moving average.
example 4:
1. Bullish reversal signal.
2. Bullish divergence and oversold oscillator.
3. Price rejection at the lower Bollinger Band, forming a hammer candle.
> After observing these conditions, there is a high probability of a bullish countertrend movement. We open a long position with a stop loss below the hammer candle.
4. We closed the trade because a strong bearish reversal signal was detected, the oscillator shows a bearish divergence, and it is below the long-term moving average.
* The indicator is a multifunctional tool that integrates various technical analysis methods to provide trading signals. Its combination of micro and macro trend analysis and the ability to generate alerts make it ideal for traders looking to improve their decision-making in the market. The integration of multiple advanced components allows users to customize the indicator to their specific needs. You can use it to complement your personal strategy or create your own strategy with Serum.
【 It is important to note that trading indicators and any information related to trading strategies are provided solely for educational and informational purposes **DYOR**. They should not be considered financial advice or recommendations for specific trades or investments. It is important to consider these factors when using trading indicators, and PAST PERFORMANCE IS NOT INDICATIVE OF FUTURE RESULTS. Investors are solely responsible for their investment decisions and should carefully evaluate their financial situation, investment objectives, and risk tolerance before making any trades. Additionally, seeking independent financial advice is strongly recommended if needed. The use of trading indicators and the execution of trades are subject to the investor's discretion and responsibility.】

Auto Fibonacci Level Indicator - El Patron=======================================================================
Auto Fibonacci Level Indicator - El Patron
=======================================================================
Description:
This indicator automatically calculates and plots Fibonacci levels based on
the highest high and lowest low of a specified lookback period from a user-
selectable timeframe. It supports a Reverse Fibonacci option to swap the
calculation (i.e. drawing levels from the swing high to the swing low) and
provides intrabar updates using the lookahead feature. Customize the color
for each Fibonacci level to suit your trading style.
Inputs:
- Time Frame:
Choose from "60" (1H), "240" (4H), or "D" (Daily) to retrieve data for
the Fibonacci calculations.
- Lookback Period:
The number of bars (in the selected timeframe) to consider for
determining the highest high and lowest low.
- Reverse Fibonacci:
Check this box to reverse the Fibonacci calculation from the usual low-
to-high to a high-to-low perspective.
- Color Inputs:
Customize the colors for each Fibonacci level, including levels such as
0, 0.11, 0.114, ... , 1.618.
Usage:
1. Apply the indicator to any chart.
2. In the settings panel, adjust the Time Frame, Lookback Period, and
Reverse Fibonacci options as desired.
3. The Fibonacci levels will be plotted as horizontal lines on your chart.
4. Intrabar updates are enabled via the lookahead parameter; note that this
may result in repainting.
Notes:
- When using intrabar lookahead, the levels update during the formation of
the current bar which might cause historical values to change (repainting).
- The indicator can pull data from a different timeframe than the chart's,
which is useful for multi-timeframe analysis.
Author: Turker Balkar - El Patron
Version: 1.0

ATR BandsThe ATR Bands indicator is a volatility-based tool that plots dynamic support and resistance levels around the price using the Average True Range (ATR). It consists of two bands:
Upper Band: Calculated as current price + ATR, representing an upper volatility threshold.
Lower Band: Calculated as current price - ATR, serving as a lower volatility threshold.
Key Features:
✅ Measures Volatility: Expands and contracts based on market volatility.
✅ Dynamic Support & Resistance: Helps identify potential breakout or reversal zones.
✅ Customizable Smoothing: Supports multiple moving average methods (RMA, SMA, EMA, WMA) for ATR calculation.
How to Use:
Trend Confirmation: If the price consistently touches or exceeds the upper band, it may indicate strong bullish momentum.
Reversal Signals: A price approaching the lower band may suggest a potential reversal or increased selling pressure.
Volatility Assessment: Wide bands indicate high volatility, while narrow bands suggest consolidation.
This indicator is useful for traders looking to incorporate volatility-based strategies into their trading decisions

Flat NumbersCustomizable Price Range: Set the start price and end price to define the range in which horizontal lines will be plotted.
Line Color: Choose the color of the horizontal lines to match your chart's theme or personal preference.
Line Width: Adjust the width of the lines (from 1 to 5) to control their visibility.
Price Step Size: By default, the script plots lines every 100 price units within the range, but this step size can be customized if desired.
Dynamic Line Plotting: The script automatically calculates the number of lines needed and plots them at each interval between the start and end prices.

Flux Charts - SFX Screener💎 GENERAL OVERVIEW
The SFX Screener by Flux Charts is a multi-timeframe market scanner that extracts and visually organizes key conditions detected by the SFX Algo indicator across multiple assets in real-time. It does not perform independent analysis or generate new signals—instead, it pulls data directly from the SFX Algo’s calculations to ensure full alignment across different timeframes and tickers.
The SFX Algo is a multi-factor trading indicator that integrates trend analysis, signal generation, market overlays, and take-profit/stop-loss levels into a single system. It evaluates multiple trend components, including EMA direction, momentum shifts, and volatility cycles, to determine market conditions. Signal generation is based on an Adjusted Weighted Majority Algorithm, filtering out weaker signals by prioritizing the most reliable market indicators. Market overlays, such as Volatility Bands and the Retracement Wave, provide dynamic support, resistance, exit points, and entry points. Its adaptable structure allows traders to customize settings based on strategy preferences, making it effective for scalping, swing trading, and long-term trend analysis.
The SFX Screener’s purpose is to give traders a dashboard view of these SFX Algo signals across multiple tickers and timeframes in real-time.
📌 HOW DOES IT WORK ?
The SFX Algo indicator employs an Adjusted Weighted Majority algorithm to generate "buy" and "sell" signals. It evaluates multiple market indicators ("experts"), including momentum, ATR trends, and EMA trends, and assigns weights based on their recent performance. The "Time Weighting" setting allows users to balance between using more historical data or prioritizing recent trends. Unlike traditional weighted majority methods, SFX also dynamically penalizes larger losses. Signals are confirmed based on the consensus of the most successful indicators within the selected time period, filtering out weaker signals during underperforming phases.
The SFX Screener extracts these calculated outputs and visually organizes them into a real-time dashboard. Each signal, status, and volatility condition displayed in the screener is a direct output from the SFX Algo indicator.
🚩 UNIQUENESS
Unlike traditional screeners that rely on preset filters or static conditions, the SFX Screener dynamically updates its dashboard based on live outputs from the SFX Algo’s adaptive algorithm.
Traditional Screeners → Use predefined filters like “price above EMA” or “RSI overbought.” They do not adjust to market dynamics.
SFX Screener → Displays outputs directly from an adaptive algorithm that continuously evaluates trends, volatility, and momentum changes.
The SFX Screener can show SFX Algo's status on 8 different tickers on different timeframes. Key factors that make it unique include:
✅ Real-time sync with SFX Algo → Displays live conditions, not static filters.
✅ Comprehensive Dashboard – This screener provides a complete and customizable dashboard designed to enhance traders' decision-making by consolidating crucial SFX Algo insights into one user-friendly interface.
✅ Multi-Ticker & Multi-Timeframe Analysis – With support for up to 8 tickers and timeframes, traders can effortlessly analyze the bigger market picture, identifying trends and opportunities across different assets and timeframes.
By combining multiple analytical elements in a single view, this screener empowers traders with the insights needed to navigate the market more effectively.
🎯 SFX SCREENER FEATURES:
SFX Algo Signals : This tool can detect SFX Algo signals across different tickers & timeframes.
Volatility Bands : Detection of Volatility Bands Status & Retests.
Retracement Wave : Detection of Retracement Wave Status & Retests.
Highly Configurable : Offers multiple parameters for fine-tuning detection settings.
Up to 8 Tickers : Allows traders to analyze multiple tickers & timeframes simultaneously for enhanced accuracy.
📊 SFX SCREENER DATA BREAKDOWN
Signal ->
Buy -> The latest signal is a buy signal.
Sell -> The latest signal is a sell signal.
The rating of the signal is shown after the signal type.
Δ⭐ ->
Shows the rating change (delta) after the signal is triggered. Positive values mean that the rating is increased after the signal is given, negative values mean that it's decreased.
Status ->
Displays the amount of time passed after the signal is given.
TP Targets ->
Shows the Take-Profit targets of the signal, if a target was achieved, there is a ✅ symbol near it and the next target it displayed.
V. Bands ->
The Volatility Bands dynamically adjust to market conditions, expanding during high volatility and contracting during low volatility. When the volatility bands are tight, or the upper and lower bands are close to each other, the market is not volatile. During periods of low volatility, it’s common for price to consolidate or move sideways. An early indication of a large price move can occur when the bands widen or open up after being tight. When the volatility bands are wide, it reflects a period of increased volatility, typically during strong price trends or after a breakout. The volatility bands can also act as support and resistance areas. The upper band acts as resistance while the lower band acts as support. These mark out good areas for potential reversals. Breakouts can also occur when price moves beyond the bands, signaling a potential trend in the breakout direction.
Outside -> The price is currently outside of the Volatility Bands.
Inside | Upper -> The price is currently inside the Upper Volatility Band.
Inside | Lower -> The price is currently inside the Lower Volatility Band.
R. Wave ->
The Retracement Wave is used to identify entry points during pullbacks in trending markets. It can also be used to find exit points for open trades. The wave is bullish when price is above it and bearish when the price is below it. The retracement wave can be used as an area to enter during a pullback in a trending market. The wave can also be helpful for managing risk and closing out positions.
Outside | Bullish -> The Retracement Wave is currently Bullish, and the price is outside of it.
Outside | Bearish -> The Retracement Wave is currently Bearish, and the price is outside of it.
Inside | Bullish -> The Retracement Wave is currently Bullish, and the price is inside of it.
Inside | Bearish -> The Retracement Wave is currently Bearish, and the price is inside of it.
Profit & Loss (P&L) ->
Shows the amount of profit or loss the position is currently in. All values are shown in terms of percentage, and positive values mean the position is in profit while negative values mean that the position is in loss.
⚠ Timeframe Restriction : The selected timeframes for analysis cannot be lower than the chart’s current timeframe to ensure proper data alignment.
⏰ ALERTS
This screener supports alerts, so you never miss a key market move. You can choose to receive alerts when a buy or sell signal is given, helping you spot potential trading opportunities. Additionally, you can enable alerts for take-profit or stop-loss levels, which notify you when the price achieves those levels. The alerts will work for each enabled ticker in the settings. You can also toggle webhook format for alerts, and choose to include ticker metadata in it.
⚙️ SETTINGS
1. Algorithm Settings
Sensitivity: The sensitivity setting is a key parameter that influences the frequency of signals the SFX Algo generates. By adjusting this parameter, you can control the frequency of signals produced by the algorithm. Using a lower sensitivity setting generates more frequent signals that are highly responsive to minor price fluctuations. Using a higher sensitivity setting reduces the frequency of signals, focusing on more significant price movements and filtering out minor fluctuations.
Signal Strength: The Signal Strength setting filters signals based on their quality, allowing traders to focus on the most reliable opportunities. This feature helps traders balance the quantity and reliability of the algorithm’s signals to suit their trading strategy. Using a lower signal strength will display more signals, including those with lower signal ratings, for broader market coverage. Using a higher signal strength will display fewer signals by prioritizing those with higher signal ratings, reducing market noise.
Time Weighting: The Time Weighting setting in the SFX Algo determines how historical market data is analyzed to generate signals.
a) Recent Trends
Focuses on the most recent movements for short-term analysis. This setting is good for scalpers and intraday traders who need to react quickly to market changes.
b) Mixed Trends
Balances recent and historical price movements for a comprehensive market view. This setting is well-suited for swing traders and those who want to capture medium-term opportunities by combining the benefits of short-term responsiveness with the reliability of long-term trends.
c) Long-term Trends
Relies on extended historical market data to identify broader market trends, making it an excellent choice for traders focused on long-term strategies.
Minimum Star Rating : The Minimum Star Rating setting allows you to filter signals based on their strength, showing only those that meet or exceed your chosen threshold. For instance, setting the minimum star rating to 3 ensures you only receive signals with a rating of 3 stars or higher.
2. Take Profit / Stop Loss Methods
Key Levels
The Key Levels method uses pivot points to set take profit and stop-loss levels. The TP and SL levels are shown when a new signal is generated.
Volatility Bands
This TP/SL method uses the Volatility Bands overlay to set dynamic TP and SL levels. These levels are not predetermined so they will not be shown in advance when a signal is generated.
Signal Rating
Sets take profit and stop-loss levels based on changes in a signal's rating strength. These levels are not predetermined so they will not be shown in advance when a signal is generated.
Auto Stop-Loss
The auto method can only be applied to the SL. The auto method allows the algorithm to detect SL automatically when a momentum shift is detected. You can adjust the risk tolerance of the Auto SL by adjusting the ‘Auto Risk Tolerance’ setting. You can choose between Low, Medium, and High. A high-risk tolerance will result in stop losses being triggered less often.
3. Tickers
You can set, then enable or disable up to 8 tickers in this section to get informed about their latest SFX Algo signal.
‼️ Important Notes
TradingView has limitations when running advanced screeners, resulting in the following restrictions:
Computation Errors:
The computation of using MTF features and viewing several tickers is very intensive on TradingView. This can sometimes cause calculation timeouts. When this occurs simply force the recalculation by modifying one indicator’s settings or by removing the indicator and adding it to your chart again.
Inconsistencies:
You may notice inconsistencies when viewing the screener on a chart with a specific symbol because screener tickers originate from different markets. Since the cryptocurrency market operates 24/7, while stock markets have defined opening and closing hours, the screener may return varying information depending on whether you're currently viewing a cryptocurrency, stock, or currency pair.

Trade Quality Rating: signal rating from 1 to 5 starsOverview
The indicator is built to generate trading signals based on a combination of technical indicators and then assign each signal a quality rating from 1 to 5 stars. The idea is that the more filters that are met, the stronger (or higher quality) the signal is assumed to be. You can then use these quality ratings to decide which signals to act upon, keeping in mind that a higher-rated signal has more confirming factors.
Components of the Indicator
Simple Moving Averages (SMAs):
SMA9 and SMA20:
These two moving averages are used to detect short-term trend changes via crossovers. A bullish signal is generated when the SMA9 crosses above the SMA20, and a bearish signal when it crosses below.
SMA200 (on the current timeframe) & Daily SMA200:
The SMA200 on your current chart helps smooth out the price action.
The Daily SMA200 serves as a long-term trend filter. For a valid long signal, the price must be above the Daily SMA200, and vice versa for a short signal.
MACD (Moving Average Convergence Divergence):
The MACD is calculated using standard parameters (12, 26, 9).
It adds momentum confirmation to the signal. For a long trade, the MACD line should be above its signal line, and for a short trade, below.
RSI (Relative Strength Index):
Calculated with a 14-period setting.
For long signals, the RSI must be above 50 (indicating upward momentum), while for short signals, it should be below 50.
This filter is one of the additional conditions that add to the quality rating.
Volume Filter:
A 20-period moving average of volume is computed.
The current volume must exceed this average, suggesting that there is enough market participation backing the move.
This is another extra filter that adds to the overall quality score.
ADX (Average Directional Index):
The ADX is manually calculated in the script (using a 14-period setting) to gauge the strength of the trend.
A value above 25 is considered to confirm that a strong trend is in place, making the signal more reliable.
VWAP (Volume Weighted Average Price):
The session VWAP is computed on a daily basis.
For long trades, the price should be above the VWAP, and for short trades, below.
This serves as a confirmation that the current price is moving in the right direction relative to the volume-weighted average.
Signal Generation and Quality Rating
Base Signal (1 Star):
The fundamental trade signal is generated when the SMA9/SMA20 crossover occurs, in combination with the MACD confirmation and the condition that the price is on the correct side of the Daily SMA200. This base signal provides a 1-star quality rating.
Additional Filters (Adding Extra Stars):
RSI Filter: Adds 1 extra star if the RSI condition is met (RSI > 50 for long or RSI < 50 for short).
Volume Filter: Adds 1 extra star if the current volume exceeds its 20-period moving average.
ADX Filter: Adds 1 extra star if the ADX value is above 25, confirming a strong trend.
VWAP Filter: Adds 1 extra star if the price is above the VWAP for long trades (or below for short trades).
When all filters are met, you get a 5-star rating (1 star base + 4 extra stars).
Display and Alerts:
The indicator plots your SMAs on the chart.
When a signal occurs, it places a label on the chart showing the trade direction ("BUY" or "SELL") along with the quality rating in stars.
Additionally, alert conditions are set up so that you can receive notifications when a valid signal (based on the base criteria) is generated.
How to Use This Indicator
Filtering Trades:
Use the quality rating as a visual guide. For instance, if you want to only act on the most reliable setups, you might decide to trade only signals that are rated 4 or 5 stars.
Manual Confirmation:
Even with a high star rating, you can perform your own final checks (e.g., checking price action or additional chart patterns) before entering a trade.
Backtesting and Adjustment:
Because market conditions differ, it’s advisable to backtest the indicator on your instrument of choice and adjust the parameters (such as the ADX threshold or the period for volume averaging) to better suit your trading style.
Conclusion
This 5-star system indicator is designed to provide a comprehensive overview of trade quality by integrating multiple technical filters into one visual signal. It helps filter out noise by ensuring that a trade signal not only meets a basic SMA and MACD condition but also aligns with volume, trend strength (ADX), and VWAP criteria. This multi-layered approach can lead to fewer but higher quality trades, allowing you to focus on setups that have more confluence.
Happy trading!

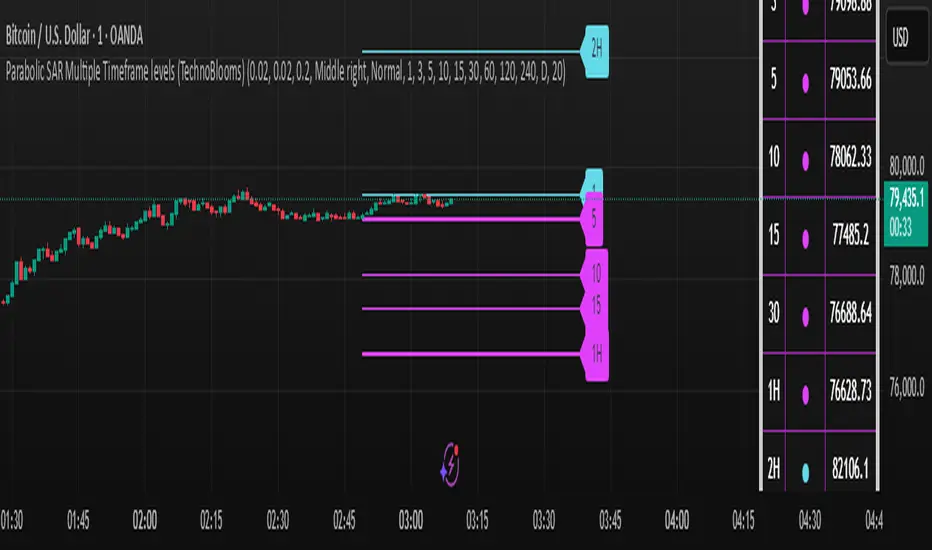
Parabolic SAR Multiple Timeframe levels (TechnoBlooms)The Parabolic SAR (Stop and Reverse) is a valuable tool for traders due to its ability to provide clear signals for trend direction and potential reversal points. One of its primary benefits is the ease of use; it visually indicates whether the market is trending up or down, helping traders decide when to buy or sell. The indicator also aids in setting stop-loss orders as it moves with price, offering a dynamic way to manage risk by suggesting when to exit a position if the trend reverses.
Viewing the Parabolic SAR (PSAR) across multiple timeframes offers traders a comprehensive approach to understanding market trends and making strategic decisions. By analyzing the PSAR on shorter timeframes like 1-minute or 5-minute charts, traders can pinpoint precise entry and exit points for quick trades, capitalizing on immediate market movements.
Settings
> User can select 10 different timeframes according to their wish
> User can change Parabolic SAR settings like Start, Increment and Maximum Value
Killzone Session Lines [odnac]This Pine Script indicator displays vertical lines marking the start of key market sessions, known as Killzones, for both today and yesterday. These lines help traders identify important trading hours for the Asia, Europe, and New York sessions.
Killzone Vertical Lines:
Draws vertical lines for the start of the Asia, Europe, and New York sessions.
Displays lines for both today and the previous day to compare price action across sessions.
Customizable Time Settings:
Users can set the exact start hour and minute for each Killzone.
Time zones adjust automatically based on the chart's time zone.
Visual Customization:
Change the color, width, and style of the vertical lines (solid, dotted, dashed).
Toggle each session's lines individually for a cleaner chart.
Previous Start Lines:
Optional lines for the opening of today, the previous day, and the previous week, providing historical context for support and resistance levels.
Why Use This Indicator?
Session Awareness: Know exactly when major market sessions start to identify potential volatility spikes.
Historical Context: Compare today’s price action with previous sessions to spot recurring patterns.
Clean Charting: Automatic updates prevent clutter, keeping your workspace organized.
Flexible Customization: Tailor the display to fit your trading style and preferences.
