TriplePower55%🔴 Bearish Candle (Losing Candle)
🔹 Definition:
A candle that closes below the opening price.
Important condition: the body of the candle must be ≥ 55% of the entire candle's range.
It is automatically colored red on the platform.
🔹 Significance:
Used to identify resistance levels or initiate the Triple Power analysis.
The last valid bearish candle (with a body and that broke a bullish candle) is selected to draw Fibonacci levels.
🔹 How it's handled:
When the price closes above the high of the bearish candle, an upward wave begins.
The indicator draws a blue line at its high and a red line at its low, with the timeframe labeled (e.g., TF: M).
🟢 Bullish Candle (Winning Candle)
🔹 Definition:
A candle that closes above the opening price.
Its body must be ≥ 55% of the total candle's range.
It is automatically colored green on the platform.
🔹 Significance:
Used to identify support levels, or as a reference in extensions or pauses.
The last closed bullish candle is used to draw extension targets if there’s no valid bearish candle.
🔹 How it's handled:
If the price closes below the low of the monthly bullish candle, it signals the start of a strong downward trend.
If the low is not broken, the movement is considered a temporary pause.
The stop level is placed at the low of the last closed bullish candle.
Candlestick analysis
Engulfing 3x PatternDescription:
The "Engulfing 3x Pattern" indicator identifies bullish and bearish engulfing candlestick patterns where the engulfing candle's body is at least three times larger than the body of the previous candle. This highlights significant momentum shifts in the market, focusing solely on body size (open to close), ignoring wicks.
Bullish Engulfing: A bearish candle (close below open) is followed by a larger bullish candle (close above open) that fully engulfs the prior candle’s body and has a body at least 3x larger. Marked with a green triangle below the bar.
Bearish Engulfing: A bullish candle (close above open) is followed by a larger bearish candle (close below open) that engulfs the prior candle’s body and has a body at least 3x larger. Marked with a red triangle above the bar.
How It Works:
This indicator scans for engulfing patterns and applies a size filter to ensure the engulfing candle demonstrates strong conviction. It’s useful for traders looking for potential reversals or continuation signals backed by significant price movement. The 3x multiplier can be adjusted in the code (e.g., to 2x or 5x) for customization.
Usage Tips:
Best used with confirmation from support/resistance levels, trends, or other indicators.
More reliable on higher timeframes (e.g., daily, 4-hour).
Signals are purely price-based; consider volume or momentum indicators for additional context.
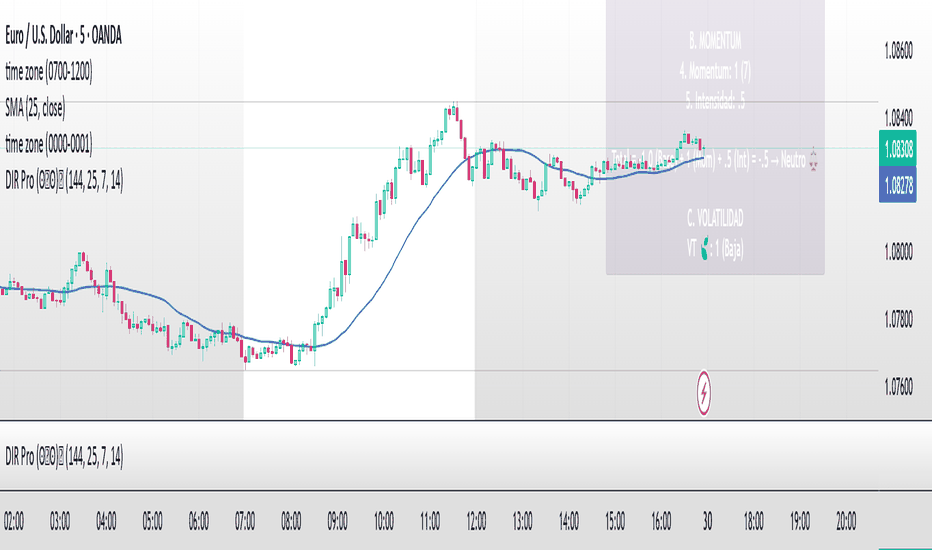
DIR Pro (ʘ‿ʘ)ノMomentum System
Detection: Uses ta.barssince() to count consecutive closes above/below EMA25
Threshold: Requires ≥7 consecutive bars (momentum_length)
Output: Directional integer (-1/0/1) + duration count
Intensity Metric
pinescript
Copy
intensity = sum(last 3 bars' distance > historical reference) × 0.5
Comparison Window: Current vs momentum start period (3-bar rolling window)
Scaling: 0.5 points per confirmation (max 1.5)
Score Weighting
Copy
Total = (Base × 70%) + (Momentum × 20%) + (Intensity × 10%)
Base (70%): Long-term EMA25 positioning (144-period exponential decay)
Momentum (20%): Trend persistence confirmation
Intensity (10%): Short-term acceleration strength
Key Fixes Applied
NaN Protection: Added ternary checks (peso_total != 0 ?) in all metric calculations
Position Adjustment:
Horizontal: bar_index + 12 (moved 3cm right)
Vertical: high * 1.015 (moved 3cm up from price)
Metric Visibility: Explicit inclusion of AvgD/Body in Section A
Precision Formatting: #.0 format for 1-decimal consistency
Анализ Покупателей и Продавцов Mikhail BarulyaIndicator Description: "Buyer and Seller Analysis"
📌 Purpose of the Indicator
This indicator analyzes the balance of power between buyers and sellers, identifying which side dominates the market. It helps determine whether the market is controlled by bulls or bears and evaluates the potential direction of future price movements.
The indicator displays the strength of buyers and sellers, identifies dominance zones, and predicts trend shifts based on moving averages, volume, volatility, and trend filters.
📊 How the Indicator Works
The indicator analyzes each candle and calculates:
✅ Buyer and Seller Strength
If the candle closes above the open → buyer strength increases
If the candle closes below the open → seller strength increases
The higher the volume, the greater the impact on strength
✅ Adaptive ATR Filter
Filters abnormal price movements, reducing misleading signals about market strength
✅ Trend Filter
If the price is above SMA and VWAP → uptrend
If the price is below SMA and VWAP → downtrend
✅ RSI and CCI Indicators
RSI helps identify overbought/oversold conditions
CCI confirms trend strength
✅ Price Movement Forecast
Uses a weighted average of buyer/seller strength over upcoming candles
If the forecast signals an increase → higher probability of continued uptrend
If the forecast signals a decrease → higher probability of downtrend
📌 How to Use the Indicator
1. Buyer and Seller Strength Analysis
Green Line → Represents buyer strength
Red Line → Represents seller strength
If buyer strength is higher → bulls control the market 🐂
If seller strength is higher → bears control the market 🐻
2. Market Analysis Label
A label appears on the chart displaying:
✅ Current dominance: Buyers / Sellers / Equilibrium
✅ Forecasted market direction
✅ RSI and CCI values
📌 This helps traders understand who is in control and the most probable price movement.
📈 Application in Trading
🔹 Trend Analysis
Buyer and seller strength helps assess trend sustainability
Confirms trends using VWAP and SMA
🔹 Filtering Market Noise
Filters out abnormal movements with adaptive ATR
Avoids misleading signals using RSI and CCI
🔹 Market Balance Assessment
If buyer and seller strength is equal, the market is in a range
If one side dominates, the probability of movement in that direction increases
🔥 Key Takeaways
✅ Shows market power balance
✅ Identifies the dominant side
✅ Forecasts possible price movements
✅ Filters out abnormal volatility
🚀 Use this indicator to analyze market dynamics and identify strong trends!
Short Selling DetectionExplanation of Candlestick Patterns:
Bearish Engulfing:
The previous candle is bullish (close > open), and the current candle is bearish (close < open).
The current candle's open is higher than the previous candle's close, and the current candle's close is lower than the previous candle's open.
Shooting Star:
The current candle is bearish (close < open).
The difference between the high and close is more than twice the difference between the open and close, and the close is above the low.
Dark Cloud Cover:
The current candle is bearish (close < open).
The close is below half the previous candle's body (open - (high - low) * 0.5).
The Shooting Star and Dark Cloud Cover patterns were manually defined as well.
You can set alerts based on the "Short Selling Signal" condition, which will notify you of potential short-selling opportunities.
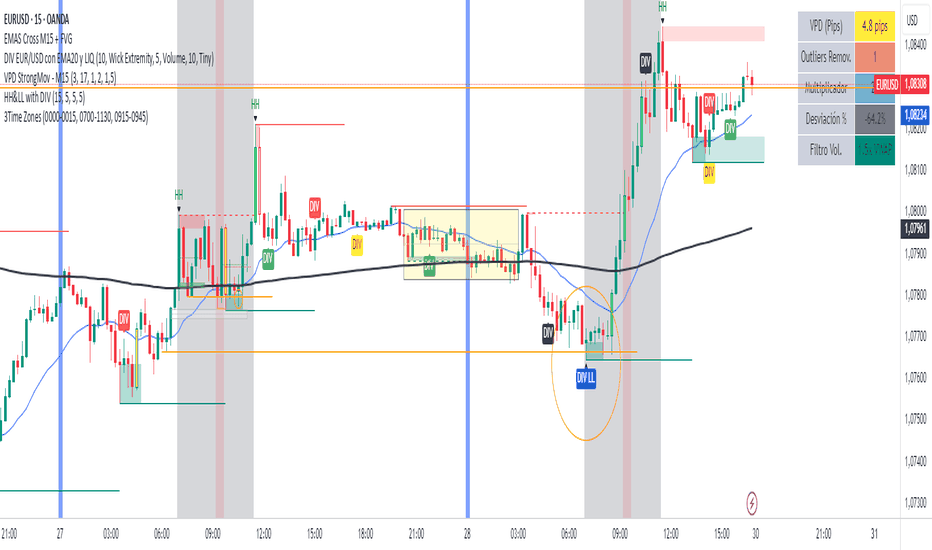
PSP [Zinho`s indicator]The PSP - NQ ES YM indicator tracks the price movements of the NQ, ES, and YM futures to identify correlation and divergence between them.
If a candle closes green in NQ and ES closes red , you want that candle to be highlighted.
PSP candles are used as potential reversal points.
If the PSP is aligned with my trading bias, I utilize this indicator as a confirmation tool before taking a trade.
I hope you enjoy.
MM Extend GapsMM Extend Gaps - Advanced Indicator for Gap Detection and Analysis
Description: The MM Extend Gaps indicator is designed to identify and track gaps between candles on the chart, which may signal potential trading opportunities. This indicator uses advanced logic and provides precise gap visualizations in real-time, which is invaluable for traders and analysts focused on these price movements.
Key Features:
*Gap Detection: The indicator automatically identifies bullish (green) and bearish (red) gaps between the current candle and the two previous candles. Gaps are determined by the open and close prices of the candles.
*Gap Visualization on the Chart: Gaps are visualized with colored boxes (bullish = green, bearish = red) directly on the chart. Each box shows the gap range, which may be filled in the future.
*Higher Timeframe (MTF) Support: You can use it on all timeframes with a large history.
*Alert Option: Set up alerts when the price touches a gap, ensuring you don’t miss any trading opportunities.
*Customizable Settings: The indicator allows you to customize the colors of the gaps, show filled gaps, and define whether old gaps should be deleted once filled.
Benefits for Traders:
*Get Accurate Gap Analysis: The indicator provides immediate gap visualization, allowing you to better identify areas with high profit potential.
*Enhance Your Trading Strategy: With this information, you can better predict market movements and adjust your trades accordingly.
*User-Friendly: With an intuitive interface and customizable settings, MM Extend Gaps is easy to use and offers a wide range of customization options for any trader.
*Alerts for Maximum Efficiency: Set alerts for the most important gaps in your trading strategy.
Who is this indicator for?
Day traders and swing traders who trade based on gaps.
Technical analysts who want to better understand market movements and gaps.
Stock, forex, and cryptocurrency traders who focus on gap detection.
Multi-Timeframe FVG w/ FilteringThis indicator uses timeframes both higher, lower, and equal to your charts timeframe. Enable as many as 5 different timeframes.
This indicator has a filtering system that measures volume on Fair Value Gaps. Enable or Disable this setting to show or to not show certain FVG's, because not all FVG's are created equal :)
In the settings, under the Advanced Settings section, there are two settings:
FVG Length - the value assigned to this setting is the length of bars FVG's will be set to the right.
FVG Strength Multiplier - the value assigned to this setting is the multiplier set to the FVG Length when FVG's are in high volume ranges. So, likely, stronger FVG's will appear longer than weaker FVG's. (This effect is not linear)
You can enable or disable both bullish and bearish FVG's and change their colors and opacity.
As always, feel free to leave any great ideas in the comments or by dm that you may have to improve the indicator!
Note that the 5min chart in the display is showing 3min FVG's!
LongBuyLongSellConfirmationIndictor2📢 New Update: "LongBuyLongSellConfirmationIndicator 2" 📢
🚀 Buy and Sell Signals Simplified! 🚀
The LongBuyLongSell Confirmation Indicator 2 now makes identifying Buy and Sell signals even easier! 🎯
🔔 What's New?
✅ Seamless alert conditions for Buy & Sell signals.
✅ Effortless setup for tracking market opportunities! 📊
👉 Want to explore the original version? Check out LongBuyLongSell Confirmation Indicator 1 here.
For Better result ,use LongBuyLongSellConfirmationIndicator1 ,2,3
all are free ,just make it to your favourite and add .Alerts also supported .
💡 Pro Tip: Add 1,2,3 to your chart for maximum accuracy and precision! 📈
💬 Feedback? We’d love to hear your thoughts! ❤️
AI Trading Signals Indicator v4.0🧠 AI Trading Signals Indicator v4.0
Description
The AI Trading Signals Indicator v4.0 is a multi-strategy signal suite tailored for discretionary and semi-automated traders who want to analyze market momentum shifts, trend changes, and potential breakout scenarios. This script combines classic technical indicators like RSI, VWAP, EMAs, SMA, and dynamic price action structures to generate Buy, Sell, Management, and Caution signals in real-time. Works for Crypto, Stocks, and Forex (all chart time-frames).
Unlike traditional single-strategy indicators, this tool gives you full control over the signal types you'd like to view by selecting from one of five integrated strategy modes via a dropdown:
All Strategies
Buy and Sell
Long Positions Only
Short Positions Only
Breakout Strategy
Bull Season to Bear Season (BTC Only)
This indicator is non-repainting and responds to confirmed crossover/crossunder events, trend channels, and conditions based on price interaction with moving averages and momentum filters.
🔍 What This Script Does
Trend Analysis:
Uses a layered combination of short, medium, and long-term EMAs (20, 50, 200) to detect trend transitions through crossover patterns.
Breakout Detection:
Identifies potential breakout zones using custom support/resistance levels and signals LC (Long Continuation) or SC (Short Continuation) after multi-bar confirmation.
Momentum Filtering:
Applies RSI and a VWAP-modified RSI to highlight areas of potential momentum exhaustion or shifts. The enhanced RSI-VWAP method helps contextualize overbought/oversold conditions with additional signal refinement.
Trade Management Visualization:
Displays configurable management zones including user-defined stop-loss buffers (e.g., 2% below entry) and visual target thresholds (e.g., 3% above entry), plotted as dotted lines for clear chart tracking.
BTC Cycle Monitoring:
Includes Bitcoin-specific trend awareness tools like Cycle Squeeze Detection and a BTC Top Alert, based on custom macro-level moving averages.
📈 How to Use It
Select a strategy mode from the dropdown that aligns with your trading preferences.
Enable or disable visual signals in the “Style” tab to customize clarity.
Use Buy signals as potential entries and Management (💰) signals to monitor trade activity or evaluate possible exit areas.
Breakout-focused traders can watch for LC/SC markers, indicating continuation setups after breakout conditions.
BTC-specific tools (Bull/Bear Season and BTC Top) are designed for use exclusively with Bitcoin charts.
✅ Key Features
Combines multiple signal types in one adaptive, modular script
Built-in trade management visualization tools for customizable planning
Custom breakout logic with confirmation layers
Advanced RSI-VWAP logic for momentum interpretation
Minimal, intuitive visuals using icons and labels for clean charting
Works across all markets and timeframes; includes a BTC-specific mode
🛠️ Author’s Note
This script was developed with active chart users and strategic traders in mind. It merges several classic indicators with a flexible signal architecture, supporting both trend-following and reversal-based analysis. Breakout recognition and cycle awareness features were added to help streamline market interpretation for those seeking less chart noise and more focused signal visibility.
⚠️ Disclaimer
This script is for educational and informational purposes only. It does not constitute financial advice, trading advice, or a guarantee of performance. Always conduct your own research and consult with a licensed financial advisor before making any trading decisions.
NWOG / NDOG ICT (The_ADHD_Trader)This indicator plots the NWOG (New Week Opening Gap) and/or NDOG (New Day Opening Gap) for ETH (Electronic Trading Hours) and/or RTH (Regular Trading Hours) as well as the Event Horizon (the 50% distance between two NWOGs) as teached by ICT, The Inner Circle Trader.
NY SNIPER / London HeistThis script is a direct update of the NY session Sniper script I previously made.
Change now added to include same logic for London Open.
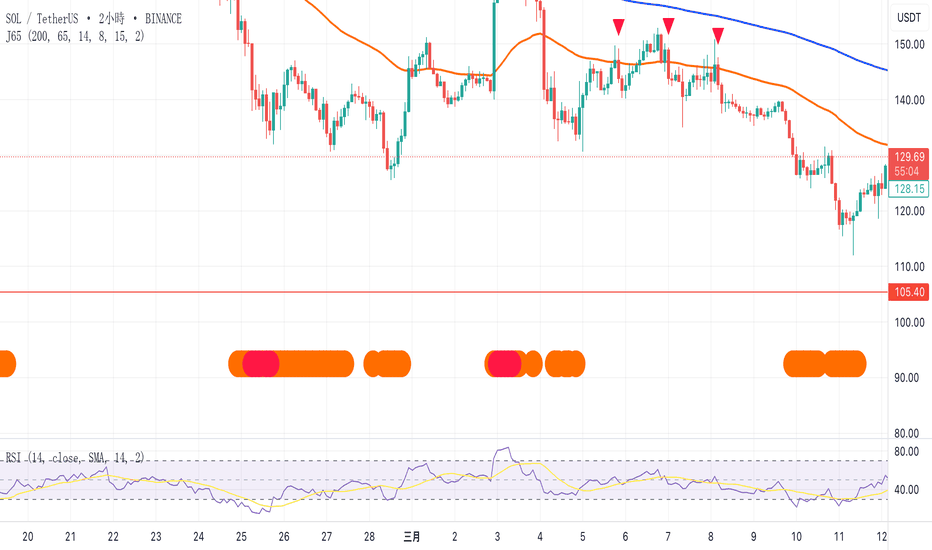
Johnny 65I do this one base on ema 200 ,50 and rsi
The green triangle mean it have big percentage it will go up
Time Compression ZonesTime Compression Zones is an experimental indicator based on the idea that markets often "go silent" before making a strong move. During these moments, volatility drops, price action slows down, and energy accumulates beneath the surface — often followed by an explosive breakout.
The indicator identifies "time compression zones" — periods where the current volatility drops below a specific threshold relative to its moving average. These areas are highlighted on the chart and may serve as early signals of upcoming market expansion.
Time Compression Zones — это экспериментальный индикатор, основанный на идее, что рынок перед сильным движением часто "замирает". В такие моменты волатильность падает, движение становится вялым, но внутри копится энергия, которая вскоре может "взорваться" в виде импульса вверх или вниз.
This is not a directional indicator — it highlights pre-breakout conditions
Best used on 1H to 4H timeframes
Ideal for cryptocurrencies, gold, and futures
//RU
Индикатор определяет зоны "временного сжатия" — участки, где текущая волатильность падает ниже определённого порога относительно своей средней величины. Эти участки визуально выделяются на графике и могут указывать на приближающийся выход из "зоны накопления".
Индикатор не даёт направленного сигнала — он показывает периоды ожидания.
Лучше всего работает на 1H–4H таймфреймах
Подходит для криптовалют, фьючерсов, золота
McLan Pro Strategy Enhanced1. **Dynamic TP/SL Based on ATR**:
- Take Profit = Entry ± (ATR × Multiplier)
- Stop Loss = Entry ∓ (ATR × Multiplier)
- Adjustable via input parameters
2. **Additional Filters for Accuracy**:
- Stochastic Oscillator as confirmation
- Only enter when Stochastic aligns with the trend direction
3. **Improved Position Management**:
- Auto-close positions when TP/SL is hit
- Separation between entry and exit logic
4. **Enhanced Visualization**:
- Clear TP/SL lines with distinct colors
- Background color for trend direction
- More informative entry labels
5. **Customizable Parameters**:
- TP/SL multipliers
- ATR period
- Enable/disable TP/SL
## **🎯 How to Use:**
1. **Buy Signal**:
- Triggered when price is above ATR Trailing Stop + EMA crossover
- Stochastic bullish (K > D and not overbought)
- SL = Entry - (ATR × SL Multiplier)
- TP = Entry + (ATR × TP Multiplier)
2. **Sell Signal**:
- Triggered when price is below ATR Trailing Stop + EMA crossunder
- Stochastic bearish (K < D and not oversold)
- SL = Entry + (ATR × SL Multiplier)
- TP = Entry - (ATR × TP Multiplier)
## **📊 Optimization for Scalping**:
- Use M5-M15 timeframe
- ATR Period 10-14
- TP Multiplier 2.0-3.0
- SL Multiplier 1.0-1.5
- Activate during London/New York sessions
This strategy now features **controlled risk-reward ratios** and **stricter entry confirmations**. For best results, combine with proper risk management (1-2% per trade).
NWOG / NDOG ICT (The_ADHD_Trader)This indicator plots the NWOG (New Week Opening Gap) and/or NDOG (New Day Opening Gap) for ETH (Electronic Trading Hours) and/or RTH (Regular Trading Hours) as well as the Event Horizon (the 50% distance between two NWOGs) as teached by ICT, The Inner Circle Trader.
Golden Cross & Death Cross Strategy with SL & TPGolden Cross (BUY Signal):
• Enter long when 50 EMA crosses above 200 EMA
• Stop-Loss = 1% below entry price
• Take-Profit = 2x risk (default 1:2 ratio)
✅ Death Cross (SELL Signal):
• Enter short when 50 EMA crosses below 200 EMA
• Stop-Loss = 1% above entry price
• Take-Profit = 2x risk
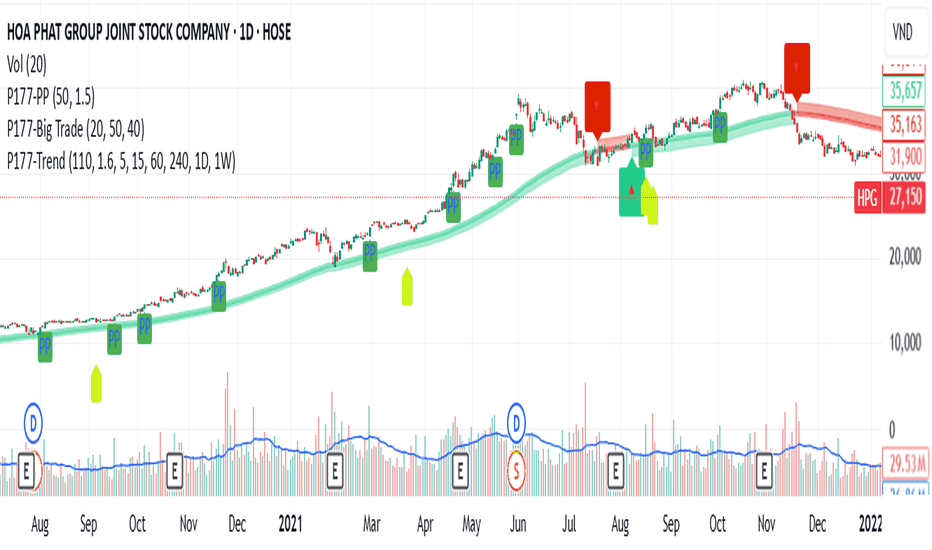
P177-Big TradeThis indicator is used to detect institutional money flow/investment funds participating in the market with yellow tag signals and withdrawing with black ones.
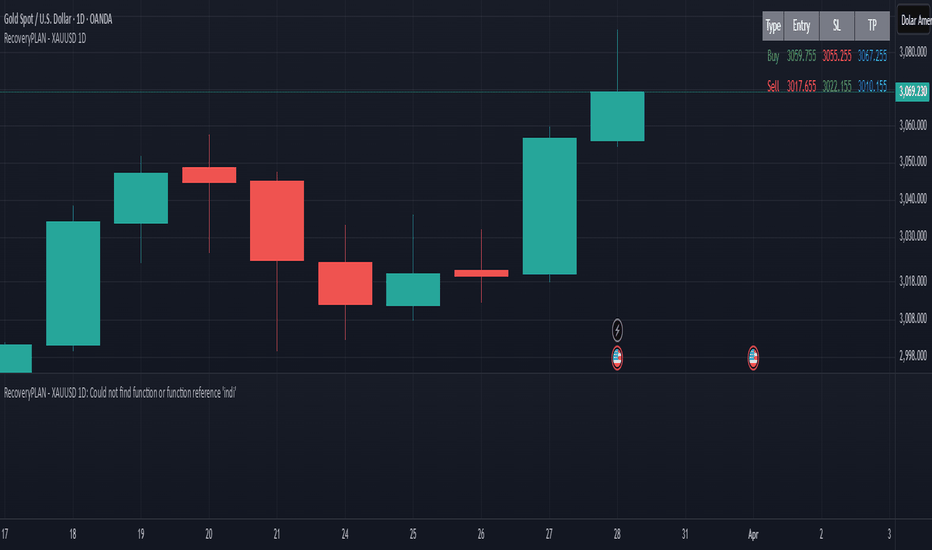
RecoveryPLAN - XAUUSD 1DCopyright RecoveryPLAN
This indicator utilizes the probability opportunities of the XAUUSD candlestick habits which are specifically designed for the 1D timeframe and have minimal risk because they use a relatively small stop loss.
Shadow EdgeShadow Edge Indicator
Overview
Shadow Edge is an advanced technical analysis tool that visualizes key price levels and statistical patterns based on multiple timeframe analysis. It helps traders identify potential support, resistance, and expansion zones by tracking historical price behavior at specific hours of the trading day.
This indicator offers unique statistical insights by calculating average expansion levels and tracking market behavior patterns on an hourly basis. Unlike standard technical indicators, Shadow Edge combines historical price analysis with proprietary statistical calculations to identify high-probability zones for market reactions.
Key Features
• Previous High/Low Visualization : Displays previous session high and low levels with configurable line styles
• Mean Expansion Levels : Calculates and displays average price expansion levels (MuEH/MuEL) based on historical data
• Manipulation/Distribution Levels : Shows potential manipulation and distribution zones calculated from price action patterns
• Sweep Detection : Alerts when price sweeps previous high or low levels with customizable offset
• Multi-timeframe Analysis : Analyzes higher timeframe data and projects it onto your current chart
• Statistical Tracking : Maintains a database of price behavior by hour to identify recurring patterns
• Fully Customizable Visuals : Adjust colors, line styles, and transparency to match your chart setup
Settings
• Customize appearance of all elements including candles, lines, and labels
• Toggle visibility of different price levels
• Set alert conditions for level tests and sweeps
• Configure historical bar lookback period
• Optional stats display showing reliability percentages by hour
Use Cases
• Identify potential reversal zones at previous highs/lows
• Anticipate likely price expansion based on statistical averages
• Recognize manipulation and distribution patterns in price action
• Set precise alerts for sweep events at key levels
• Enhance your trading strategy with multi-timeframe analysis
How to Use It
1. Initial Setup : Apply the indicator to your chart and configure the higher timeframe setting (default is 60 min) to match your trading style.
2. Level Identification :
• Previous High (PH) and Previous Low (PL) levels show where price previously found support/resistance
• Mean Expansion High (MuEH) and Low (MuEL) levels indicate statistically likely price boundaries
• The Previous EQ level represents the equilibrium point between previous high and low
3. Trading Strategy Applications :
• Look for price reactions when testing previous high/low levels
• Use expansion levels (MuEH/MuEL) as potential take-profit targets
• Monitor manipulation (-M, +M) and distribution (-D, +D) levels for potential reversal zones
• Set alerts for sweeps of previous high/low levels to identify potential stop hunts
4. Statistical Analysis :
• The optional stats table shows reliability percentages for different hours
• Higher percentages indicate historically stronger adherence to the projected levels
• Use this data to adjust your trade timing and risk management
5. Visual Customization :
• Adjust colors and line styles to create a clean, easy-to-read chart
• Toggle different elements on/off based on your specific trading approach
• Reduce transparency settings if you prefer a more subtle visual overlay
Important Notes
• This indicator uses statistical calculations to identify price levels; past performance does not guarantee future results
• For best results, use on liquid markets during their primary trading sessions
• While the indicator provides statistical projections, always combine these signals with your own analysis and risk management strategy
• The code containing the proprietary algorithms is protected as closed source to maintain its integrity
Limitations
• The indicator requires sufficient historical data to calculate accurate statistical levels
• Performance may vary depending on market volatility and trading conditions
• Level projections work best on standard chart types (not Heikin Ashi, Renko, etc.)
• Sweep detections should be confirmed with price action before taking action
Note : Contact me for a version of this indicator that can work on any Higher Timeframe.
FVG ST/RE Detector(v1.0.73)FVG ST/RE Detector
The FVG ST/RE Detector is a powerful technical analysis tool designed to identify market structure and potential trading opportunities through Fair Value Gaps (FVG), Structure Transitions (ST), and Re-entries (RE).
What This Indicator Does:
This indicator identifies and displays:
Fair Value Gaps (FVG): Areas where price has moved so quickly that it has left an imbalance in the market. These gaps represent potential areas where price may return to in the future.
Structure Transitions (ST): Points where the market structure changes from bearish to bullish or vice versa, signaling a potential trend change.
Re-entries (RE): Opportunities to enter the market in the direction of the prevailing trend after a pullback.
Leg Lines: Horizontal lines representing key structural movements in the market, helping traders visualize the market structure more easily.
How It Works:
The indicator detects FVGs when price moves rapidly, creating gaps in market value.
ST points are identified when the direction of FVGs changes from bearish to bullish or vice versa.
RE points are identified when a new FVG forms in the same direction after a pullback.
The indicator tracks and displays the number of consecutive leg lines in the current trend direction.
Key Features:
Customizable colors for bullish and bearish patterns
Optional display of ST and RE labels
Adjustable leg lines with multiple style options
Statistics panel showing the number of legs in the current direction
Alert system for new leg formations
Mitigation tracking to identify when FVGs have been filled
How to Use This Indicator:
Look for ST points to identify potential trend changes
Use RE points to find potential entries in the direction of the prevailing trend
Monitor the number of legs to gauge trend strength
Use FVGs as potential support and resistance areas
Set alerts to be notified of new leg formations
This indicator is suitable for all timeframes and markets, and can be used as part of a comprehensive trading strategy.
本指标的功能:
该指标识别并显示:
公平价值缺口 (FVG):价格快速移动以至于在市场中留下不平衡区域的区间。这些缺口代表价格未来可能回归的潜在区域。
结构转换 (ST):市场结构从看跌转变为看涨或相反的点位,预示潜在的趋势变化。
重新进入 (RE):在回调后沿着主导趋势方向进入市场的机会。
趋势腿线:代表市场中关键结构移动的水平线,帮助交易者更容易地可视化市场结构。
RSI MA Crossover + SAR + VOLUME🧠 RSI MA Crossover + SAR + VOLUME — Smart Signal Suite
This script generates precise buy and sell signals based on a combination of:
✅ RSI crossover with its own moving average
✅ Parabolic SAR trend reversals
✅ Optional volume validation (vs average or previous candles)
✅ Optional candle body confirmation
✅ Directional RSI filters with adjustable limits
✅ Smart signal delay to avoid repetition
✅ ✅ Advanced trigger logic: Let SAR reversal act as a signal if RSI crossed recently
All filters and conditions are customizable, giving you full control over signal precision and behavior.
🔧 Ideal for scalpers, swing traders, and strategy testers looking for smart logic and advanced filtering.
Let me know if you'd like a Spanish version as well or a shorter version for socials!

