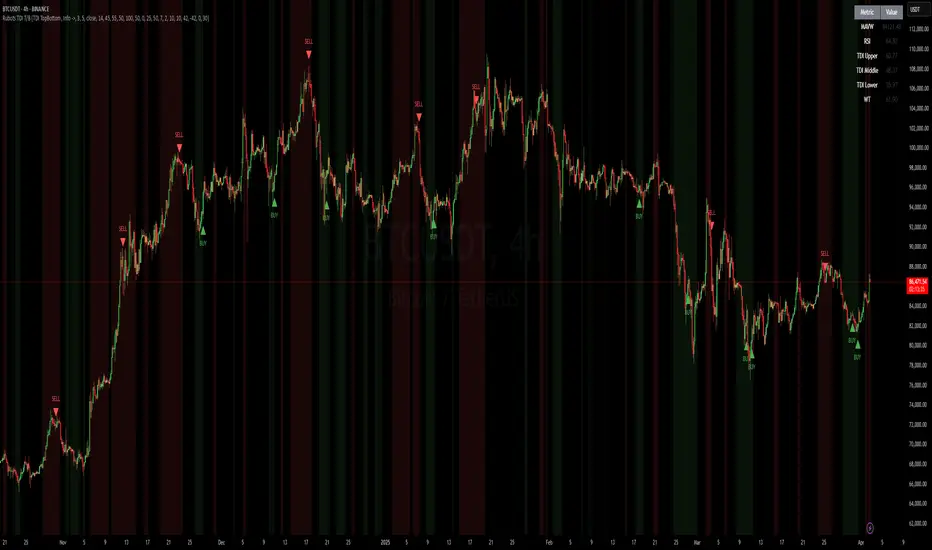
Rubotics TDI Top/Bottom Indicator**Rubotics TDI Top/Bottom Indicator (Rubots TDI T/B)**
This proprietary indicator integrates several technical analysis tools into one cohesive system to help traders identify potential top and bottom signals directly on the price chart. Unlike standard indicators that merely plot common metrics, this script uniquely fuses a custom moving average algorithm with established oscillators to enhance signal clarity and market timing.
**Core Components and Unique Features:**
- **Global Visual Settings:**
- Easily toggle visual elements (tables, background highlights) that display key metrics and trading setup information.
- Provides a detailed on-chart display of strategy data and essential trading parameters.
- **MAVW Calculation (Proprietary):**
- Computes a series of weighted moving averages using Fibonacci-inspired lengths (3, 5, 8, 13, 21, 34) to generate a dynamic moving average (MAVW).
- The MAVW line is color-coded—blue when trending upward, red when trending downward, and yellow when neutral—to offer an immediate visual cue of market direction.
- **RSI Module:**
- Calculates the RSI on a user-selected price source (default: close) with a customizable period (default: 14).
- Adjustable thresholds (default: 45 and 55) allow for fine-tuning of overbought and oversold conditions.
- **TDI Component:**
- Adapts the RSI into a dynamic channel using a simple moving average and a scaled standard deviation (multiplied by 1.6185) to form upper and lower bands.
- Incorporates both fast and slow moving averages (default periods: 2 and 7) with optional band filling to visually highlight momentum changes.
- **Note:** The TDI logic is based on public methodologies for converting RSI data into a dynamic indicator.
- **WaveTrend Oscillator:**
- Uses configurable channel and smoothing parameters to generate a WaveTrend line for additional momentum confirmation.
- The oscillator is used to further validate top and bottom signals by identifying overbought or oversold conditions.
- **Note:** The WaveTrend calculations are derived from widely available, public-domain techniques.
- **Signal Generation:**
- **Buy Signal:** Generated when the RSI is below its lower threshold, the TDI fast MA crosses above the lower band (with prior bar confirmation), the price is below the MAVW, and the WaveTrend indicates oversold conditions.
- **Sell Signal:** Generated when the RSI is above its upper threshold, the TDI fast MA crosses below the upper band (with prior bar confirmation), the price is above the MAVW, and the WaveTrend signals overbought conditions.
- Signals are visually marked on the chart with upward and downward triangles and accompanied by alert conditions.
- **Volume-Based Bar Coloring & Additional Visuals:**
- Colors price bars based on volume relative to a moving average to highlight the strength of moves.
- Provides background color changes and a dynamic table of key metric values (MAVW, RSI, TDI bands, WaveTrend) for real-time analysis.
**Customization and Originality:**
- Extensive input parameters allow traders to adjust each component to suit their trading style and market conditions.
- The unique combination of the proprietary MAVW calculation with traditional RSI, TDI, and WaveTrend elements creates a robust system for detecting market tops and bottoms.
- **Closed-Source Justification:**
This indicator is published as a closed-source script due to the proprietary enhancements integrated into the MAVW algorithm and signal generation logic. These unique modifications provide added value beyond standard public indicators.
Candlestick analysis
Vertical Lines at Specific TimesVertivcal lines to show manipulation, expansion times and when to expect judas


InsideBar Indicatorinside bar indicator
- this is temp indicator for check that we get indication on desired inside bar or not

InsideBarInside Bar Strategy.
- latest inside bar after crossing ema
- no buy trade after buy and no sell after sell

Multi-Strategy Framework v3Multi Strategy Framework: 38 Strategies ensemble with Risk Management on top.
This trading system integrates over 38 independent strategies into a single, powerful strategy. Each strategy contributes its unique market perspective, culminating in a holistic view of the asset. The framework is further enhanced with sophisticated risk management and position sizing techniques.
Key Strategies Include:
• Moving average analysis
• Market structure evaluation
• Percentage rank calculations
• Sine wave correlation
• Fourier Frequency Transform (FFT) for signal composition analysis
• Bayesian statistical methods
• Seasonality patterns
• Signal-to-noise ratio assessment
• Horizontal, Resistance & Indecision levels identification
• Trendlines and Channels recognition
• Oscillators
• Open interest and funding rates analysis
• Volume and volatility measurements
• Divergence and Convergence
Two-Tiered Approach:
1. Market Regime Identification Layer: The combined output of all strategies determines the market regime, visually represented by a color-coded background.
2. Risk Management & Execution Layer: Based on the identified regime, the system applies different entry and exit rules, employing trend-following in bull markets and mean reversion in bear markets. This layer includes entry and exit filters, position sizing rules, take profits parameters and risk managment.
This framework is optimized for cryptocurrencies, offering a robust solution for trading in these volatile markets. It's intention is to serve as a safer way to invest in crypto assets, ensuring you:
Never miss strong upside trends and exit in time to avoid major drawdowns
Market Regime Optimization and Implementation:
• Each Market Regime strategy is designed for easy optimization, with a maximum of 4 parameters.
• All strategies produce consistent signal types, which are aggregated for final market direction decisions.
• Individual optimization of each strategy is performed using the Zorro Platform, a professional C++ based tool.
• All strategies are tested to work by themselves with Walk-Forward back testing
• Strategies that don't enhance market regime definition are not excluded enhancing robustness
Risk Management & Execution Optimization and Implementation:
• The strategy has different exits depending on the market regime, and its rules and parameters are optimized with full data minus simulation to obtain robust parameters.
• The strategy makes sure it never loses a big % of unrealized profits, and has always stop losess for the entries making sure % of losses are controlled.
• Take profits and position sizing are based on oscillators and strategy conditions.
• The methods used to trade in each market regimes are fully studied and tested to work in out of sample environments.
• This layer has options to see results in inverse trading conditions, long & short or 1 direction only, the performance of each market regime, and an option to display each market regime strategy individually. Also it can show backtest and out of sample results together or individually.
The following show results for this strategy optimized for different pairs.
The strategy for aech pair come pre-configured with optimized parameters by default, so there's no need to make any adjustments. However, it’s important to use the timeframes, exchanges, and max bar number for each pair. A Premium account with 20.000 bars is wanted but not fully needed. To get access to each strategy get in touch with me thorugh the platform.
Free Month for Testing:
You are eligible for a free one-month trial to test the strategy before committing. This allows you to fully explore its capabilities without any immediate cost.
If you are interested in automating the strategy, I recommend using a tool like Autoview. The strategy is fully compatible with automated trading and many 3rd party providers; contact me directly to write down the syntax at an extra cost.
This invitation-only TradingView script represents a culmination of extensive research and optimization, designed to provide serious traders with a powerful tool for navigating the complex cryptocurrency markets it is not shared publicaly or freely.
❓FAQ
Q: Can I use it for scalping?
A: This system is better suited for swing or trendholding periods, so no.
Q: Does it repaint?
A: No, all signals are calculated on confirmed bars only.
Q: Can I use it on stocks or forex?
A: It's optimized for crypto, but you can test it on other assets — results may vary.
Q: Can I automate it with TradingView alerts?
A: Yes, it supports full automation with platforms like Autoview. You’ll need signal syntax, available upon request.
Q: Can I use it on a free TradingView account?
A: Yes but results will not be as good and it might incur in losses check the backtest first and do a simulation period if needed.
Q: Does the startegy works in out of sample?
A: Yes all strategy pairs have already a period of outsample where you can check the results.
Q: Which coins are available?
A: I only use coins with at least 6 years of data and sufficient volume on exchanges. Pairs include: BTC, ETH, LTC, XRP, BNB, LINK, ADA, DOGE, XLM, ATOM, S, POL and a few others.
Q: Can it be used on Forex, stocks, or indices?
A: It is optimized for crypto, but it may work on other markets. Results on non-crypto assets should be manually tested, and performance is not guaranteed outside crypto.
Q: Can I cancel anytime?
A: Yes, subscriptions are month-to-month and can be stopped anytime without penalties.
Q: Can I access the settings?
A: Yes, all key settings are visible. However, default parameters are pre-optimized for each pair and shouldn't require changes for best performance.
Q: How often is the script updated?
A: The framework is actively maintained. Updates are pushed when improvements, optimizations, or new strategies are added. Parameter optimizations are done yearly.

Currency Strength AnalyzerThis indicator calculates and ranks the strength of eight major currencies (AUD, CAD, CHF, EUR, GBP, JPY, NZD, USD) based on a stochastic-based scoring system. It retrieves forex pair data and determines each currency's relative strength using a customized scoring method.
Features:
Uses stochastic (Stoch) indicators to calculate bullish/bearish strength.
Aggregates scores for each currency based on multiple forex pairs.
Sorts currencies from strongest to weakest.
Displays results in a dynamically updated table.
Highlights the strongest and weakest currencies on the chart.
This tool helps traders identify potential trends and reversals in the forex market by visually comparing currency strengths in real-time.

Engulfing CandlesHighlights candles where both the High and Low of the previous candle were traded through.


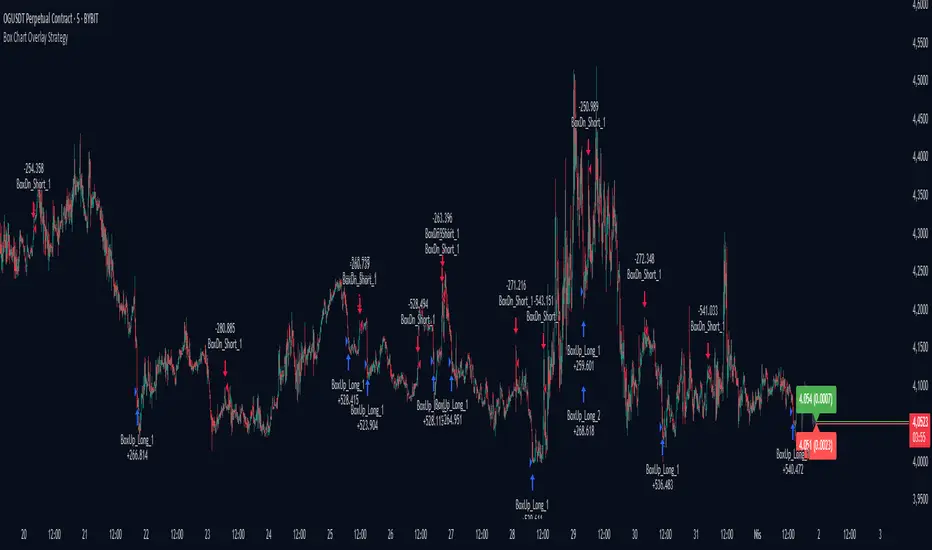
Box Chart Overlay StrategyExploring the Box Chart Overlay Strategy with RSI & Bollinger Confirmation
The “Box Chart Overlay Strategy by BD” is a sophisticated TradingView strategy script written in Pine Script (version 5). It combines a box charting method with two widely used technical indicators—Relative Strength Index (RSI) and Bollinger Bands—to generate trade entries. In this article, we break down the strategy’s components, its logic, and how it visually represents trading signals on the chart.
1. Strategy Setup and User Inputs
Strategy Declaration
At the top of the script, the strategy is declared with key parameters:
Overlay: The indicator is plotted directly on the price chart.
Initial Capital & Position Sizing: It uses a simulated trading account with an initial capital of 10,000 and positions sized as a percentage of equity (10% by default).
Commission: A commission of 0.1% is factored into trades.
Input Parameters
The strategy is highly customizable. Users can adjust various inputs such as:
Box Settings:
Box Size (RSboxSize): Defines the size of each price “box.”
Box Options: Choose from three modes:
Standard: Boxes are calculated continuously from the start of the chart.
Anchored: The first box is fixed at a specified time and price.
Daily Reset: The boxes reset each day based on a defined session time.
Color Customizations:
Options to customize the appearance of boxes, borders, labels, and even repainting the candles based on the current price’s relation to box levels.
RSI Settings:
Length, overbought, and oversold levels are set to filter trades.
Bollinger Bands Settings:
Users can set the length of the moving average and the multiplier for standard deviation, which will be used to compute the upper and lower bands.
2. The Box Chart Mechanism
Box Construction
The core idea of a box chart is to group price movement into discrete blocks—or boxes—of a fixed size. In this strategy:
Standard Mode:
The script calculates boxes starting at a rounded price level. When the price moves sufficiently above or below the current box’s boundaries, a new box is drawn.
Anchored and Daily Reset Modes:
These modes allow traders to control where the box calculations begin or to reset them during a specific intraday session.
Visual Elements
Several custom functions handle the visual components:
drawBoxUp() and drawBoxDn():
These functions create boxes in bullish or bearish directions respectively, based on whether the price has exceeded the current box’s high or low.
drawLines() and drawLabels():
Lines are drawn to extend the current box levels, and labels are updated to display key levels or the “remainder” (the difference needed to trigger a new box).
Projected Boxes:
A “projected” box is drawn to indicate potential upcoming box levels, providing an additional visual cue about the price action.
3. Integrating RSI and Bollinger Bands for Trade Confirmation
RSI Integration
The strategy computes the RSI using a user-defined length. It then uses the following conditions to validate entries:
Long Trades (Box Up):
The strategy waits for the RSI to be at or below the oversold level before considering a long entry.
Short Trades (Box Down):
It requires the RSI to be at or above the overbought level before triggering a short entry.
Bollinger Bands Confirmation
In addition to the RSI filter:
For Long Entries:
The price must be at or below the lower Bollinger Band.
For Short Entries:
The price must be at or above the upper Bollinger Band.
By combining these filters with the box breakout logic, the strategy aims to enhance the quality of its trade signals.
4. Dynamic Trade Entries and Alerts
Box Logic and Entry Functions
Two key functions—BoxUpFunc() and BoxDownFunc()—handle the creation of new boxes and also check if trade conditions are met:
When a new box is drawn, the script evaluates if the RSI and Bollinger conditions align.
If conditions are satisfied, the script places an entry order:
Long Entry: Initiated when the price moves upward, RSI indicates oversold, and the price touches or falls below the lower Bollinger Band.
Short Entry: Triggered when the price falls downward, RSI signals overbought, and the price touches or exceeds the upper Bollinger Band.
Alerts
Built-in alert functions notify traders when a new box level is reached. Users can set custom alert messages to ensure they are aware of potential trade opportunities as soon as the conditions are met.
5. Visual Enhancements and Candle Repainting
The script also includes options for repainting candles based on their relation to the current box’s boundaries:
Above, Below, or Within the Box:
Candles are color-coded using user-defined colors, making it easier to visually assess where the price is in relation to the box levels.
Labels and Lines:
These continuously update to reflect current levels and provide an immediate visual reference for potential breakout points.
Conclusion
The Box Chart Overlay Strategy by BD is a multi-faceted approach that marries the traditional box chart technique with modern technical indicators—RSI and Bollinger Bands—to refine entry signals. By offering various customization options for box creation, visual styling, and confirmation criteria, the strategy allows traders to adapt it to different market conditions and personal trading styles. Whether you prefer a continuously running “Standard” mode or a more controlled “Anchored” or “Daily Reset” approach, this strategy provides a robust framework for integrating price action with momentum and volatility measures.
Central Bank VolitilityIntroducing the Central Bank Volatility (CBV) Indicator
The CBV indicator is a custom-designed tool that capitalizes on the unique volatility spikes often triggered by central bank manual interventions. By isolating and visualizing these abrupt fluctuations, CBV provides traders with enhanced insight into market dynamics and potential reversal points—much like how the Average True Range (ATR) functions, but with a specific focus on intervention-induced volatility.
How It Works
Central banks, when they intervene manually in the market, often cause rapid and unexpected price shifts. These shifts create short-term spikes in volatility as market participants quickly adjust their expectations and portfolios. CBV measures these disturbances by calculating a "true range" similar to the ATR methodology:
True Range (TR):
TR = max(High − Low, |High − Previous Close|, |Low − Previous Close|)
Average True Range (ATR):
ATR = (Previous ATR × (n − 1) + TR) / n
where n is the period over which the volatility is smoothed.
While ATR provides a smoothed measure of general market volatility, CBV is tuned to detect and emphasize the volatility that arises specifically around central bank interventions. This targeted approach helps highlight the “surge” in market activity that occurs when policy actions send strong signals to investors.
Why CBV Capitalizes on Central Bank Volatility
Detection of Reversal Points: The CBV indicator is particularly effective at revealing levels where volatility significantly increases. Such levels often correspond to the moments when central bank actions inject uncertainty into the market. These volatility spikes can serve as early-warning signals, helping traders anticipate potential market reversals. As volatility increases around these critical levels, the CBV indicator visually highlights them, alerting traders to the possibility that a temporary surge in risk may precede a reversal in market direction.
Enhanced Visualization: By focusing on intervention-induced volatility, CBV presents a clearer picture of market behavior during periods of central bank activity. It filters out the noise of regular market fluctuations and emphasizes the spikes associated with policy moves. This visualization aids traders in recognizing abnormal market conditions—similar to how Bollinger Bands widen when volatility rises—thereby facilitating timely adjustments in trading strategies.
Risk Management: Understanding when volatility is heightened around central bank intervention levels allows traders to better manage risk. CBV provides an actionable metric that signals when to be more cautious or when to expect a reversal, thereby offering a strategic advantage in timing entry and exit points.
Conclusion
The Central Bank Volatility (CBV) Indicator is a powerful tool for traders seeking to exploit the market turbulence generated by central bank interventions. By utilizing a methodology akin to the Average True Range—with TR defined as max(High − Low, |High − Previous Close|, |Low − Previous Close|) and ATR computed as (Previous ATR × (n − 1) + TR) / n—CBV focuses specifically on the volatility spikes associated with policy actions. This focused approach not only provides clearer insights into market reversals but also enhances risk management by alerting traders to critical levels where rapid re-pricing occurs.

Mingo ZaZaZu PRO v3 (Persistent Trade)🧠 What It Does
The Mingo ZaZaZu PRO v3 is an advanced price action + smart filter trading assistant for manual or semi-automated trading. It helps identify high-probability buy/sell setups using swing zones, volume, FVGs, trend filters, and more — while visually guiding you with zones, trade status, multi-level TP targets, and alerts.
It’s built for zone-based traders, especially those who follow supply & demand, sniper, or ICT-style strategies.
🚀 Key Features
🔍 1. Zone Detection
Detects swing highs/lows as potential Sell/Buy zones
Auto-draws zone boxes on chart (with color and shading)
Uses zoneLength to control how far back to check for swing pivots
✅ 2. Smart Trade Confirmation
A signal is only triggered when multiple conditions align:
Price enters a valid buy/sell zone
Candlestick confirms reversal (wick/body ratio)
Optional filters:
📦 Fair Value Gap alignment
💣 Volume spike confirmation
📈 EMA 200 trend filter
🧠 3. Persistent Trade Logic
Once a trade is detected, the script remembers the trade:
Entry
Stop-loss (SL)
Take-profits (TP1, TP2, TP3)
Zones and TP/SL levels stay visible
Displays a summary label with trade details
💬 4. Dynamic Status System
Shows what’s happening in real-time:
“✅ BUY Signal Confirmed”
“☑️ Buy Trade Active (Still in Zone)”
“📤 Left Zone - Wait” or “🔁 Reentry Possible”
“⏳ Cooldown Active”
“📊 Waiting for Zone”
🧭 5. Re-entry Logic
If price leaves the zone but hasn't hit TP1 or SL, it can suggest re-entry opportunities
🎯 6. Multi Take-Profit Levels
Automatically calculates and draws:
TP1 (e.g., RR 1.0)
TP2 (e.g., RR 1.5)
TP3 (e.g., RR 2.0)
All based on Risk:Reward from Entry to SL
🔔 7. Built-in Alerts
Get notified for:
Entry signals
Entry into zones
TP1 hit
SL hit
Works with TradingView alerts
⚙️ How It Works (Internals)
Swing Detection:
Identifies local highs/lows using ta.highestbars() or ta.lowestbars()
Zone Creation:
Creates shaded zones above/below swing points
Buy zone: bottom half of swing low
Sell zone: top half of swing high
Entry Validation:
Must be in the zone
Must pass confirmation logic (strict or simple)
Must pass optional filters (FVG, volume, EMA trend)
Must pass cooldown timer
Trade Setup:
Once confirmed, draws:
TP lines
SL level
Entry level
Label with info
Persistent State:
Remembers SL and TP from last signal
Tracks current trade status (active/inactive)
Reentry opportunities based on if price leaves zone but doesn’t hit TP or SL
Status Label:
Dynamically updates with current trade state or signal state
Alerts:
Custom messages for TradingView alerts at key events
🧩 Ideal For:
Traders who want clear visual setups
Swing, sniper, or smart money concepts
Traders using manual entry based on high-quality zones
People who want clean, informative charts with alerts

SFT VIP Indicator @Garry195This indicator generetes signal for Buy and Sell, identified potentially trending move
buy denotes Long entry, Sell denotes short entry. Use 15 Min for Signal and use 5 min timeframe for entry and exit

Breaking Structures (javieresfeliz)This TradingView script is designed to identify market structure changes, using a break of highs and lows approach, as well as technical indicators such as ATR, RSI, and EMAs (Exponential Moving Averages). It is aimed at detecting bullish and bearish trends, signaling possible entry and exit points based on various factors. It also offers additional confirmations to avoid false signals and provides a clear visualization of buy and sell signals.
Main Features:
Indicators Used:
ATR (Average True Range): Used to calculate a volatility range, which helps set stop-loss levels and price targets based on the current market volatility.
EMAs (50 and 200): Exponential Moving Averages (EMAs) are used to determine the short-term and long-term trends. The 50-period EMA is used to identify the short-term trend, while the 200-period EMA is used to identify the long-term trend.
RSI (Relative Strength Index): Used to identify overbought or oversold conditions in the market, providing additional buy or sell signals.
Volume: Used to confirm the validity of a signal. An increase in volume can confirm a structure break and provide more reliability to the signal.
Break of Structure Detection (BOS):
Bullish Break: Generated when the price surpasses previous highs.
Bearish Break: Generated when the price falls below previous lows.
Change of Character (CHOCH):
Bullish Trend: Defined by a close above the open and above the 50 EMA.
Bearish Trend: Defined by a close below the open and below the 50 EMA.
Buy and Sell Conditions:
Buy (Long): Activated when several conditions are met, including a bullish change of character, a bullish structure break, the price closing above the previous value plus a multiple of the ATR, and additional confirmations from RSI and volume.
Sell (Short): Activated when several conditions are met, including a bearish change of character, a bearish structure break, the price closing below the previous value minus a multiple of the ATR, with additional confirmations from RSI and volume.
Entry and Exit Signals:
Long Entry (Buy): Executed when the buy conditions are met.
Short Entry (Sell): Executed when the sell conditions are met.
Position Close: Positions are closed when the price crosses below (for long positions) or above (for short positions) the 50 EMA.
Historical Highs and Lows Lines:
The script draws lines of historical highs and lows from the last 288 and 60 periods to show key support and resistance levels on the chart.
Signal Table Across Multiple Timeframes:
The script displays a table in the top-right corner of the chart with indicators like the EMA trend, RSI value, and MACD histogram for timeframes of 1 minute, 5 minutes, 30 minutes, 1 hour, 4 hours, daily, and weekly.
Precautions:
Does not guarantee profits: Although the script is designed to detect structure breaks and possible trend changes, it does not guarantee 100% profitable signals. The market is always subject to risk and unpredictable volatility.
Requires adjustments for each asset: Parameters such as ATR length and EMA lengths should be adjusted according to the asset being analyzed and market conditions.
Use of additional confirmations: To reduce false signals, the script uses additional confirmations like RSI and volume, but it is always recommended to perform additional analysis before making trading decisions.
Changing trends: The change of character (CHOCH) can be a useful indicator, but it can give false signals in highly volatile markets or during prolonged consolidations.
Relies on historical data: This script relies on historical data to identify highs and lows. It does not consider fundamental events that may significantly impact the market.
Requires constant monitoring: Although the signals are automated, it is important to monitor open positions and make adjustments if market conditions change.
Risk of false signals: In low liquidity markets or consolidations, structure breaks can be false, so it’s recommended to pay attention to any additional confirmation signals or use a proper risk management strategy.
MarketLuminaMarketLumina: A Comprehensive Technical Analysis Tool
MarketLumina is a technical analysis indicator crafted by a team of traders and developers in Germany. Built for TradingView’s Pine Script, it integrates trend visualization, signal generation, and real-time market insights to provide a multifaceted view of market conditions. This tool is designed to support traders in analyzing trends, spotting potential reversals, and evaluating market dynamics across various timeframes.
The best way to get started with MarketLumina is to take your time exploring its wide range of features. Dive in, experiment, and find the 2-3 tools that feel just right for you. Whether you’re a day trader looking for quick signals, a swing trader tracking trends, or an investor watching the bigger picture, MarketLumina lets you pick and choose what works best. Over time, you’ll craft your own unique trading strategy, perfectly tailored to your goals, preferences, and risk tolerance.
Key Features
Fibonacci Trend-Cloud
Displays market direction through Fibonacci-weighted moving averages. The cloud’s color—green (bullish), red (bearish), or yellow (caution)—reflects prevailing conditions, while its width indicates trend intensity.
Advanced Signal System
Generates signals derived from RSI, momentum, volume, money flow, volatility, price action, divergences, specific cloud-interactions, divergences and historical data. Signal categories include strong reversals, potential reversals, short-term tops/bottoms, strong trend, oversold/overbought conditions, exit signals, and money flow strategy triggers.
LuminaPulse – Real-Time Market Insight
A proprietary module that delivers real-time market analysis through a dashboard of six progress bars, each tailored to the symbol and timeframe using a machine learning approach. It screens historical data—key levels, consolidation zones, volatility spikes, and past price reactions—to optimize insights.
Support & Resistance Zones
Highlights critical price levels using volume-weighted historical data and price-action pivot points.
Candlestick-Overlay
Applies color coding to candlesticks—green (bullish), red (bearish), yellow (caution)—to emphasize signal-relevant bars.
Usage Instructions
MarketLumina is intended as a component of a broader analytical framework.
Below are general guidelines for its application:
Multi-Timeframe Analysis
Align signals with trends on higher timeframes for context.
LuminaPulse Interpretation
Evaluate confluence across trend strength, momentum, money flow, and volume to assess market conditions. Additionally, monitor squeeze conditions for potential breakout signals and volatility to gauge market activity.
Trend-Cloud Context
Use the Fibonacci Trend-Cloud’s direction and width as a filter for signal relevance.
Usage Instructions for MarketLumina’s Advanced Signal System
The Advanced Signal System is a core component of MarketLumina, designed to empower traders by generating a variety of signals derived from RSI, momentum, volume, money flow, volatility, divergences, price action, and more. These signals are organized into distinct categories to help you identify key market conditions and uncover potential trading opportunities.
Below is a comprehensive guide to each signal category, including descriptions, interpretations, and practical applications to enhance your trading decisions:
Strong Reversals
Reversal Signals are generated using a complex price action and volatility algorithm, pinpointing significant potential turning points in the market with elevated confidence.
How to Use:
Look for these signals near critical support or resistance levels, especially when supported by the Fibonacci Trend-Cloud or LuminaPulse metrics.
Treat them as powerful reversal cues when they align with overarching market trends or follow prolonged price movements.
Interpretation:
A bullish Reversal signal flags a strong probability of an upward reversal, often in oversold conditions, suggesting a shift to bullish momentum.
A bearish Reversal signal points to a likely downward reversal, typically in overbought scenarios, indicating bearish potential.
Their reliability increases with confluence factors like divergences or a notable shift in money flow.
Potential Reversals
These signals flag possible trend continuation after a pullback based on price action, RSI thresholds and specific trend-cloud interaction, offering early insights with moderate certainty compared to strong reversals.
How to Use:
Use them as preliminary alerts for potential reversals of a pullback continuing its trend, particularly near support or resistance zones.
Validate their strength with additional tools like the Trend-Cloud thickness or LuminaPulse to gauge reliability.
Interpretation:
Bullish potential reversals hint at the onset of an upward move, while bearish ones suggest a downward continuation may be brewing.
Ideal for spotting early opportunities, these signals gain credibility when paired with confirming indicators.
Short-Term Tops/Bottoms
These signals mark temporary price extremes, identifying short-term tops or bottoms within a trend, driven by Multi-RSI algorithms.
How to Use:
In trending markets, leverage these signals to anticipate brief pullbacks or corrections within the dominant direction.
In range-bound markets, use them to pinpoint reversal points within the established range.
Interpretation:
A short-term top indicates a temporary possible high, offering opportunities to lock in profits or brace for a dip.
A short-term bottom suggests a fleeting low, signaling a potential bounce or recovery within the larger trend.
Oversold/Overbought Conditions
This category highlights extreme market states with oversold/overbought conditions, derived from RSI and price action.
How to Use:
In strong trends, these signals affirm the likelihood of potential temporary exhaustion.
In weaker trends, they signal potential exhaustion and could early indicate reversals.
Interpretation:
Oversold signals in strong trends could mark a short-term break or slower trend continuation and should not be interpreted as a reversal signal.
Strong Trend
These signals flag possible trend continuation based on six key metrics—RSI, Money Flow, Momentum, and more—align to confirm robust momentum.
How to Use:
In strong trends, these signals affirm the likelihood of a continuation.
Interpretation:
Strong trend signals could be interpreted as a confirmation of the bullish movement and a possible continuation.
Money Flow Strategy Triggers
Built on money flow analysis, these signals track capital inflows and outflows on multiple timeframes to reveal shifts in buying or selling pressure, offering a window into market sentiment.
How to Use:
Deploy these triggers to refine entry or exit timing, especially when they sync with other signals and the Trend-Cloud’s direction.
Pair them with LuminaPulse’s Money Flow, Momentum and volume sentiment for a deeper understanding of market participation.
Interpretation:
Positive money flow triggers indicate rising buying pressure, often a precursor to upward price action.
Negative money flow triggers signal increasing selling pressure, potentially foreshadowing a downturn.
Their value shines when diverging from price action, exposing hidden strength or weakness in the market.
Usage Instructions for LuminaPulse
LuminaPulse is a standout feature of MarketLumina, delivering real-time insights into market conditions through a sophisticated, machine-learning-driven approach. It analyzes historical data unique to each symbol and timeframe—examining past key levels, consolidation zones, volatility spikes, and price reactions—to create a dashboard of six progress bars.
These bars represent the strength of critical market factors:
Money Flow
Momentum
Volume
Strength (Trend Strength)
Squeeze
Volatility
Each bar is color-coded—green for bullish conditions, red for bearish—and its fill level reflects the factor’s strength relative to historical patterns. A fully loaded bar suggests a high likelihood of a notable price reaction, based on how the market has responded to similar conditions in the past. What makes LuminaPulse unique is its ability to tailor these insights to the specific symbol and timeframe, going beyond raw metrics to show their historical significance.
Additionally, each bar features a "Ghost-Progress" overlay, marking the highest strength level reached in the current trend. This allows you to see whether the current strength is nearing or retreating from recent peaks, adding depth to your analysis.
How to Use LuminaPulse
LuminaPulse is a confirmation tool, not a standalone signal generator. It shines when paired with other MarketLumina features, like the Fibonacci Trend-Cloud or Advanced Signal System, as part of a broader trading strategy.
Here’s how to apply it effectively:
Seek Confluence
Check for alignment across multiple bars. For example, if Money Flow, Momentum, and Volume are all green and highly filled, it could indicate strong bullish potential.
Spot Divergences
Look for mismatches between price action and the bars. If price rises but Momentum weakens, it might hint at a fading trend.
Monitor Squeeze: A fully loaded Squeeze bar signals consolidation and potential volatility ahead. Use other tools to predict the breakout direction.
Assess Volatility: The Volatility bar sets the context—high levels suggest bigger price swings, while low levels indicate a calmer market.
Interpreting Each Progress Bar
1. Money Flow
Measures the strength of money flowing into or out of the market, compared to historical thresholds, key-levels and past price reactions, using a machine learning approach, tailored to the symbol and timeframe. It’s not just the raw money flow index—it’s the likelihood of a price move based on historical similar money flow movements.
How to Use:
Look for a fully loaded bar alongside a strong Momentum bar near key levels or signals.
Watch for a bar switching colors (e.g., red to green) with a robust Momentum bar for potential trend shifts.
Treat it as the fuel behind price moves, not the absolute flow level.
Interpretation:
A fully loaded green bar suggests strong buying pressure; a red bar indicates selling pressure.
Divergence (e.g., price up, Money Flow down) can signal an impending reversal—confirm with other tools.
2. Momentum
Gauges the strength and direction of price momentum, factoring in historical key levels, volatility, and past reactions, optimized by a machine learning approach, tailored to the symbol and timeframe. It reflects momentum’s strength and potential impact, not just its current state.
How to Use:
Pair a fully loaded bar with a strong Money Flow bar near signals or key levels.
A switching bar (e.g., bearish to bullish) with a solid Money Flow bar may hint at a trend change.
View it as the driving force behind price momentum.
Interpretation:
A fully loaded green bar signals powerful upward momentum; a red bar shows downward force.
Divergence from price action (e.g., price down, Momentum up) can be a reversal clue—verify with confluence.
3. Volume
Shows whether volume is pushing price up or down, based on historical patterns and key levels near the current price, tailored to the symbol and timeframe.
How to Use:
Look for a bar over 50% filled, aligned with Money Flow and Momentum, near signals or key levels.
Combine a strong bar with a fully loaded Squeeze bar for breakout potential.
See it as the muscle behind buying or selling pressure.
Interpretation:
A green bar over 50% suggests volume supports upward moves; a red bar indicates downward pressure.
Alignment with other bars near support/resistance can confirm breakouts or rejections.
4. Strength (Trend Strength)
Focuses on the current trend’s robustness, comparing it to historical price movements, trend direction, and volatility. It helps spot pullbacks or early trend-shift warnings.
How to Use:
Watch for a fully loaded bar opposite your trade, paired with weakening Money Flow or Momentum, as an exit cue.
For reversals, confirm a fully loaded bar with at least two other aligned bars.
Use it to gauge the power of short-term price action.
Interpretation:
A fully loaded bar with supporting bars confirms trend strength.
A dropping bar as price tests key levels may signal a pullback or shift—check support/resistance.
5. Squeeze
Highlights consolidation and building pressure from buyers and sellers, suggesting a big move ahead. Its color reflects the trend but isn’t a reliable directional guide.
How to Use:
A fully loaded bar signals an imminent breakout—use other indicators for direction.
Pair with strong Strength and Volume for timing confirmation.
Treat it as a timing tool, not a directional one.
Interpretation:
A fully loaded bar means a significant move is likely, but not where it’s headed.
Use it to prepare for action, not to predict the outcome—direction comes from confluence.
6. Volatility
Measures current volatility relative to historical levels, using a machine learning approach to analyze past volatility and duration patterns specific to the symbol and timeframe. A calm bar might still appear during big swings if that’s normal for the asset or a calm bar could appear after a big move if it's normal for the asset to show single volatility spikes with consolidation afterwards.
How to Use:
Use a high Volatility bar (fully loaded) to favor short-term trades; a low bar (empty) suggests a quieter market.
Pair with Squeeze to anticipate breakout strength.
Adjust your strategy based on the market’s activity level.
Interpretation:
A fully loaded bar signals high volatility and bigger swings; an empty bar indicates low volatility and smaller moves.
Context is key—high volatility for one symbol might be calm for another, based on its history.
Key Features of LuminaPulse
Tailored Insights: Each bar’s strength is customized to the symbol and timeframe’s historical behavior, making it uniquely relevant.
Ghost-Progress: See the peak strength in the current trend, helping you judge if conditions are peaking or fading.
Individual-Adapting Edge: Algorithms adapt to historical data, ensuring insights reflect past reactions, not just current values.
Important Notes
LuminaPulse is a complex, unique tool designed to enhance your analysis, not dictate trades. Its strength lies in its historical context and real-time adaptability, but it’s most effective when combined with other MarketLumina features and your own strategy.
Illustrative Scenarios
Trend Continuation Example
Picture a market where momentum is steadily building. The Fibonacci Trend-Cloud turns red across both the primary and higher timeframes, reflecting a strong bearish direction. As this trend takes shape, reversal or strategy-based signals begin to line up with the cloud’s downward tilt, hinting at sustained weakness. Short-term bottoms and tops might start forming, offering clues about the trend’s rhythm, while a widening cloud could suggest growing confidence in the move. This setup showcases how the indicator can highlight a trend gathering steam, with multiple features reinforcing the direction.
Reversal Example
Imagine a market that’s been rising but approaches a key support zone. Suddenly, strong reversal signals flash on the chart, catching attention near this critical level. Price action starts to stabilize or reject, while LuminaPulse metrics show a subtle uptick in momentum or a shift in volume sentiment. As the market tests this zone, opposing signals fade, and the potential for a downward turn becomes clearer. This scenario illustrates how the indicator’s signals and metrics can converge to spotlight a possible shift in direction.
Pullback Analysis Example
Consider a strong bullish trend unfolding on the higher timeframe, painting a broad picture of upward movement. Zooming into the lower timeframe, a brief retracement emerges, pulling price back toward a support level. Here, strategy-based or reversal signals might pop up, marking this as a key area to watch. LuminaPulse could reveal a slowdown in downward momentum or a tightening of trend strength, suggesting the retracement might be running out of energy. This example demonstrates how the indicator can help dissect a pullback, revealing opportunities within an ongoing trend.
Range-Bound Market Example
Envision a market stuck in a sideways drift, with the Fibonacci Trend-Cloud narrowing and turning yellow—a sign of consolidation. Reversal signals begin appearing near support and resistance zones, hinting at potential bounces within the range. LuminaPulse metrics might spike, showing bursts of volatility or squeeze conditions building up. As price nears these boundaries, the chance of a breakout looms, with retests of the zones offering further clarity. These examples show how MarketLumina’s features—like the cloud’s color and width, signal alignments, and LuminaPulse shifts—can work together to illuminate market dynamics. Whether it’s a trend gaining traction, a reversal brewing, a pullback pausing, or a range tightening, the indicator provides visual and analytical cues to explore. By watching how these elements evolve, you can get a feel for the market’s rhythm and sharpen your understanding of what to look for in different situations.
Legal Notices
MarketLumina is a technical analysis tool, not a substitute for professional financial advice.
Trading carries inherent risks; past performance does not guarantee future outcomes.
All content is provided for educational purposes only and does not constitute trading recommendations. Users bear full responsibility for their trading decisions and are urged to prioritize robust risk management.

0900/1500 UTC-4 Body Marker
User Manual: 0900/1500 UTC-4 Body Marker Indicator
Introduction
Purpose of the Indicator:
The 0900/1500 UTC-4 Body Marker Indicator highlights candles at 09:00 AM and 03:00 PM (UTC-4) to assist traders in analyzing key market times.
09:00 AM ET is significant for pre-market trends, while 03:00 PM ET marks the final hour of the U.S. stock market session.
YOU WILL FIND THE FULL USERS MANUAL IN THE PINE EDITOR.
YOU MAY NOT USE ANY PART OF THIS CODE AND MONETIZE IT.
YOU MAY HOWEVER USE ANY AND ALL TO MAKE IT BETTER AND AVAILABLE FOR ALL TO USE.
REMEMBER.....WERE ALL IN THIS THING TO MAKE MONEY TOGETHER.
NO ONE SHOULD THINK THEY HAVE THE RIGHT AND OWNERSHIP TO THE "HOLY GRAIL"

FusionXcel Signal TestTrend-based Demand & Supply with Trendlines:
Demand Zones: Areas where buying pressure is high (price tends to rise).
Supply Zones: Areas where selling pressure is high (price tends to fall).
Trendlines: Lines drawn to connect higher lows (uptrend) or lower highs (downtrend), helping to identify the overall market direction.
Psychological analytics

Hourly Open Marker [fdx9]Hourly Open Marker
The Hourly Open Marker is a simple yet effective TradingView indicator designed to highlight the opening price of each new hourly candle. By automatically plotting a horizontal line at the start of every hour, this tool helps traders visualize key price levels that may act as potential areas of support, resistance, or liquidity.
Features:
✅ Hourly Open Levels: Marks the open price of each hourly candle with a horizontal line.
✅ Clear & Non-Intrusive Display: Uses a solid pink line for easy identification without cluttering the chart.
✅ Dynamic Updates: Lines are added in real time as each new hourly candle forms.
Use Cases:
🔹 Intraday Trading: Helps traders track hourly price levels, which can be useful for scalping, ICT concepts, and price action analysis.

Multi-Timeframe Fair Value Gap (FVG)Multi-Timeframe Fair Value Gap (FVG) Indicator
Description
This indicator identifies and displays Fair Value Gaps (FVGs) across multiple timeframes simultaneously. A Fair Value Gap occurs when price moves so quickly that it leaves behind an area where no actual trading has taken place. These areas often act as magnets for price to return to later, making them valuable for traders to identify potential support and resistance zones.
Key features:
·Support for up to 6 different timeframes simultaneously
·Customizable colors for each timeframe
·Option to display middle lines within FVGs
·Automatic FVG mitigation detection (by price or wick)
·Bullish and bearish FVGs clearly distinguished
·Highly customizable appearance
The indicator uses different colors for each timeframe, allowing you to easily distinguish between short-term and long-term FVGs. This makes it an excellent tool for multi-timeframe analysis and for identifying key areas where price might react.
How to Use
Add the indicator to your chart
·Configure the timeframes you want to monitor (default: 5m, 15m, 1h, 4h, Daily, Weekly)
·Customize colors for each timeframe if desired
·Choose between "Close" or "Wick" mitigation method
·Look for areas where multiple FVGs overlap - these often represent stronger zones
The indicator automatically tracks when an FVG has been filled (mitigated) and removes it from the chart. This keeps your analysis clean and focused on active, unfilled gaps that are still likely to affect price.
——————————————————————————————————————————————————————————
该指标可同时识别并显示多个时间周期的公允价值缺口(FVGs)。公允价值缺口发生在价格快速移动时,留下了一个没有实际交易发生的区域。这些区域通常会吸引价格稍后回归,使它们成为交易者识别潜在支撑和阻力区域的有价值工具。
主要特点:
·同时支持多达6个不同的时间周期
·每个时间周期可自定义颜色
·可选显示FVG内的中线
·自动检测FVG的填补(通过收盘价或影线)
·清晰区分看涨和看跌的FVG
·高度可定制的外观
注意:此版本为单次缓解版本,FVG只要被触碰到1次就会被缓解,不会等待fvg完全穿越才缓解

Doji Finder - Doji BulucuEnglish;
A Doji is a candlestick pattern where the opening and closing prices are very close to each other, and this code detects such candles, marking them on the chart and drawing lines. Here’s a step-by-step explanation of how the code works:
User Input:
Doji Ratio: The user can adjust the Doji ratio (default 10%). This ratio is the difference between the opening and closing prices relative to the candle range (high - low). A smaller value means a stricter Doji definition.
Doji Detection:
It checks whether a candle is a Doji. If the difference between the opening and closing prices is less than the candle range (high - low) multiplied by the dojiRatio, the candle is considered a Doji.
Line Drawing:
Horizontal lines are drawn at the high (red), low (green), and mid (blue) levels of each Doji candle. These lines extend to the next Doji candle or the current bar (if it’s the last Doji).
Doji Marking:
Doji candles are marked on the chart with small yellow triangles (optional).
Turkish;
Doji, bir mum çubuğunun açılış ve kapanış fiyatlarının birbirine çok yakın olduğu bir formasyondur ve bu kod, bu tür mumları tespit ederek grafikte işaretler ve çizgiler çizer. İşte kodun nasıl çalıştığına dair adım adım açıklama:
Kullanıcı Girdisi:
Doji Ratio: Kullanıcı, Doji oranını (varsayılan %10) ayarlayabilir. Bu oran, açılış ve kapanış farkının mum aralığına (yüksek - düşük) oranıdır. Küçük bir değer, daha katı bir Doji tanımı anlamına gelir.
Doji Tespiti:
Bir mumun Doji olup olmadığını kontrol eder. Eğer açılış ve kapanış arasındaki fark, mum aralığının (high - low) dojiRatio ile çarpımından küçükse, bu mum bir Doji olarak kabul edilir.
Çizgi Çizimi:
Her Doji mumunun yüksek (kırmızı), düşük (yeşil) ve orta (mavi) seviyelerinde yatay çizgiler çizilir. Bu çizgiler, bir sonraki Doji mumuna veya mevcut bara (son Doji ise) kadar uzanır.
Doji İşaretleme:
Doji mumları, grafikte küçük sarı üçgenlerle işaretlenir (isteğe bağlı).

Treasuries & VIX Monitor📊 Treasuries & VIX – Breakout Monitor Panel (TradingView)
This Pine Script (@version=6) creates a real-time monitoring panel on your TradingView chart, designed to track key US Treasury yields and the market volatility index (VIX).
✅ Assets Monitored:
VIX (CBOE:VIX) – The volatility index of the S&P 500 (featured at the top of the table for priority).
2-Year Treasury Yield (TVC:US02Y)
5-Year Treasury Yield (TVC:US05Y)
10-Year Treasury Yield (TVC:US10Y)
30-Year Treasury Yield (TVC:US30Y)
Treasury Bond ETF (NASDAQ:TLT)
📌 What the panel shows for each asset:
% Change from the daily open.
Day Signal: An intuitive emoji indicating if the asset is up (⬆️), down (🔻), or unchanged (➖).
Breakout Status: Indicates whether the current price has broken above or below the previous 5-minute candle's high or low.
Suggested Action: A simple “Buy”, “Sell” or neutral signal based on the breakout condition.
RSI Value (14-period): To provide an overbought/oversold indication.
🎨 Visuals & UI:
Color gradients show strength and direction of price moves.
RSI values are color-coded (e.g., red if overbought, blue if oversold).
Table position can be customized via input settings (e.g., top-right, center, bottom-left, etc.).

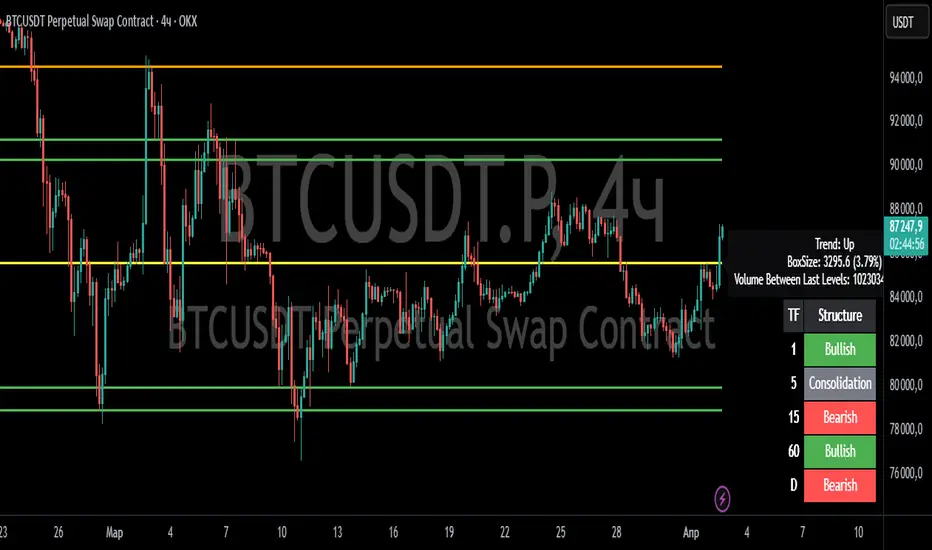
Renko SR VolumeDaily ATR Renko SR Levels with Volume Analysis is a technical indicator that combines Renko-based support/resistance levels with volume analysis. It dynamically calculates Renko boxes using the ATR (Average True Range) of daily data and identifies key price levels. The indicator:
- Uses daily ATR to determine Renko box size.
- Draws support/resistance levels based on Renko price structure.
- Analyzes volume between levels to assess their strength.
- Colors levels based on relative volume activity:
- Red – strongest level (high volume activity).
- Orange – strong level.
- Yellow – moderate level.
- Green – weakest level (low volume activity).
- Detects daily Renko-based trends.
This tool helps traders visualize key price zones with volume confirmation, improving decision-making in trend and range markets.