malama's volume spikeThe "malama's volume spike" indicator identifies and highlights bars where the trading volume significantly exceeds the average, signaling potential market interest or activity. It calculates a Simple Moving Average (SMA) of the volume over a user-defined period and compares the current volume against this average multiplied by a specified threshold factor. Bars where the volume surpasses this threshold are colored yellow on the chart, providing a visual cue for traders to identify potential trading opportunities.
How It Works:
Volume Moving Average (SMA): The indicator computes the SMA of the volume over a period defined by the user (default is 20 bars).
Threshold Calculation: It multiplies the SMA by a user-defined factor (default is 2.0) to set the volume spike threshold.
Volume Spike Detection: If the current volume exceeds this threshold, the corresponding bar is highlighted in yellow.
Usage:
Volume MA Length: Adjust this parameter to set the period over which the volume SMA is calculated. A shorter length responds more quickly to recent volume changes, while a longer length smooths out short-term fluctuations.
Volume Threshold Factor: Modify this factor to set the sensitivity of the volume spike detection. A lower value will highlight more bars, while a higher value will highlight fewer, more significant spikes.
Candlestick analysis

Important Levels (Arabic Version)Important Levels (Arabic Version)
All-in-One Market Context Indicator
This indicator highlights key technical levels to guide your trading decisions with confidence and clarity. It includes:
✅ Dynamic Daily, Weekly, and Monthly Highs & Lows
Clearly labeled price levels to help you identify support/resistance zones at a glance.
✅ Fixed 200 & 50 EMAs from the current chart and external tickers
View essential trend indicators with customizable colors for both daily and hourly resolutions.
✅ Arabic Labels & Custom Transparency
Arabic-language support for all chart labels and the ability to control label visibility with transparency settings.
✅ Perfect for Technical Traders
Combine trend-following with level-based strategies — all in one compact, clean visual layout.

Full Custom Setup with Alerts🚀 Full Custom TradingView Setup — EMA + MACD + RSI + Volume with Smart Alerts
This script combines everything you need for a clean, alert-driven trading system:
EMA 9 / 21 / 50 / 200 for trend structure
MACD (6,13,5) to detect momentum shifts
RSI 6 / 12 / 24 to track overbought/oversold zones
Volume with MA5/MA10 and dynamic high-volume line
📈 Visual triangle markers for perfect entry setups
🔔 Alerts fire when all signals align for Long or Short trades
💡 Designed for both fast scalping and multi-timeframe swing trading.
Add it to your chart, set your alerts, and stay ahead of the market.
This is not financial advice. Use with your own risk management (Or better yet don't even use it)

Biais V1.0 [Gasppard]
This indicator follows the logic for determining the Daily bias in the video on the subject from the YouTube channel "Vizion."
Use with Daily candlesticks at the close of the candlestick to predict the target for the following day(s).
This indicator is not intended to be used as a standalone strategy; it exists solely to help determine the potential direction of the market in the near future.
-
Cet indicateur reprends la logique de détermination du biais Daily de la vidéo sur le sujet de la chaîne Youtube "Vizion".
À utiliser avec des bougies Daily à la clôture de ces dernières afin de prévoir la target pour le (ou les ?) jours suivants.
Cet indicateur n'a pas vocation à servir de stratégie à lui seul mais existe seulement pour aider à déterminer le sens potentiel du marché dans un futur proche.

Stop Loss / Take Profit Table // (\_/)
// ( •.•)
// (")_(")
Simple Take profit system
for Crypto , forex and stock .


Prior Day/Week/Month Key LevelsThe Prior Day/Week/Month Key Levels indicator provides a visual reference for key historical price levels, helping traders to identify potential areas of support and resistance. It plots horizontal lines for the previous period's high, low, and opening prices across daily, weekly, and monthly timeframes, updating dynamically as new periods begin. Additionally, the indicator features "wick boxes" based on 15-minute timeframe data that highlight significant intraday extremes, which may signal potential reversals or breakout areas. With a modern, minimalistic settings panel, users can customize colors, line styles, widths, and label positions, ensuring the tool seamlessly integrates with various charting styles and trading strategies.

ITACHI ExitHTC will have to get you up from the bottom is not going through all these questions can also provide us your thoughts

ITACHI ExitHitachi is the best thing to say is no longer available and if you are not going to have to do a few things for a while to

Estrategia de Bitcoin con 5 Rangos de Precio# 🚀 "Bitcoin Dynamic Ranges" Strategy 🚀
## Why will this strategy make you stand out in the market?
This revolutionary Bitcoin strategy combines **five specific price ranges** with **smart capital allocation** and an **automatic profit protection system**, designed to maximize your profits while reducing risk.
### ✅ Main Features:
1. **Inverse Capital Allocation** - Higher investment at low prices, lower at high prices:
- Lower ranges: 30% of your capital
- Intermediate ranges: 25%, 20%, 15%
- Higher ranges: only 10% of your capital
2. **Validation every 8 hours** - No need to be glued to the screen: the strategy automatically checks entry conditions three times a day.
3. **Smart Trailing Stop Loss** - Automatically protects your profits:
- Triggered when the price rises $5,000 above your entry point
- Dynamically adjusts as the price continues to rise
- Always maintains $1,000 as a safety margin
4. **Buy at Lows** - The strategy automatically identifies when the price falls below all your ranges, allowing you to buy at the best moments.
### 🔍 How does it work?
Imagine you buy Bitcoin at $50,000. When the price rises to $55,000, a stop loss is automatically triggered at $54,000. If the price continues to rise to $60,000, your stop loss is adjusted to $59,000, ensuring you capture at least $9,000 of profit, no matter what happens.
### 💰 Benefits:
- **Reduce risk** - Invest less capital at higher prices
- **Maximize profits** - Buy more when the price is low
- **Save time** - The strategy executes automatically
- **Preserves capital** - Trailing stop protects your profits
- **Fully customizable** - Adjust price ranges based on your market analysis
## 📊 Apply this strategy today and take your Bitcoin trading to the next level! 📊

PowerZone Trading StrategyExplanation of the PowerZone Trading Strategy for Your Users
The PowerZone Trading Strategy is an automated trading strategy that detects strong price movements (called "PowerZones") and generates signals to enter a long (buy) or short (sell) position, complete with predefined take profit and stop loss levels. Here’s how it works, step by step:
1. What is a PowerZone?
A "PowerZone" (PZ) is a zone on the chart where the price has shown a significant and consistent movement over a specific number of candles (bars). There are two types:
Bullish PowerZone (Bullish PZ): Occurs when the price rises consistently over several candles after an initial bearish candle.
Bearish PowerZone (Bearish PZ): Occurs when the price falls consistently over several candles after an initial bullish candle.
The code analyzes:
A set number of candles (e.g., 5, adjustable via "Periods").
A minimum percentage move (adjustable via "Min % Move for PowerZone") to qualify as a strong zone.
Whether to use the full candle range (highs and lows) or just open/close prices (toggle with "Use Full Range ").
2. How Does It Detect PowerZones?
Bullish PowerZone:
Looks for an initial bearish candle (close below open).
Checks that the next candles (e.g., 5) are all bullish (close above open).
Ensures the total price movement exceeds the minimum percentage set.
Defines a range: from the high (or open) to the low of the initial candle.
Bearish PowerZone:
Looks for an initial bullish candle (close above open).
Checks that the next candles are all bearish (close below open).
Ensures the total price movement exceeds the minimum percentage.
Defines a range: from the high to the low (or close) of the initial candle.
These zones are drawn on the chart with lines: green or white for bullish, red or blue for bearish, depending on the color scheme ("DARK" or "BRIGHT").
3. When Does It Enter a Trade?
The strategy waits for a breakout from the PowerZone range to enter a trade:
Buy (Long): When the price breaks above the high of a Bullish PowerZone.
Sell (Short): When the price breaks below the low of a Bearish PowerZone.
The position size is set to 100% of available equity (adjustable in the code).
4. Take Profit and Stop Loss
Take Profit (TP): Calculated as a multiple (adjustable via "Take Profit Factor," default 1.5) of the PowerZone height. For example:
For a buy, TP = Entry price + (PZ height × 1.5).
For a sell, TP = Entry price - (PZ height × 1.5).
Stop Loss (SL): Calculated as a multiple (adjustable via "Stop Loss Factor," default 1.0) of the PZ height, placed below the range for buys or above for sells.
5. Visualization on the Chart
PowerZones are displayed with lines on the chart (you can hide them with "Show Bullish Channel" or "Show Bearish Channel").
An optional info panel ("Show Info Panel") displays key levels: PZ high and low, TP, and SL.
You can also enable brief documentation on the chart ("Show Documentation") explaining the basic rules.
6. Alerts
The code generates automatic alerts in TradingView:
For a bullish breakout: "Bullish PowerZone Breakout - LONG!"
For a bearish breakdown: "Bearish PowerZone Breakdown - SHORT!"
7. Customization
You can tweak:
The number of candles to detect a PZ ("Periods").
The minimum percentage move ("Min % Move").
Whether to use highs/lows or just open/close ("Use Full Range").
The TP and SL factors.
The color scheme and what elements to display on the chart.
Practical Example
Imagine you set "Periods = 5" and "Min % Move = 2%":
An initial bearish candle appears, followed by 5 consecutive bullish candles.
The total move exceeds 2%.
A Bullish PowerZone is drawn with a high and low.
If the price breaks above the high, you enter a long position with a TP 1.5 times the PZ height and an SL equal to the height below.
The system executes the trade and exits automatically at TP or SL.
Conclusion
This strategy is great for capturing strong price movements after consolidation or momentum zones. It’s automated, visual, and customizable, making it useful for both beginner and advanced traders. Try it out and adjust it to fit your trading style!

RochitThe Rochit Singh Indicator is a technical analysis tool designed to help traders identify market trends, reversals, and potential entry or exit points. It combines multiple price action factors, momentum signals, and volatility metrics to provide a comprehensive view of market conditions. The indicator is tailored for various asset classes, including stocks, forex, and cryptocurrencies, making it a versatile addition to any trader’s toolkit.

Take&CloseA Hermes indicator to identify the candle that took the previous candle and closed after it.

Stop-Loss Buy Orderbuying and selling at a certain value to keep your portfolio never below a certain value. The idea is to make sure for example that if btc falls bellow 100k you sell, and if it goes up you buy. Never mind the small loss for each trade as you are selling fraction below 100k and buying at a 100k.

PKWPriceActionConceptsPrice action is a trading technique that involves analyzing the raw price movements of a security to make trading decisions, rather than relying on technical indicators or other factors. It's a form of technical analysis that focuses on understanding market behavior and potential trends by studying how prices have moved in the pas


Wick Sweep EntriesThis 2 Candle Setup is designed by Finweal Finance, This Setup suggests the HFT Setup for Instant entry on 5min candles.

Hossa OTF 4-candles"Hossa OTF 4-candles," overlays mini-representations of the higher timeframe candle on your current chart and displays a countdown timer showing how much time remains until that higher timeframe candle closes. Here’s how it works and how you might use it:
How It Works
Multi-Timeframe Display:
The indicator fetches the open, high, low, and close of a higher timeframe candle based on the timeframe you select (for example, 1H, 4H, 8H, 1D, or 1W). It then draws four mini-candles that update as new higher timeframe candles are formed.
Simple Stopwatch Countdown:
It retrieves the open time of the current higher timeframe candle and calculates its full duration (using the timeframe’s minutes converted to milliseconds). The indicator then subtracts the elapsed time from the total duration to show a countdown (formatted in hours and minutes) that tells you how long until the current candle closes.
How to Use It
Multi-Timeframe Analysis:
Use this indicator to see at a glance the status of the higher timeframe candle while you trade on a lower timeframe. For instance, if you're trading on a 5-minute chart but want to see what the 4-hour candle is doing, this indicator places a mini-representation of that 4-hour candle right on your chart.
Time-Based Entries/Exits:
The countdown helps you prepare for potential shifts in market sentiment as the higher timeframe candle closes. For example, if you notice a pattern or reversal setup on your lower timeframe near the end of the higher timeframe candle, it could signal an opportunity to enter or exit a trade.
Confluence with Other Indicators:
Combine this tool with other technical indicators (like RSI, MACD, or moving averages) to build a strategy. For instance, you might wait for a divergence on the lower timeframe as the higher timeframe candle nears its close, which can serve as an extra signal for a potential reversal or breakout.
Example Strategy
Trend Confirmation:
Suppose the 4-hour candle is trending upward. Use the mini-candles and countdown timer to monitor when the current 4-hour candle is about to close.
Entry Signal:
If you see a bullish divergence on your lower timeframe (say, on a 15-minute chart) near the end of the 4-hour candle (as the countdown nears zero), this could signal that the uptrend might continue, suggesting a potential buy signal.
Exit Signal:
Conversely, if you see bearish price action or a breakdown of support as the candle closes, you might consider exiting long positions or even taking a short trade.
Please Share
If you find this indicator useful for your multi-timeframe analysis and timing-based strategies, please consider sharing it with your fellow traders. Sharing helps improve our community's tools and fosters collaboration among traders!

HOSSA High-Low LevelsHOSSA High-Low Levels – How It Works and How to Use It
The HOSSA High-Low Levels indicator gives you three different ways to plot key price levels on your chart, all based on a higher timeframe candle you select. It can help you spot important support and resistance zones, potential expansion levels, or key reference points (high, low, open, close) to aid in your technical analysis.
1. Modes of Operation
Resistance
In this mode, the indicator measures the range between the previous candle’s high and low (on your chosen higher timeframe).
It then projects multiple lines above and below that range (both “positive” and “negative” expansions).
This allows you to visualize potential resistance/support areas at intervals like +25%, +50%, +100%, -25%, -50%, etc., relative to that candle’s range.
Fibonacci
This mode also takes the candle’s high and low, then applies Fibonacci retracement and extension levels (including negative extensions).
You’ll see levels such as 0.236, 0.382, 0.5, 0.618, 1.272, 1.618, and more plotted on your chart.
These can be useful for identifying potential reversal or continuation zones based on Fibonacci theory.
High-Low-Open-Close
In this simpler mode, the script plots just four lines at the higher timeframe candle’s high, low, open, and close.
This gives you clean reference levels for intraday trading or any lower timeframe analysis.
2. Selecting Your Higher Timeframe
Higher Timeframe Input: The script uses the high, low, open, and close of the candle from the timeframe you choose (default is 240 minutes, i.e., 4 hours).
These reference points form the basis of how the indicator calculates its lines in each mode.
3. How to Use It in Your Analysis
Detect Potential Support/Resistance
In Resistance or Fibonacci mode, look for price reactions around these plotted lines. If price stalls or reverses, those levels may act as support or resistance.
Identify Trade Targets and Stop Areas
Projected lines (especially in Resistance or Fibonacci mode) can serve as logical areas for placing stop-loss or take-profit orders.
Combine with Price Action
If using High-Low-Open-Close, you might watch for breakouts or bounces near the higher timeframe candle’s open/close.
Combining these key levels with candlestick patterns or volume can enhance your conviction for entries or exits.
Multi-Timeframe Context
While your main chart might be on a shorter timeframe (e.g., 15 minutes), the lines from a higher timeframe candle (e.g., 4 hours) add valuable “bigger picture” context to refine your trades.
4. Tips for Best Practice
Experiment with Different Timeframes: If the 4-hour candle levels aren’t aligning well with your style, consider daily or weekly candles to see broader market structure.
Color Coding: The script automatically colors lines based on their significance in each mode (e.g., highs in one color, lows in another). This makes it easier to quickly identify critical price references.
Alert Combinations: Although this script doesn’t directly create alerts, you can combine it with TradingView’s alert system (e.g., “Crossing” a plotted level) to get notified if price tests a key zone.
By using HOSSA High-Low Levels, you’ll have a flexible tool to easily project important price lines on your chart – whether those lines are expansions of a range, Fibonacci retracements and extensions, or simply the previous candle’s high, low, open, and close. This can help you trade more confidently by giving you clear, higher timeframe reference points.
Request to Share My Work
Dear Users,
I kindly ask for your support in sharing my work with your friends and networks. Every like, share, or recommendation is extremely valuable to me and helps reach a wider audience.
I would be immensely grateful for any form of support and engagement! Thanks to your help, I can continue developing this project and bring more ideas to life.
With sincere appreciation,

Hossa Sweep/liquidityHossa Sweep/Liquidity – How It Works and How to Use It
The Hossa Sweep/Liquidity indicator is designed to detect “sweep” signals across multiple timeframes. A “sweep” occurs when one candle (Candle #2) pushes beyond the previous candle’s high or low (Candle #1) while both candles share the same color (both bullish or both bearish). Additionally, Candle #1 must have a visible wick. This indicator can help traders identify potential turning points or continuation patterns.
1. How It Operates for Traders
Multiple Timeframes: You can select up to five different timeframes (e.g., 5m, 15m, 1H, 4H, 1D). The indicator will check each chosen timeframe to see if a sweep is happening.
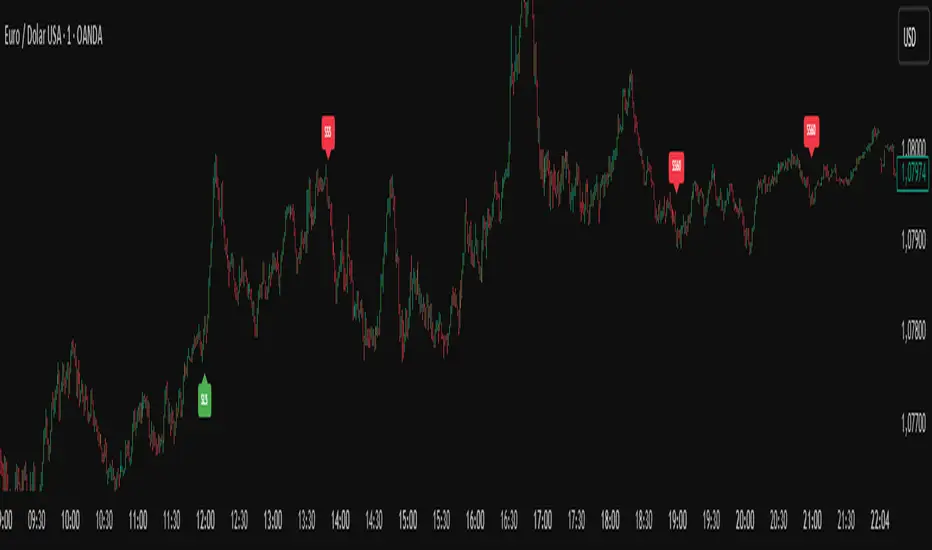
Visual Labels: When it detects a valid sweep:
SL (Sweep Long) label appears below a candle if the sweep is bullish.
SS (Sweep Short) label appears above a candle if the sweep is bearish.
Alerts: The script triggers an alert whenever a new sweep signal appears on any of the selected timeframes, so you won’t miss an opportunity.
2. Practical Ways to Use It
Confluence with Other Signals
Combine these sweep signals with your favorite support/resistance zones, moving averages, or volume profiles. For instance, a sweep at a known support zone can hint at a bullish reversal; a sweep at resistance might suggest a bearish reversal.
Confirm Trend Continuations
Watch for bullish sweeps in an existing uptrend or bearish sweeps in a downtrend. A sweep in line with the overall trend can serve as a continuation signal, helping you time pullback entries.
Identify Potential Reversals
Sweeps often appear near market tops/bottoms when price aggressively tests a previous candle’s high or low. In these areas, a sweep followed by strong follow-through can be a clue of a likely turning point.
Manage Risk More Precisely
Since the indicator specifies exact candle highs/lows, you can plan tighter stop-loss levels or be more precise with your targets.
Request to Share My Work
Dear Users,
I kindly ask for your support in sharing my work with your friends and networks. Every like, share, or recommendation is extremely valuable to me and helps reach a wider audience.
I would be immensely grateful for any form of support and engagement! Thanks to your help, I can continue developing this project and bring more ideas to life.
With sincere appreciation,
Candle Scale ComparisonCompares the scale of bullish and bearish candles and shows which side is currently dominant. Works in any symbol.
1. Input Parameters:
- LookbackPeriod: Allows you to set how many bars to look back for calculating averages (default: 20)
- showLabels: Toggle to show/hide dominance labels on the chart
2. Calculations:
- Calculates the scale of bullish candles (close - open)
Calculates the scale of bearish candles (open - close)
- Computes moving averages for both scales using the specified lookback period
- Determines which type of candles are dominating based on the averages
3. Visual Elements:
- Plots two lines showing the average scales:
- Green line for bullish candle scales
- Red line for bearish candle scales
- Adds a background color that changes based on dominance:
- Light green when bullish candles dominate
- Light red when bearish candles dominate
- Shows labels above the chart indicating current dominance
- Displays a table in the top-right corner showing:
- The current scale ratio (bullish/bearish)
- The current dominance status
4. Features:
- The indicator is plotted in a separate pane below the main chart
- Uses color coding for easy visual interpretation
- Provides both visual and numerical representation of the dominance
- Updates in real-time as new candles form
