Ahmed Mo3Ty - Bollinger Bands 1Buy:
Enter long when price closes above upper Bollinger Band (plot green arrow)
Close long when price closes below lower Bollinger Band
Sell:
Enter short when price closes below lower Bollinger Band (plot red arrow)
Close short when price closes above upper Bollinger Band
Important: For successful investment in the financial markets, I advise you to use the following combination and not rely solely on technical analysis tools (experience + risk management plan + psychological control + combining technical analysis with fundamental analysis).
Risk Warning: This indicator is not a buy or sell recommendation. Rather, it is for educational purposes and should be combined with the previous combination. Any buy or sell order is yours alone, and you are responsible for it.
Candlestick analysis

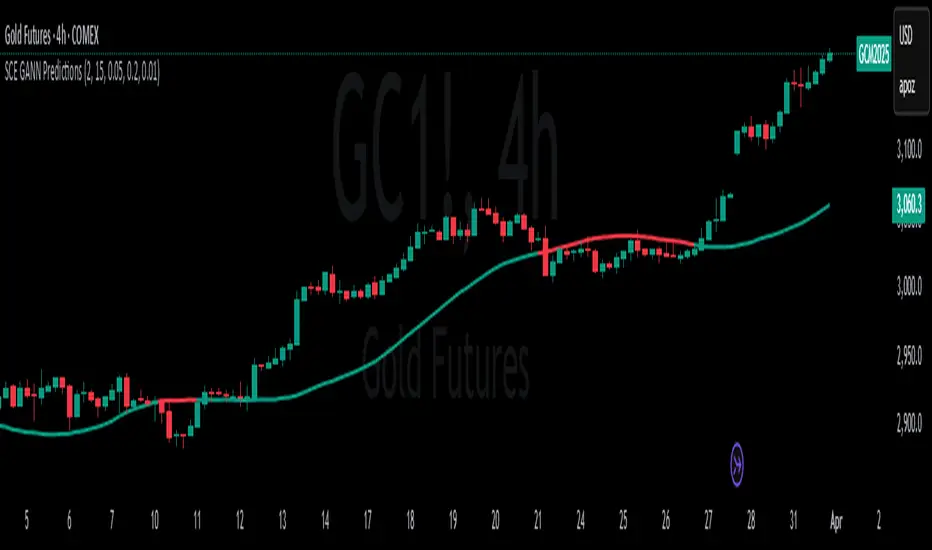
SCE GANN PredictionsThis is a script designed to give an insight on price direction from being above or below a GANN Value.
What Are GANN Waves?
The SCE GANN Predictions indicator is inspired by the work of W.D. Gann, a renowned trader who believed that price movements follow geometric and mathematical patterns. GANN waves use past price behavior—specifically momentum or "velocity"—to forecast where prices might head next.
How Does the Indicator Work?
Calculating Velocity
The script starts by measuring the "velocity" of price movement over a user-defined lookback period (denoted as n). This velocity is the average difference between the close and open prices over n bars. Think of it as the market’s speed in a given direction.
Predicting the Future Price
Using this velocity, the indicator estimates a future price after a specific time horizon—calculated as n + n*2 bars into the future (e.g., if n = 15, it predicts 45 bars ahead). It scales the velocity by a ratio (Gr) to determine the "end price." This is the raw GANN prediction.
Optimizing the Ratio (Gr)
The key to a good prediction is finding the right Gr. The script tests a range of Gr values (from Gr_min to Gr_max, stepping by Gr_step) and evaluates each one by calculating the sum of squared errors (SSE) between the predicted prices and the actual historical close prices. The Gr with the lowest SSE is deemed "optimal" and used for the final prediction.
Smoothing with an SMA
The raw GANN prediction is then smoothed using a simple moving average (SMA) over the lookback period (n). This SMA is plotted on your chart, serving as a dynamic trend line. The plot’s color changes based on the current price: teal if the close is above the SMA (bullish), and red if below (bearish).
Visuals
This example shows how the value explains price strength and changes color. When the price is above the line, and it’s green, we’re showing an up trend. The opposite is when the price is below the line, and it’s red, showing a down trend.
We can see that there may be moments where price drops under the value for just that one bar.
In scenarios with sideways price action, even though the price crosses, there is no follow through. This is a shortcoming of the overall concept.
Customizable Inputs
Timeframe: Choose the timeframe for analysis (default is 2 minutes).
Show GANN Wave: Toggle the GANN SMA plot on or off (default is true).
Lookback Period (Gn): Set the number of bars for velocity and SMA calculations (default is 15).
Min Ratio (Gr_min): The lower bound for the Gr optimization (default is 0.05).
Max Ratio (Gr_max): The upper bound for Gr (default is 0.2).
Step for Gr (Gr_step): The increment for testing Gr values (default is 0.01).
How to Use SCE GANN Predictions
Trend Direction
The colored SMA provides a quick visual cue. Teal suggests an uptrend, while red hints at a downtrend. Use this to align your trades with the broader momentum.
Crossover Signals
Watch for the close price crossing the GANN SMA. A move above could signal a buy opportunity, while a drop below might indicate a sell. Combine this with other indicators for confirmation.
Fine-Tuning
Experiment with the lookback period (Gn) and Gr range to optimize for your market. Shorter lookbacks might suit fast-moving assets, while longer ones could work for slower trends.
Like any technical tool, SCE GANN Predictions isn’t a crystal ball. It’s based on historical data and mathematical assumptions, so it won’t always be spot-on.
Volume-Powered S/R TraderThis advanced TradingView indicator combines volume analysis, dynamic support/resistance levels, and technical indicators to identify high-probability trading opportunities. It focuses on detecting institutional-level activity through volume spikes at key price levels.
Key Components
Volume Analysis Engine
Tracks volume spikes (150%+ of 20-period average)
Color-coded volume bars:
Green: Bullish volume spike (high volume + bullish candle)
Red: Bearish volume spike (high volume + bearish candle)
Dynamic Support/Resistance System
Auto-detects swing points using pivot high/low
Maintains rolling arrays of:
Support Levels (green semi-transparent lines)
Resistance Levels (red semi-transparent lines)
Displays only the 5 most recent levels for clarity
Trend Analysis
50-period EMA trend filter
RSI momentum indicator (14-period)
Trend direction classification:
Bullish: EMA rising
Bearish: EMA falling

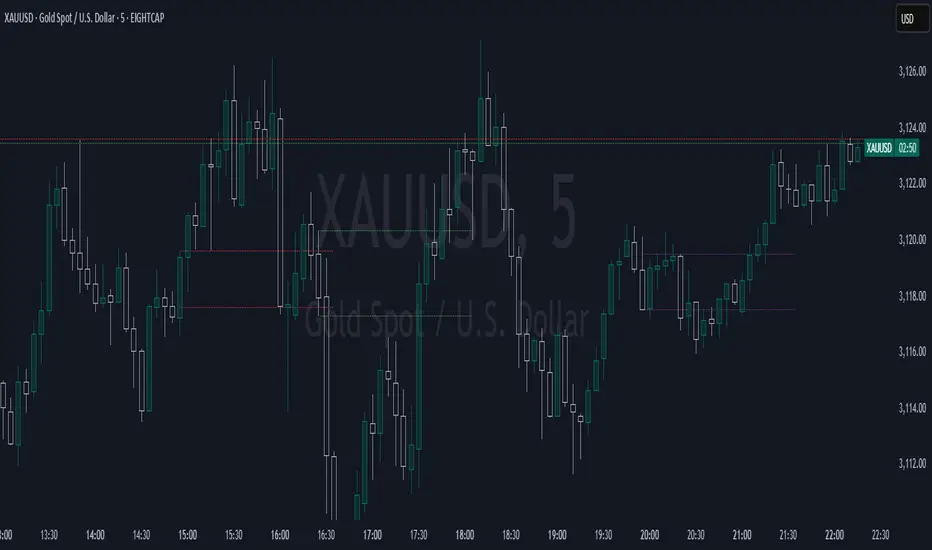
MBE Forecast & Bank Orders with Price LevelsMBE Forecast & Bank Orders with Price Levels – Designed for Gold (XAUUSD)
The MBE Forecast & Bank Orders with Price Levels indicator is specifically designed for trading Gold (XAUUSD), focusing on institutional liquidity levels where price reactions are most likely. By marking Bank Sell Zones and Bank Buy Zones, it helps traders refine their entries and exits with precision.
Key Features:
✅ Bank Sell Zones & Bank Buy Zones for XAUUSD:
Bank Sell Zones (Resistance): Identifies price levels above the current price where institutional sell orders may lead to price reversals.
Bank Buy Zones (Support): Marks price levels below the current price where institutional buy orders may create strong support.
✅ Advanced Liquidity Tracking:
Dynamically adjusts liquidity zones based on XAUUSD price movements.
Uses an efficient array-based system to detect and display multiple key price levels.
✅ Optimized Visual Display:
Sell Zones (Red Labels) – Highlight areas of potential price rejection and resistance.
Buy Zones (Green Labels) – Indicate key support levels where price may bounce.
Each zone is marked with exact price levels for easy decision-making.
Optimal Trading Hours:
The London/New York AM session is an excellent time to trade Gold (XAUUSD), especially when using the MBE Forecast & Bank Orders with Price Levels indicator. This session is known for its high liquidity and increased market activity as both the London and New York markets overlap.
🔹 Built Specifically for Gold (XAUUSD) – Optimized to track institutional liquidity for higher trading accuracy.
🔹 Helps Identify Institutional Order Blocks – Aligns with smart money movements for better trade execution.
🔹 Improves Entry & Exit Precision – Enhances trade setups by reacting to price touches at liquidity levels.
This indicator is an essential tool for XAUUSD traders, providing real-time insights into institutional liquidity levels for more confident and precise trading.

TrendSync Pro (SMC)🔹 How to Adjust the Higher Timeframe (HTF) Filter
Click the Settings (Gear Icon) on your chart
Go to the "Inputs" tab
Find "Higher Timeframe" (default: 60 for 1-hour)
Change the value to match your strategy:
Scalping (1-5 min charts) → Use 15 or 30 for 15M/30M filter
Day Trading (15-30 min charts) → Use 60 (1H) or 240 (4H)
Swing Trading (1H+ charts) → Use D (Daily) or W (Weekly)
(Example: Trading on 15M? Set HTF to 60 for 1H confirmation.)
📊 Realistic Performance (15M Timeframe)
🔎 Statistical Backtest Results (100+ trades):
~50% Win Rate (Typical for trend strategies)
1:10 Risk-Reward (1% SL, 10% TP) → Profitable if trend holds
Best in Trending Markets (Avoid choppy/ranging conditions)
✅ Why It Works?
Catches strong momentum moves aligned with HTF
Small stops (1%) protect capital, while 10% TP rides trends
50% accuracy is enough when reward >> risk
📈 How to Improve Results?
Combine with SMC Confirmation Tools:
Check Order Blocks (entry near HTF premium/discount zones)
Wait for Liquidity Sweeps (stop hunts before trend reversals)
Confirm with Volume Spike (institutional participation)
Avoid Trading:
During Low Volatility (ADR < 50%)
Right Before Major News Events (FOMC, NFP)
Optimal Pairings:
For Forex: Use with ICT Power of 3 (15M + 1H + 4H)
For Crypto: Combine with Liquidation Heatmap
For Stocks: Align with VWAP + Market Profile
⚙️ Recommended Settings (15M Chart)
HTF Filter : 60 (1H) - Confirms trend direction
Trend Period : 20 - Balances responsiveness
SL (%) : 1% - Tight risk management
TP (%) : 10% - Let winners run
ATR SL (Optional) : 1.5x ATR - Dynamic stops in volatile markets
🚀 Final Tip
"Trade less, win bigger!"
This strategy thrives on high RR trades, not high frequency
1-2 quality setups/day often outperform 10+ scalps

Máximo y Mínimo (Última Día y H4)marca el maximo y el minimo del precio de la ultima vela completa de 1 dia y de 4 horas

RDMP - StrategyMulti-Indicator Trading Strategy (RSI-Stochastic-Fibonacci-Support/Resistance).
This advanced TradingView indicator combines four powerful technical tools to identify high-probability trading opportunities across all timeframes.
Key Features:
Smart signal system requiring multiple confirmations to reduce false signals
Automatic support/resistance detection with dynamic visualization
Fibonacci retracements calculated on relevant swing points
Trend filter to align with market direction
Timeframe auto-adjustment optimizing parameters for any chart
Visual dashboard displaying all indicator states at a glance
Divergence detection to anticipate potential trend reversals
The indicator overlays key price levels directly on your chart while displaying discrete buy/sell signals when multiple conditions align. Fully customizable parameters allow fine-tuning to your trading style.
Perfect for multi-timeframe traders seeking confirmed entries at key market levels.

Beyond TrackBeyond Track is a powerful tool designed to assist traders in identifying key market trends, entry and exit points, and potential reversals. This indicator combines to provide clear and actionable signals for both novice and experienced traders.


BIX Candle MarkerBIX Candle Marker (by Bogdan Ilie)
"BIX Candle Marker" is a visual indicator designed to automatically mark the High and Low levels of specific candles at user-defined times and sessions directly on the main chart, facilitating easy intraday analysis.
**How does it work?**
- The indicator automatically fetches the High and Low values from a user-specified timeframe and draws horizontal lines at these levels at precise user-defined session times.
- You can configure up to 4 different sessions per trading day, each with its own customizable color and timing.
- Marked levels are automatically reset at the start of each new trading day.
**Customizable Settings:**
- **Timezone Offset:** Adjust the indicator according to your chart's timezone.
- **Candle Time Frame:** Choose the timeframe from which the candle data will be extracted.
- **Marker Length:** Set the length (number of bars) of the displayed horizontal lines.
- **Line Thickness & Style:** Customize the thickness and style of the lines (solid, dotted, dashed).
- **Sessions (1-4):** Independently configure the hour, minute, and color for each of the four possible sessions.
**Suggested Use:**
- Quickly identify intraday support and resistance levels based on key session candles.
- Ideal for breakout and reversal-based trading strategies.
---
**Disclaimer:**
This indicator is intended solely for chart analysis and educational purposes. It does not constitute financial advice. Always use it in conjunction with your personal trading strategy and risk management practices.
Author: Bogdan Ilie
Pine Script Version: v6
License: Mozilla Public License 2.0
---
BIX Candle Marker (by Bogdan Ilie)
"BIX Candle Marker" este un indicator vizual care marchează automat nivelurile High și Low ale lumânărilor specifice din sesiuni predefinite pe graficul principal, facilitând analiza punctelor-cheie intraday.
**Cum funcționează?**
- Indicatorul preia automat nivelurile maxime și minime dintr-un timeframe personalizabil și afișează linii orizontale pentru aceste nivele exact la orele și minutele configurate.
- Permite definirea a până la 4 sesiuni diferite într-o zi, fiecare având culori și setări proprii.
- Liniile marcate se resetează automat la începutul fiecărei zile de tranzacționare.
**Setări personalizabile:**
- **Timezone Offset:** ajustează indicatorul în funcție de fusul orar al graficului.
- **Candle Time Frame:** selectează timeframe-ul din care se vor prelua datele.
- **Marker Length:** stabilește lungimea (numărul de bare) liniilor orizontale afișate.
- **Line Thickness & Style:** grosimea și stilul liniilor pot fi personalizate (solid, punctat, întrerupt).
- **Sesiuni (1-4):** ora, minutul și culoarea fiecărei sesiuni pot fi configurate independent.
**Sugestii de utilizare:**
- Folosește indicatorul pentru a identifica rapid zonele de suport și rezistență create de lumânări-cheie pe parcursul zilei.
- Poate fi util pentru strategii bazate pe breakout sau reversal.
---
**Disclaimer:**
Acest indicator este destinat exclusiv analizei grafice și nu reprezintă sfaturi financiare. Utilizează-l împreună cu propriile strategii și tehnici de gestionare a riscului.
Autor: Bogdan Ilie
Versiune Pine Script: v6
Licență: Mozilla Public License 2.0
Doji Breakout 3:1 DetectorFinds a proper doji for you to buy its high or sell its low for a 3:1 reward

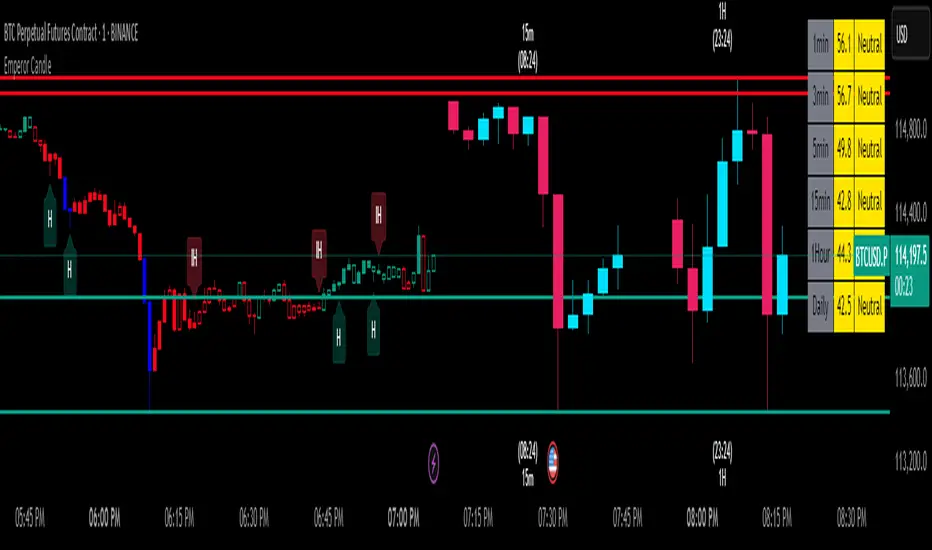
Emperor RSI CandleDescription:
The Emperor RSI Candle is a real-time, non-lagging trading indicator that colors candles based on RSI (Relative Strength Index) levels. It offers instant visual feedback on market momentum, making it easy to identify trend strength, overbought/oversold zones, and potential reversals with precision.
Unlike traditional RSI indicators, which display RSI values in a separate panel, Emperor RSI Candle integrates RSI signals directly into the candles, providing a cleaner, more intuitive charting experience. Its multi-timeframe RSI box shows RSI values across different timeframes, offering confluence confirmation for better trade decisions.
🔥 Emperor RSI Candle is original because it includes a multi-timeframe RSI box that displays RSI values from:
1 min → Monthly timeframes simultaneously.
📊 How this is unique:
Traders can instantly compare RSI values across different timeframes.
This helps them spot confluence and divergences, which is not possible with standard RSI indicators.
The multi-timeframe confluence feature makes the indicator highly effective for both short-term and long-term traders.
🚀 What the script does:
Real-time candle coloring based on RSI levels.
Multi-timeframe RSI box for confluence insights.
Customizable RSI settings for adaptability.
How it benefits traders:
Instant visual feedback for momentum and reversals.
No lag signals for precise trading decisions.
Flexible customization for different trading styles.
Unique visual signals:
Green, red, parrot green, and blue candles → Clearly indicating bullish/bearish momentum and overbought/oversold zones.
Multi-timeframe RSI box → For cross-timeframe confluence.
⚡️ 🔥 UNIQUE FEATURES 🔥:
✅ Multi-Timeframe RSI Box:
Displays RSI values from 1 min to monthly timeframes, helping traders confirm confluence across different timeframes.
✅ Fully Customizable RSI Levels & Display:
Modify RSI thresholds, source, and appearance to fit your trading style.
✅ Dynamic Candle Borders for Weak Signals:
Green border → Weak bullishness (RSI between 50-60).
Red border → Weak bearishness (RSI between 40-50).
✅ Lag-Free, Real-Time Accuracy:
No repainting or delay—instant visual signals for accurate decisions.
✅ Scalable for Any Trading Style:
Perfect for both intraday scalping and positional trading.
📊 🔥 HOW IT WORKS 🔥:
The indicator dynamically colors candles based on RSI values, providing real-time visual signals:
🟢 Above 60 RSI → Green candle:
Indicates bullish momentum, signaling potential upward continuation.
🟩 Above 80 RSI → Parrot green candle:
Overbought zone → Possible reversal or profit booking.
🟥 Below 40 RSI → Red candle:
Signals bearish momentum, indicating potential downward continuation.
🔵 Below 20 RSI → Blue candle:
Oversold zone → Possible reversal opportunity.
🔲 Neutral candles:
50-60 RSI → Green border: Weak bullishness.
40-50 RSI → Red border: Weak bearishness.
📊 🔥 MULTI-TIMEFRAME RSI BOX 🔥:
The Emperor RSI Candle includes an RSI box displaying multi-timeframe RSI values from 1 min to monthly. This provides:
✅ Confluence confirmation:
Compare RSI across multiple timeframes to strengthen trade conviction.
✅ Spot divergences:
Identify hidden trends by comparing smaller and larger timeframes.
✅ Validate trade entries/exits:
Use higher timeframe RSI to confirm smaller timeframe signals
⚙️ 🔥 HOW TO USE IT 🔥:
To maximize the accuracy and clarity of Emperor RSI Candle, follow these steps:
🔧 STEP 1: Chart Settings Configuration
Go to Chart Settings → Symbols
Uncheck the following options:
Body
Borders
Wick
✅ This ensures that only the Emperor Candle colors are visible, making the signals clear and distinct.
🔧 STEP 2: Style Settings for Emperor Candle
After applying the Emperor RSI Candle:
Go to Settings → Style tab
Wick section:
Select Color 2 and Color 3 → Set Opacity to 100%.
Border section:
Select Color 2 and Color 3 → Set Opacity to 100%.
✅ This ensures the candles display with full visibility and accurate colors.
⚙️ 🔥 CUSTOMIZATION OPTIONS 🔥:
Emperor RSI Candle offers full flexibility to match your trading style:
✅ RSI Length:
Modify the period used for RSI calculation (default: 10).
✅ Top & Bottom Levels:
Adjust the overbought (default: 80) and oversold (default: 20) thresholds.
✅ Intermediate Levels:
Up Level: Default: 60 → Bullish RSI threshold.
Down Level: Default: 40 → Bearish RSI threshold.
Mid Level: Default: 50 → Neutral zone.
✅ RSI Source:
Select the price source for RSI calculation (Close, Open, High, Low).
✅ RSI Period:
Customize the RSI calculation period (default: 10).
✅ Font Size:
Adjust the RSI box font size for better visibility.
✅ Box Position:
Choose where to display the RSI box:
Top Left / Top Center / Top Right
Bottom Left / Bottom Center / Bottom Right
💡 🔥 HOW IT IMPROVES TRADING 🔥:
✅ Clear trend identification:
Instantly recognize bullish, bearish, or neutral conditions through candle colors.
✅ Precise entries and exits:
Spot overbought and oversold zones with visual clarity.
✅ Multi-timeframe confirmation:
Validate trades with RSI confluence across multiple timeframes.
✅ No lag, real-time accuracy:
Immediate visual signals for faster and more reliable trade decisions.
✅ Customizable settings:
Tailor the indicator to fit your trading strategy and preferences.
✅ Works for all trading styles:
Suitable for scalping, day trading, and swing trading.
🔥How Traders Can Use Emperor RSI Candle for Trading:
🟢 Green Candles (Above 60 RSI) → Bullish Momentum:
Indicates strong upward movement → Ideal for long entries.
Traders can hold until RSI approaches 80 for profit booking.
🟥 Red Candles (Below 40 RSI) → Bearish Momentum:
Signals strong downward movement → Ideal for short trades.
Traders can exit or book profits near RSI 20.
2. Spotting Overbought and Oversold Zones for Reversals:
🟩 Parrot Green Candles (Above 80 RSI) → Overbought Zone:
Indicates potential for reversals or profit booking.
Traders can tighten stop-losses or exit positions.
🔵 Blue Candles (Below 20 RSI) → Oversold Zone:
Signals a potential reversal opportunity.
Traders can look for buy signals with confluence confirmation.
3. Catching Weak Bullish and Bearish Trends with Border Colors:
🟢 Green Border (RSI 50-60) → Weak Bullishness:
Indicates mild upward momentum.
Traders can consider cautious long entries.
🔴 Red Border (RSI 40-50) → Weak Bearishness:
Indicates mild downward pressure.
Traders can consider cautious short entries.
4. Using the RSI Multi-Timeframe Box for Confluence:
✅ Displays RSI values from 1 min to monthly timeframes.
Usage:
Confluence confirmation:
Multiple timeframes showing bullish RSI → Strong uptrend → Reliable buy signals.
Multiple timeframes showing bearish RSI → Strong downtrend → Reliable sell signals.
Spotting divergences:
If lower timeframes are bullish but higher timeframes are bearish, it indicates a potential reversal.
5. Customization Tips for Different Trading Styles:
✅ For Scalping:
Use a smaller RSI period (9-10) for faster signals.
Check the multi-timeframe RSI box to confirm signals quickly.
✅ For Swing Trading:
Use the default RSI period (14-15) for more accurate signals.
Focus on higher timeframes (1 hr, 4 hr, daily) for stronger trend confirmation.
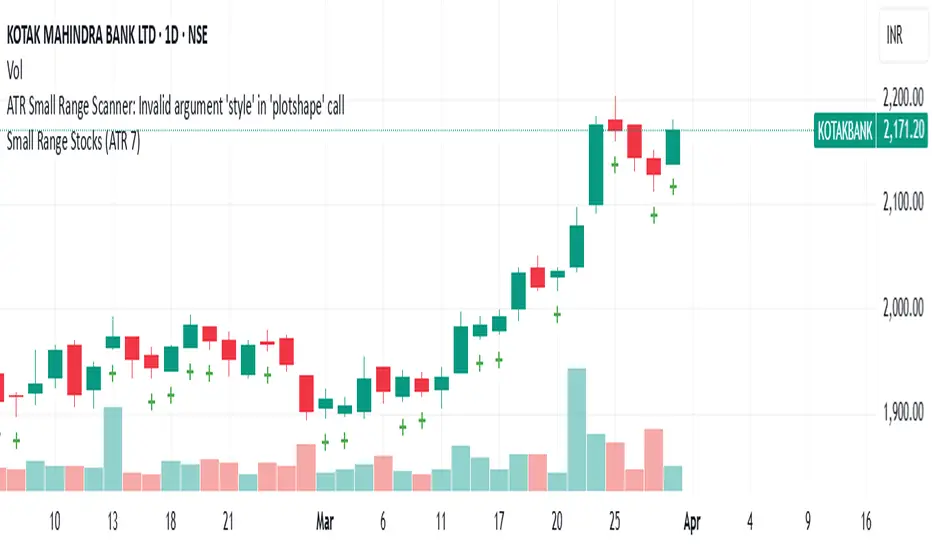
Small Range Stocks (ATR 7)This indicator identifies stocks with a small daily range relative to their ATR(7). It plots a small green tick below candles where the daily range is ≤ 0.9 × ATR(7), helping traders spot consolidation zones for potential breakouts.
Round Numbers Round Numbers – A Visual Guide to Key Psychological Price Levels
The Round Numbers indicator highlights key psychological price levels, specifically 500s and 1000s, which frequently act as support and resistance zones. This tool automatically detects and plots horizontal lines at these critical price points, helping traders analyze market structure with clarity.
Features:
Plots horizontal lines at every 500 & 1000 price level (e.g., $20,500, $21,000, $21,500).
Customizable settings:
Line color, style (solid, dashed, dotted).
Font type selection (Comic Sans, Century Gothic, Sans, Serif, Mono).
Text color customization.
Formatted price labels with currency symbols (e.g., $20,500).
Adjustable line length – Choose how many candles back the lines extend (1-500 bars).
No background on price labels – Clean, non-intrusive design.
How It Helps Traders:
Support & Resistance Trading – Round numbers often act as reversal or breakout zones.
Scalping & Day Trading – Quickly identify psychological price barriers in fast-moving markets.
Swing Trading & Long-Term Analysis – Spot major price clusters where buyers and sellers react.
This indicator is suitable for Forex, Stocks, Crypto, and Futures traders who rely on psychological price levels for precision trading.

Williams Alligator + Adaptive RSITrend base indicator. Most powerful to use in daily timeframe as the confluence, and entry on the 4 hrs.

Avi mod finalalert on qqe mod
ignals are generated by simple EMA crosses (with adjustable values) in the direction of the current trend and then validated against a scoring system that's comprised of 20 other indicators. When the majority of them agree then the trade can be taken. The tolerance score that permits a trade can be adjusted within the indicator preference panel and the values can be printed above/below the candle to help you tune your entry points.
To further reassure you, the smoothed candle direction from the 4 hour chart is printed in the background to validate the trend direction and a floating trade helper panel translates the scores in to practical terms (buy, sell etc)

Candle Body % ChangeThis indicator shows the relative price change in candle bodies. I use this to track daily relative changes in markets like NYSE or NASDAQ where discontinued price action regularly happens.

Hypersonic MAIN Intersection IndicatorIndicator that shows the intersection point of two Items of Interest. Backtesting showed the best was Candle/EMA 9.
1. I added 2 auxiliary EMA's that you can view or hide becuase I know some people like to see the EMA 200
2. You select the First and Second Item of Interest and it'll plot it in the background. First EMA and Second EMA correspond to whether you select them or not. The BWMA stuff is near the bottom. And in the middle is how you can show/hide the data table in the top-right.
3. you can show/hide different lines in the Style section
4. on the Style tab of Settings, you can turn off the whole table as well as the Trades, just the signal of the trade, or just the quantity of the trade

Head-HunterHead-Hunter Indicator
A comprehensive reversal pattern detection tool that combines multiple technical elements to identify potential market turning points. This indicator analyzes vector candles, RSI divergence, and volume patterns to filter out false signals.
Key Features:
Vector candle detection with customizable wick and body ratios
RSI divergence confirmation for stronger signals
Volume-based filtering system
Visual alerts through color-coded bars and shapes
Signal Types:
Bearish vector patterns (pink bars)
Bullish vector patterns (orange bars)
Classic reversal patterns (green/red triangles)
Divergence confirmations (yellow diamonds)
Best timeframe usage: 15m to 4h charts. The indicator combines volume analysis with RSI divergence to help identify high-probability reversal points before they become obvious.
Settings are optimized but can be adjusted:
Wick Size Ratio: 0.3 (adjustable 0.1-1.0)
Body Size Ratio: 0.3 (adjustable 0.1-0.5)
Volume Look-back: 20 periods
RSI parameters: Standard 14-period
This tool aims to provide clear, actionable signals for reversal trading strategies.
v2.0.4

Gold Futures vs Spot (Candlestick + Line Overlay)📝 Script Description: Gold Futures vs Spot
This script was developed to compare the price movements between Gold Futures and Spot Gold within a specific time frame. The primary goals of this script are:
To analyze the price spread between Gold Futures and Spot
To identify potential arbitrage opportunities caused by price discrepancies
To assist in decision-making and enhance the accuracy of gold market analysis
🔧 Key Features:
Fetches price data from both Spot and Futures markets (from APIs or chart sources)
Converts and aligns data for direct comparison
Calculates the price spread (Futures - Spot)
Visualizes the spread over time or exports the data for further analysis
📅 Date Created:
🧠 Additional Notes:
This script is ideal for investors, gold traders, or analysts who want to understand the relationship between the Futures and Spot markets—especially during periods of high volatility. Unusual spreads may signal shifts in market sentiment or the actions of institutional players.

Gaussian Channel + Stoch RSI Strategy"An indicator entry model is a systematic framework designed to identify optimal entry points for a given process, such as initiating a trade, investment, or action, based on predefined signals or indicators. This model leverages quantitative or qualitative metrics—such as technical indicators (e.g., moving averages, RSI, MACD), economic data, or market conditions—to generate actionable insights. The model typically involves setting specific thresholds or conditions that, when met, trigger an entry signal. For example, in trading, the model might use a combination of a 50-day moving average crossing above a 200-day moving average and an RSI below 70 to indicate a buy entry. The goal is to reduce subjectivity, enhance consistency, and improve decision-making efficiency by relying on data-driven rules tailored to the user’s objectives and risk tolerance."

[MACD] Blue & Red Candles🚀 Title :
✔️ Smart candlestick color indicator
🚀 Description :
✔️ Enhance your chart analysis with this dynamic candlestick color indicator
✔️ Designed to help traders quickly identify market trends with intuitive visual cues
🚀 Features :
✔️ Automatically adjusts candlestick colors based on market conditions
✔️ Helps traders spot potential shifts in momentum
✔️ Simple , clean, and effective for all trading strategies
🚀 Try it now and take your trading to the next level 🚀

Billafx(trend) High/Lowthis indicator is gonna help you to spot the market strecture in advanced way, created by billafx
