Candlestick analysis

yatofxDescription: "Ramon Coto's 3 Session Bar Color" Indicator
This TradingView Pine Script indicator colors candlestick bars based on three custom trading sessions. It allows traders to visually distinguish different market timeframes on their charts.
Features:
Three configurable trading sessions with user-defined time ranges.
Customizable session colors:
Session A → Blue
Session B → Red
Session C → Lime
Enable/disable sessions independently using input toggles.
Automatic session detection: Bars are colored based on the active session.
Optimized for TradingView Mobile & Desktop with clear and efficient logic.
How It Works:
1. User Inputs: The script takes session time ranges and enables/disables each session.
2. Session Detection: The script checks whether the current time falls within any of the defined sessions.
3. Bar Coloring: If a session is active, the corresponding color is applied to the bars.
This indicator helps traders quickly recognize which market session they are in, improving decision-making for session-based strategies.
MA200 + MA55 Trend Signals with 2-Candlestick Patterns### **Key Features:**
1. **Buy Signal:**
- Triggered only when:
- Both `MA200` and `MA55` are sloping upward (`ma200_slope > 0` and `ma55_slope > 0`).
- The price is above both `MA200` and `MA55`.
- The price is near `MA55` (within the adjustable tolerance range, default is `0.50%`).
- A **bullish 2-candlestick pattern** (engulfing or harami) is detected.
- A **higher low** is detected (indicating a recognizable downswing in the uptrend).
2. **Sell Signal:**
- Triggered only when:
- Both `MA200` and `MA55` are sloping downward (`ma200_slope < 0` and `ma55_slope < 0`).
- The price is below both `MA200` and `MA55`.
- The price is near `MA55` (within the adjustable tolerance range, default is `0.50%`).
- A **bearish 2-candlestick pattern** (engulfing or harami) is detected.
- A **lower high** is detected (indicating a recognizable upswing in the downtrend).

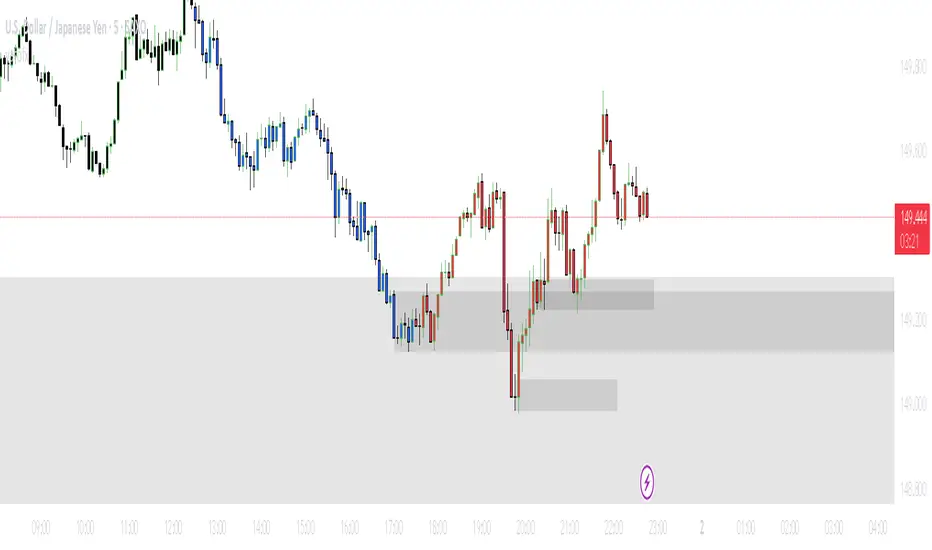
🔥 Options Trading VWAP Indicator 🔥✅ **تم تحسين المؤشر بإشارات دخول وخروج أوضح!**
🔹 **إشارات CALL (شراء)** تظهر بأسهم خضراء عند تقاطع السعر فوق VWAP مع اتجاه صاعد و**RSI > 50**.
🔹 **إشارات PUT (بيع)** تظهر بأسهم حمراء عند تقاطع السعر أسفل VWAP مع اتجاه هابط و**RSI < 50**.
🔹 **تمت إضافة تنبيهات تلقائية عند ظهور إشارات CALL و PUT** حتى لا تفوت أي فرصة!
🚀 **يفضل استخدام شموع هايكين آشي !** 🔥📊
✅ **The indicator has been improved with clearer entry and exit signals!**
🔹 **CALL (buy) signals** are shown with green arrows when the price crosses above VWAP with an upward trend and **RSI > 50**.
🔹 **PUT (sell) signals** are shown with red arrows when the price crosses below VWAP with a downward trend and **RSI < 50**.
🔹 **Automatic alerts have been added for CALL and PUT signals** so you never miss an opportunity!
🚀 **Heikin Ashi candles are recommended!** 🔥📊


Omar TradingOmar Trading Indicator – Description
The Omar Trading Indicator is a custom-built trading tool designed to identify potential buy signals based on multiple technical analysis factors. This indicator combines several key elements to improve trade accuracy and reliability.
Key Features:
✅ Zero Reversal from the Bottom – Detects price reversals from recent lows.
✅ Liquidity Check – Uses volume analysis to confirm market strength.
✅ MACD Crossover – Identifies bullish momentum when the MACD line crosses above the signal line.
✅ Moving Average Crossover – Confirms trend direction when a fast-moving average crosses a slow-moving average.
✅ Fibonacci Levels – Displays key Fibonacci retracement levels to identify potential support and resistance zones.
How It Works:
• The indicator scans for a zero-level price reversal from recent lows.
• It checks if volume is above the average liquidity level to confirm trade strength.
• A bullish MACD crossover is required to ensure upward momentum.
• A moving average crossover provides additional confirmation.
• Fibonacci retracement levels help traders identify key price zones for entry or exit.
Alerts & Notifications:
• The indicator plots buy signals directly on the chart.
• TradingView alerts can be set up to notify traders when all conditions align.
• Telegram integration allows automatic notifications for trade opportunities.
This tool is ideal for traders looking for a systematic and multi-confirmation approach to identifying potential buy opportunities.

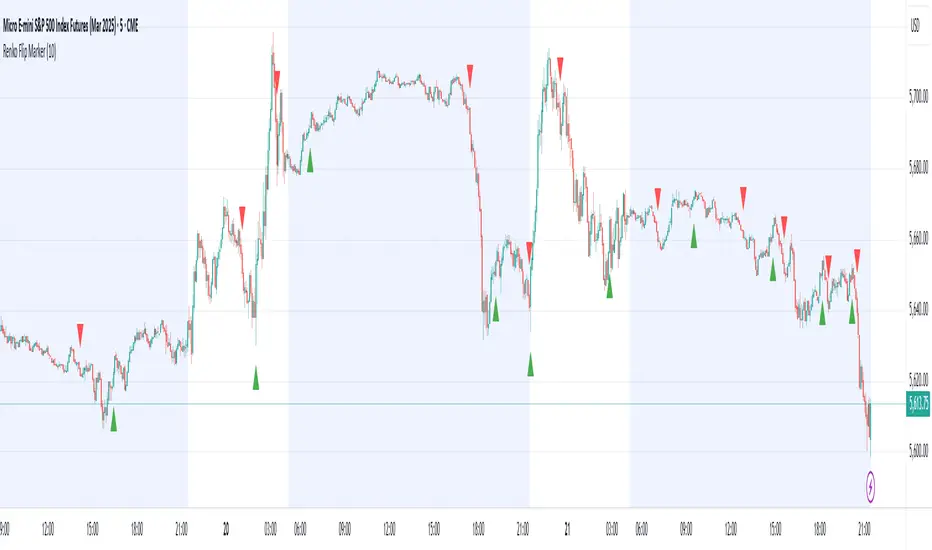
Renko Flip MarkerThis script shows on chart where Renko bricks flip for candlestick chart. I intended it for candlestick chart, but it seems to work Renko chart too from my testing so far. You may change the Renko size for your own scenario you're trading. Hopefully helps, Thank you.
Intraday MA55 Swing PatternsHow This Code Works
Moving Average & Tolerance:
The script calculates the 55‑period moving average (ma55) and then checks if the current price is within a given percentage (tolerancePerc) of the MA.
Trend & Swing Conditions:
It defines an uptrend (price above MA55 and MA55 rising) and a downtrend (price below MA55 and MA55 falling). It then looks at the previous candle for an “acknowledgeable” down swing (for a bullish setup) or an up swing (for a bearish setup) using the user‑defined swingThreshold.
Candlestick Patterns:
Three bullish patterns are defined:
• Bullish Engulfing
• Bullish Wick (a bullish candle with a long lower wick)
• Bullish Doji (small body relative to range)
Similarly, three bearish patterns are defined with inverse logic.
Signal Conditions:
A buy signal is generated only when:
The market is in an uptrend
Price is near the MA55
The previous candle shows a down swing
One of the bullish candlestick patterns appears in the current candle
A sell signal is generated using the opposite conditions.
Plotting & Alerts:
The MA55 is plotted, and buy/sell signals are marked with shapes and optional labels. Alerts are set up so you can use TradingView’s alert system.

Symmetric cost of each candle (SH)This indicator makes Calculation of the symmetric cost of each candle and
Placing a point or small line attached to each candle itself.

Inside Bar Screener (4H, 1D, 1W)This script is to screen in pine screener any asset that has an insider bar on 4h, 1 Day or 1 Week timeframe. This is a powerful strategy to look for assets that are about to move after a consolidation.


Inside-Bar-scan-displayThis indicator is for displaying inside bar conditions on multiple time frame and also useful for pine screener to select stocks and other assets meeting the criteria.

Potential Reversal in Downtrend (Weekly timeframe)$$$ Weekly Reversal Condition Indicator $$$
### Overview ###
The Weekly Reversal Condition Indicator is designed to identify potential reversals in a downtrend on the weekly timeframe. It highlights candles where the current week's close, high, and low exceed the previous week's high and low, signaling a potential strong uptrend.
### Key Features ###
✅ Detects potential bullish reversals based on weekly high, low, and close values.
✅ Marks reversal signals with a green arrow above the candle.
✅ Highlights reversal candles in pink for better visibility.
✅ Helps traders identify momentum shifts and reversal opportunities.
### **Usage** ###
✅ Apply this indicator to a weekly chart for optimal results.
✅ Watch for pink-highlighted candles as potential reversal signals in a downtrend.
✅ Most importantly, next week's candle should not break the close of the highlighted candle.
It can be used alongside other technical indicators for confirmation.
🚀 Try it out and refine your trading strategy!
**Disclaimer**: Make investment decisions based on your own research and trading strategy. This indicator is for educational purposes only and does not constitute buy or sell recommendations.

Alireza Custom FVGThe indicator plots Fair Value Gaps (FVGs) and automatically removes any gap once it's filled or touched by price.

In-Bar Table & ScreenerInside bar screener for multiple timeframes to enable take timely trade entry.

Inside Bar Table & Screenerinside bar pine screener to allow for screening of inside bars at multiple timeframes

Dynamic Breakout Breakdown Trackerbreak out and break down calculator
you can calculate break out and break down from this indicator and this will calculate the levels dynamically

Inside Bar Table ScannerThis script is to see if a inside bar exists at 15 min , 1 hour , 1 day or 1 week duration. This will help take up a trade position since inside bar is a very powerful momentum pre cursor.

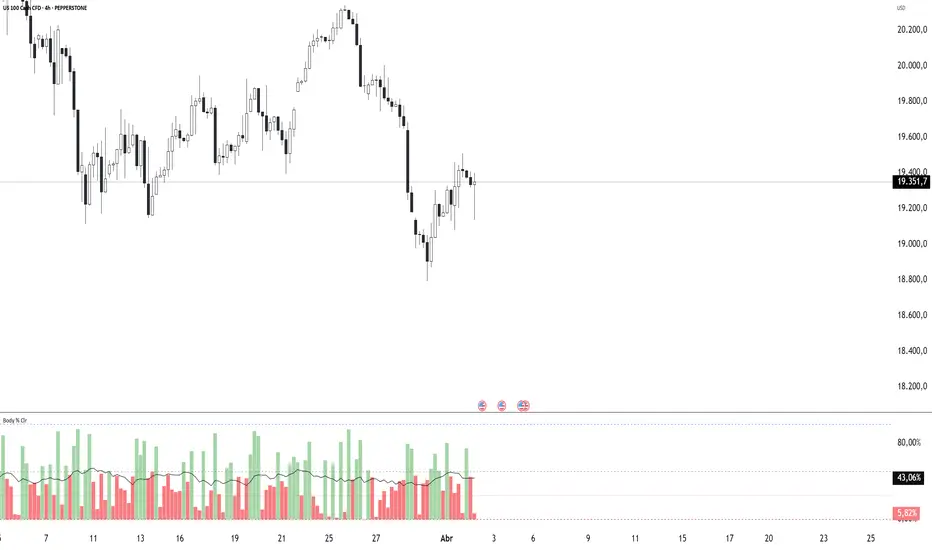
Body Percentage of Range (Colored)Short Description:
This indicator measures the dominance of the candle's body relative to its total range (High - Low), providing a visual gauge of intra-candle strength versus indecision. Columns are colored based on whether the body constitutes more or less than a defined percentage (default 50%) of the candle's total height.
Detailed Description:
What it Does:
The "Body Percentage of Range" indicator calculates, for each candle, what percentage of the total price range (High minus Low) is occupied by the candle's body (absolute difference between Open and Close).
A value of 100% means the candle has no wicks (a Marubozu), indicating strong conviction during that period.
A value of 0% means the candle has no body (a Doji), indicating perfect indecision.
Values in between show the relative balance between the directional move (body) and the price exploration/rejection (wicks).
How to Interpret:
The indicator plots this percentage as columns:
Column Height: Represents the percentage of the body relative to the total range. Higher columns indicate a larger body dominance.
Column Color:
Green Columns: Appear when the body percentage is above the user-defined threshold (default 50%). This suggests that the directional move within the candle was stronger than the indecision (wicks). Often seen during trending moves or strong momentum candles.
Red Columns: Appear when the body percentage is at or below the user-defined threshold (default 50%). This suggests that wicks dominate the candle (body is 50% or less of the range), indicating significant indecision, struggle between buyers and sellers, or potential reversals. These are common in choppy, consolidating, or reversal market conditions.
Orange Line (Optional MA): A Simple Moving Average (SMA) of the body percentages is plotted to help smooth the readings and identify broader periods where candle structure indicates more trending (high MA) vs. ranging/indecisive (low MA) characteristics.
Potential Use Cases:
Identifying Choppy vs. Trending Markets: Sustained periods of low, predominantly red columns (and often a low/declining MA) can signal a choppy, range-bound market where trend-following strategies might underperform. Conversely, periods with frequent high, green columns suggest a more trending environment.
Confirming Breakouts/Momentum: High green columns appearing alongside increased volume during a breakout can add conviction to the move's strength.
Spotting Potential Exhaustion/Reversals: A very tall green column after a strong trend, followed immediately by a low red column (like a Doji or Spinning Top pattern appearing on the price chart), might signal potential exhaustion or a pending reversal, indicating indecision has suddenly entered the market.
Filtering Entries: Traders might avoid taking entries (especially trend-following ones) when the indicator shows a consistent pattern of low red columns, suggesting high market indecision.
Settings:
Color Threshold %: Allows you to set the percentage level above which columns turn green (default is 50%).
Smoothing MA Length: Adjusts the lookback period for the Simple Moving Average.
Disclaimer:
This indicator is a tool for technical analysis and should be used in conjunction with other methods (like price action, volume analysis, other indicators) and robust risk management. It does not provide direct buy/sell signals and past performance is not indicative of future results.
ICT HTF Candles (mod)ICT HTF Candles (mod)
This indicator is designed to display candles from multiple higher timeframes (HTFs) directly onto your current chart. It is particularly useful for traders practicing ICT (Inner Circle Trader) methods or anyone who needs to visually analyze higher timeframe structures, Fair Value Gaps (FVG), and Volume Imbalances.
Key Features:
Multiple HTFs: Display candles from up to six higher timeframes simultaneously (e.g., 5min, 15min, hourly, daily, weekly).
Fair Value Gaps (FVG): Automatically highlights areas of liquidity imbalance to easily spot potential trade setups.
Volume Imbalances: Clearly marks zones where volume imbalances occur between candles, enhancing market structure visibility.
Sweep Detection: Highlights candles that sweep previous highs or lows, identifying potential liquidity grabs.
Customizable Styling: Adjust colors, widths, spacing, and visibility to match your preferences.
Remaining Time Labels: Shows the remaining time until the close of each higher timeframe candle directly on the chart.
Trace Lines: Optional horizontal lines marking open, high, low, and close of higher timeframe candles with customizable appearance.
This indicator streamlines multi-timeframe analysis, making it easier to identify trade setups, liquidity points, and key market structures quickly.
Credits to original creator @fadizeidan. Modified and enhanced by @dauletico.

MT5-auto-trade with nQQE, RSI, and Supply/Demand Filteringday la mot phat minh moi cua toi- toi se co gang phat trien no

Order Block Candle [TradeWithRon]Order Block Candle
This indicator is designed to help traders identify and visualize key movements within the market. These order blocks are areas where significant buying or selling has occurred, often leading to a strong price reaction. This script detects both bullish and bearish order blocks (with volume spike), marking them directly on your chart, and offers a variety of customization options to enhance your trading experience.
Features:
Bullish and Bearish Candles: Bullish Order Block: Identified when the current price creates a higher high and closes above the previous price, indicating a zone of potential buying activity by institutional traders.
Bearish Order Block: Identified when the current price creates a lower low and closes below the previous price, suggesting strong institutional selling.
Volume-Weighted Analysis: The indicator allows traders to incorporate volume into the order block detection. When a volume pivot (a significant change in volume) is detected, it strengthens the validity of the identified order block.
Customizable Visuals:
- Users can adjust the color and style of order block lines, including solid, dashed, or dotted styles, to suit personal preferences.
- Bullish Order Block Color: Choose from a range of colors to highlight bullish order blocks (default is green).
- Bearish Order Block Color: Choose a color for bearish order blocks (default is red).
- Users can also customize the color and style of the lines representing order blocks, helping traders visually track key levels.
Candle Body or. Wick: The indicator provides flexibility in defining the price range of the order block. Traders can choose whether to calculate the order block using the candle body (open and close) or the full wick (high and low) to suit their trading strategy.
Dynamic Line Extensions: Order block lines are dynamically extended to provide ongoing support and resistance levels. When a price breaks an order block line, the line changes to a dotted style, marking it as "broken." This allows traders to easily spot when the market invalidates an order block.
Alerts:
- Alert for Bullish Order Block: Get notified when a new bullish order block is detected.
- Alert for Bearish Order Block: Receive alerts when a bearish order block is identified.
- Alert for Broken Lines: Set up alerts to be notified when a bullish or bearish order block line is broken, giving traders a signal for potential market shifts.
Zone Management:
- The indicator tracks upper and lower zone information, marking significant price levels where institutional buying or selling might occur. Traders can adjust settings to define how many previous lines should be displayed on the chart for reference.
Optional Mitigated Order Blocks:
- A feature that highlights mitigated (neutralized) order blocks with a specific color and line style, offering additional insight into market behavior.
Input Settings:
- Length: The number of bars to the left and right of a pivot point for it to be considered a high or low.
- Candle Body: Option to use the candle body for calculations (as opposed to the wick).
- Bullish and Bearish Candle Color: Customizable colors for bullish and bearish order blocks.
- Open Line Style: Choose between solid, dashed, or dotted line styles for order block visualization.
- Removed Old Lines: Control the number of broken lines shown on the chart.
- Mitigated Line Style: Select line style for mitigated order blocks.
- Volume Use: Enable volume-based detection for stronger order block validation.
How to Use:
This indicator is ideal for traders looking to trade around institutional support and resistance levels. The bullish and bearish order blocks can serve as key entry or exit points, while broken lines offer dynamic support/resistance that adapt to market changes. Use the alerts to stay informed of critical market developments and adjust your trading strategy accordingly.
🔶 Disclaimer
Use with Caution: This indicator is provided for educational and informational purposes only and should not be considered as financial advice. Users should exercise caution and perform their own analysis before making trading decisions based on the indicator's signals.
Not Financial Advice: The information provided by this indicator does not constitute financial advice, and the creator (Tradewithron) shall not be held responsible for any trading losses incurred as a result of using this indicator.
Backtesting Recommended: Traders are encouraged to backtest the indicator thoroughly on historical data before using it in live trading to assess its performance and suitability for their trading strategies.
Risk Management: Trading involves inherent risks, and users should implement proper risk management strategies, including but not limited to stop-loss orders and position sizing, to mitigate potential losses.
No Guarantees: The accuracy and reliability of the indicator's signals cannot be guaranteed, as they are based on historical price data and past performance may not be indicative of future

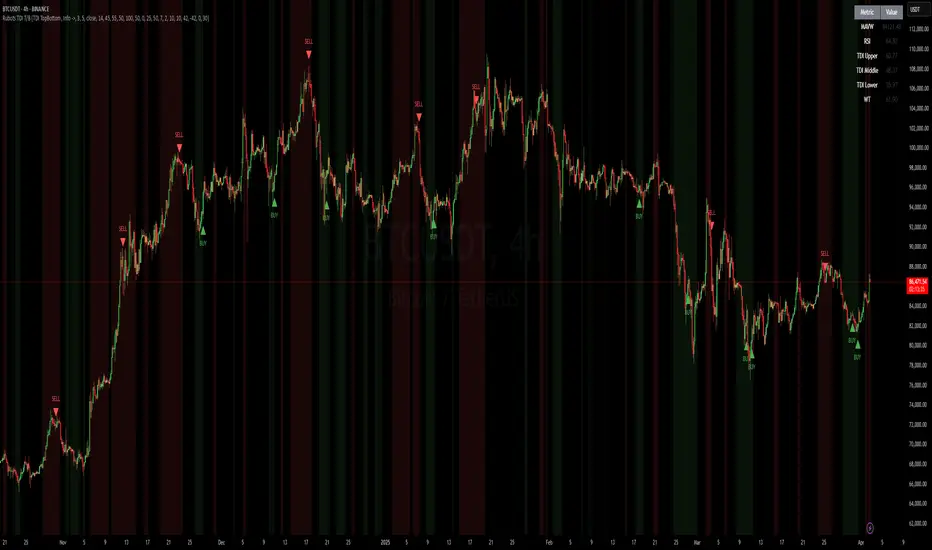
Rubotics TDI Top/Bottom Indicator**Rubotics TDI Top/Bottom Indicator (Rubots TDI T/B)**
This proprietary indicator integrates several technical analysis tools into one cohesive system to help traders identify potential top and bottom signals directly on the price chart. Unlike standard indicators that merely plot common metrics, this script uniquely fuses a custom moving average algorithm with established oscillators to enhance signal clarity and market timing.
**Core Components and Unique Features:**
- **Global Visual Settings:**
- Easily toggle visual elements (tables, background highlights) that display key metrics and trading setup information.
- Provides a detailed on-chart display of strategy data and essential trading parameters.
- **MAVW Calculation (Proprietary):**
- Computes a series of weighted moving averages using Fibonacci-inspired lengths (3, 5, 8, 13, 21, 34) to generate a dynamic moving average (MAVW).
- The MAVW line is color-coded—blue when trending upward, red when trending downward, and yellow when neutral—to offer an immediate visual cue of market direction.
- **RSI Module:**
- Calculates the RSI on a user-selected price source (default: close) with a customizable period (default: 14).
- Adjustable thresholds (default: 45 and 55) allow for fine-tuning of overbought and oversold conditions.
- **TDI Component:**
- Adapts the RSI into a dynamic channel using a simple moving average and a scaled standard deviation (multiplied by 1.6185) to form upper and lower bands.
- Incorporates both fast and slow moving averages (default periods: 2 and 7) with optional band filling to visually highlight momentum changes.
- **Note:** The TDI logic is based on public methodologies for converting RSI data into a dynamic indicator.
- **WaveTrend Oscillator:**
- Uses configurable channel and smoothing parameters to generate a WaveTrend line for additional momentum confirmation.
- The oscillator is used to further validate top and bottom signals by identifying overbought or oversold conditions.
- **Note:** The WaveTrend calculations are derived from widely available, public-domain techniques.
- **Signal Generation:**
- **Buy Signal:** Generated when the RSI is below its lower threshold, the TDI fast MA crosses above the lower band (with prior bar confirmation), the price is below the MAVW, and the WaveTrend indicates oversold conditions.
- **Sell Signal:** Generated when the RSI is above its upper threshold, the TDI fast MA crosses below the upper band (with prior bar confirmation), the price is above the MAVW, and the WaveTrend signals overbought conditions.
- Signals are visually marked on the chart with upward and downward triangles and accompanied by alert conditions.
- **Volume-Based Bar Coloring & Additional Visuals:**
- Colors price bars based on volume relative to a moving average to highlight the strength of moves.
- Provides background color changes and a dynamic table of key metric values (MAVW, RSI, TDI bands, WaveTrend) for real-time analysis.
**Customization and Originality:**
- Extensive input parameters allow traders to adjust each component to suit their trading style and market conditions.
- The unique combination of the proprietary MAVW calculation with traditional RSI, TDI, and WaveTrend elements creates a robust system for detecting market tops and bottoms.
- **Closed-Source Justification:**
This indicator is published as a closed-source script due to the proprietary enhancements integrated into the MAVW algorithm and signal generation logic. These unique modifications provide added value beyond standard public indicators.