TechniTrend: Advance Custom Candle Finder (CCF)🟦 Description:
The TechniTrend: Advanced Custom Candle Finder (CCF) is a versatile tool designed to help traders identify custom candlestick patterns using various configurable criteria. This indicator provides a flexible framework to filter and highlight specific candles based on volume, volatility, candle characteristics, and other important metrics. Below is a detailed explanation of each filter and its customization options:
🟦 Volume-Based Filters
🔸Volume Spike Filter:
Enable filtering based on volume spikes. Use the Volume Spike Multiplier to define what constitutes a significant increase in volume compared to the average. A spike indicates unusually high trading interest.
🔸Volume Range Filter:
Filter candles based on specific volume ranges. Set Minimum Volume and Maximum Volume thresholds to isolate candles with trading volumes within your desired boundaries.
🟦 Candle Body & Wick Filters
🔸Body Size Filter:
Filter candles based on the size of their body. A Body Size Multiplier determines what is considered a large body relative to historical averages.
🔸Body Percentage Filter:
Filter based on the proportion of the body to the entire candle size. Use the Body Percentage Threshold to highlight candles where the body makes up a certain percentage of the total candle range.
🔸Wick-to-Body Ratio Filter:
Identify candles with specific wick-to-body ratios. A higher Wick-to-Body Ratio can indicate indecision or reversals.
🟦 Volatility & Range Filters
🔸Volatility Filter:
Highlight candles based on price changes relative to volume. The Volatility Multiplier sets the threshold for what is considered a volatile candle.
🔸Candle Range Filter:
Filter based on the range (High - Low) of each candle. Use Minimum Candle Range and Maximum Candle Range to specify your desired candle size in points or pips.
🔸Short-Term and Long-Term Volatility Filters:
Analyze volatility over different periods. Enable Short-Term Volatility or Long-Term Volatility filters to compare recent volatility against historical averages, helping you detect sudden market shifts.
🟦 Candle Color & Open/Close Filters
🔸Candle Color Filter:
Filter based on the candle's color. Choose between Bullish (close > open) or Bearish (close < open) to focus on specific market sentiments.
🔸Open/Close Price Range Filter:
Filter based on the difference between the open and close prices. Use Minimum Open/Close Range and Maximum Open/Close Range to specify your acceptable range in price movements.
🟦 Core Functionality
The CCF indicator combines these filters to provide a final signal whenever a candle meets all the enabled criteria. By default, it highlights any qualifying candle directly on the chart and changes the background color for added visibility.
🟦 Key Features:
🔸Highly Customizable Filters: Adjust the parameters for each filter to tailor the indicator to your specific needs.
🔸Multiple Conditions: Combine several conditions to identify complex candlestick patterns.
🔸Real-Time Alerts: Receive instant notifications when a matching candle pattern is found based on your custom criteria.
🟦 How to Use:
🔸Enable the filters you wish to apply (e.g., Volume Spike, Candle Body Size, Volatility).
🔸Adjust the thresholds for each filter to fine-tune the pattern recognition criteria.
🔸Observe the chart to see visual cues for candles that match your specified conditions.
🟦 Notes:
🔸Ensure that you clearly understand each filter’s role. Over-filtering with very strict criteria may reduce the number of signals.
🔸This indicator is designed to be a customizable tool, not providing buy or sell recommendations.
🔸Use in combination with other analysis tools and indicators for the best results.
Priceaction

Market structureHi all!
This script shows you the market structure. You can choose to show internal market structure (with pivots of a default length of 5) and swing market structure (with pivots of a default length of 50). For these two trends it will show you:
• Break of structure (BOS)
• Change of character (CHoCH) (mandatory)
• Equal high/low (EQH/EQL)
It's inspired by "Smart Money Concepts (SMC) " by LuxAlgo that will also show you the market structure.
It will create the two market structures depending on the pivots found. Both of these market structures can be enabled/disabled. The pivots length can be configured separately. The pivots found will be the 'base' of this indicator and will show you when price breaks it. When that happens a break of structure or a change of character will be created. The latest 5 pivots found within the current trends will be kept to take action on. The internal market structure is shown with dashed lines and swing market structure is shown with solid lines.
A break of structure is removed if an earlier pivots within the same trend is broken. Like in the images below, the first pivot (in the first image) is removed when an earlier pivot's higher price within the same trend is broken (the second image):
Equal high/lows have a pink zone (by default but can be changed by the user). These zones can be configured to be extended to the right (off by default). Equal high/lows are only possible if it's not been broken by price and if a later bar has a high/low within the limit it's added to the zone (without it being more 'extreme' (high or low) then the previous price). A factor (percentage of width) of the Average True Length (of length 14) that the pivot must be within to to be considered an Equal high/low. This is configurable and sets this 'limit' and is 10 by default.
You are able to show the pivots that are used. "HH" (higher high), "HL" (higher low), "LH" (lower high), "LL" (lower low) and "H"/"L" (for pivots (high/low) when the trend has changed) are the labels used.
This script has proven itself useful for me to quickly see how the current market is. You can see the pivots (price and bar) where break of structure or change of character happens to see the current trends. I hope that you will find this useful for you.
When programming I focused on simplicity and ease of read. I did not focus on performance, I will do so if it's a problem (haven't noticed it is one yet).
You can set alerts for when a change of character happens. You can configure it to fire on when it happens (all or once per bar) but it defaults to 'once_per_bar_close' to avoid repainting. This has the drawback to alert you when the bar closes.
TLDR: this is an indicator showing you the market structure (break of structures and change of characters) using swing points/pivots. Two trends can be shown, internal (with pivots of length of 5) and swing (with pivots of the length of 50).
Best of trading luck!

Support & Resistance AI LevelScopeSupport & Resistance AI LevelScope
Support & Resistance AI LevelScope is an advanced, AI-driven tool that automatically detects and highlights key support and resistance levels on your chart. This indicator leverages smart algorithms to pinpoint the most impactful levels, providing traders with a precise, real-time view of critical price boundaries. Save time and enhance your trading edge with effortless, intelligent support and resistance identification.
Key Features:
AI-Powered Level Detection: The LevelScope algorithm continuously analyzes price action, dynamically plotting support and resistance levels based on recent highs and lows across your chosen timeframe.
Sensitivity Control: Customize the sensitivity to display either major levels for a macro view or more frequent levels for detailed intraday analysis. Easily adjust to suit any trading style or market condition.
Level Strength Differentiation: Instantly recognize the strength of each level with visual cues based on how often price has touched each one. Stronger levels are emphasized, highlighting areas with higher significance, while weaker levels are marked subtly.
Customizable Visuals: Tailor the look of your chart with customizable color schemes and line thickness options for strong and weak levels, ensuring clear visibility without clutter.
Proximity Alerts: Receive alerts when price approaches key support or resistance, giving you a heads-up for potential market reactions and trading opportunities.
Who It’s For:
Whether you're a day trader, swing trader, or just want a quick, AI-driven way to identify high-probability levels on your chart, Support & Resistance AI LevelScope is designed to keep you focused and informed. This indicator is the perfect addition to any trader’s toolkit, empowering you to make more confident, data-backed trading decisions with ease.
Upgrade your analysis with AI-powered support and resistance—no more manual lines, only smart levels!

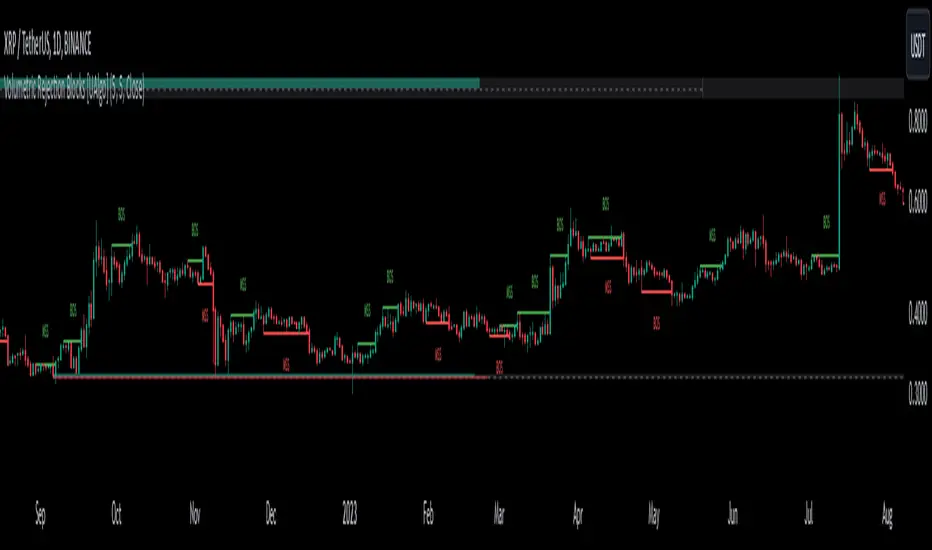
Volumetric Rejection Blocks [UAlgo]The Volumetric Rejection Blocks is designed to help traders identify and visualize key price levels where volumetric rejections occur, which may indicate a shift in market sentiment. These rejections can signal potential trend reversals or areas where price action is likely to face support or resistance. By drawing rejection blocks based on volumetric strength, the indicator allows users to observe where significant buying or selling pressure has been exerted, which can be used as a reference point for future price action.
Also indicator dynamically calculates swing highs and lows, analyzes bullish and bearish strengths based on volume-weighted price movements, and displays rejection blocks on the chart. Each rejection block represents an area where the price attempted to move beyond a certain level but faced rejection, either on a close or wick basis. This can be particularly useful for traders who rely on market structure and order flow to make informed decisions about entering or exiting trades.
🔶 Key Features
Swing Length Customization: Allows users to define the swing length, helping tailor the sensitivity of the swing high and low detection to the specific market conditions.
Rejection Block Visualization: Displays up to the last 10 rejection blocks based on user settings, clearly marking areas of significant bullish or bearish rejections.
Volumetric Strength Analysis: The indicator calculates bullish and bearish strength for each rejection block, based on volume-weighted price movements over the last few bars, giving insight into the intensity of the rejection.
Violation Check Type: Offers two options for violation detection—"Close" and "Wick". This allows traders to specify whether a price level is considered broken only if it closes beyond the level or if any wick breaches it.
Bullish and Bearish Block Coloring: Rejection blocks are colored to represent bullish (green) and bearish (red) rejection areas. The color transparency can be adjusted for clear visibility overlaid on the price chart.
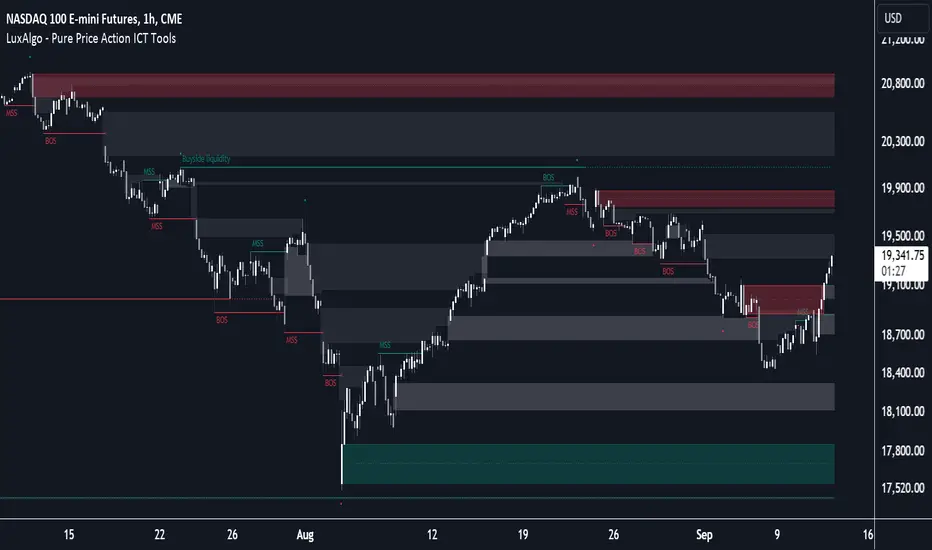
Market Structure Labels: Labels and lines marking "Market Structure Shift" (MSS) and "Break of Structure" (BOS) are displayed, giving traders context about significant market structure changes.
🔶 Interpreting the Indicator
Rejection Blocks: These colored blocks on the chart indicate areas where the price faced significant buying or selling pressure. A green block suggests a bullish rejection (support zone), where buyers absorbed the sell-off, potentially pushing the price upward. Conversely, a red block indicates a bearish rejection (resistance zone), where sellers overpowered buyers, potentially driving the price lower.
Strength Analysis: The width of the green and red sections within a rejection block represents the relative bullish and bearish strengths. A wider green section indicates stronger bullish support, while a wider red section suggests more robust bearish resistance. This helps traders gauge the likelihood of price holding or breaching these levels.
Market Structure Shift (MSS) and Break of Structure (BOS): The indicator automatically detects and labels significant changes in market structure. An "MSS" label indicates the first break, suggesting a potential shift in trend direction. A "BOS" label indicates a subsequent confirmation in trend direction, allowing traders to recognize potential trend continuations.
Violation Check: Traders can choose how to interpret breaks of these rejection blocks. Using the "Close" option provides a more conservative approach, requiring a close beyond the level for confirmation. The "Wick" option is more aggressive, treating any wick beyond the level as a break.
🔶 Disclaimer
Use with Caution: This indicator is provided for educational and informational purposes only and should not be considered as financial advice. Users should exercise caution and perform their own analysis before making trading decisions based on the indicator's signals.
Not Financial Advice: The information provided by this indicator does not constitute financial advice, and the creator (UAlgo) shall not be held responsible for any trading losses incurred as a result of using this indicator.
Backtesting Recommended: Traders are encouraged to backtest the indicator thoroughly on historical data before using it in live trading to assess its performance and suitability for their trading strategies.
Risk Management: Trading involves inherent risks, and users should implement proper risk management strategies, including but not limited to stop-loss orders and position sizing, to mitigate potential losses.
No Guarantees: The accuracy and reliability of the indicator's signals cannot be guaranteed, as they are based on historical price data and past performance may not be indicative of future results.
Engulfing Pattern & Impulse [UAlgo]The Engulfing Pattern & Impulse is a tool designed for technical traders who utilize price action and volume analysis to assess market trends and potential reversals. This indicator identifies two powerful trading signals: Engulfing Patterns and Volume Impulses, which are essential components for evaluating potential bullish or bearish market momentum.
Engulfing Patterns are classic candlestick formations often associated with reversals or trend continuations, depending on the overall trend context. This indicator highlights both bullish and bearish engulfing patterns based on configurable criteria such as trend detection settings, comparison with average body size, and a customizable body multiplier for validation. The Volume Impulse feature signals moments of significant volume compared to historical levels, which often precede substantial price movements. Together, these features provide traders with a versatile tool for better timing entry and exit points.
The indicator also offers an adaptive trend detection system, allowing traders to choose from multiple methods (e.g., SMA50 or SMA50/SMA200 combinations) to assess the trend context, making it ideal for various market conditions.
🔶Key Features
Engulfing Pattern Detection: Identifies bullish and bearish engulfing patterns with customizable parameters, including body length and average size comparison.
Configurable trend basis: Choose between SMA50 or SMA50 with SMA200 to define trend direction.
Body size multiplier: Adjust the size threshold for valid engulfing patterns, providing flexibility based on market conditions.
Volume Impulse Signal: Highlights volume spikes that meet or exceed a specified multiplier, which can indicate increased buying or selling interest.
Customizable volume period and multiplier: Allows you to tailor the volume impulse detection based on the instrument’s average volume behavior.
Trend Detection Options: Select different trend detection methods to suit various trading styles and instruments.
SMA50-based detection: Classifies the trend based on the position of price relative to the 50-period SMA.
SMA50 and SMA200 combination: Incorporates a dual-moving average approach, classifying trends based on the relationship between price, SMA50, and SMA200.
Enhanced Visualization: Distinguishes bullish and bearish signals with customizable colors, providing clear and immediate visual cues for easy interpretation.
Custom label colors: Allows you to set distinct colors for bullish, bearish, and neutral signals for quick identification.
Pattern filtering: Enable or disable specific patterns (Bullish, Bearish, or Both) based on your trading preferences.
🔶 Interpreting Indicator
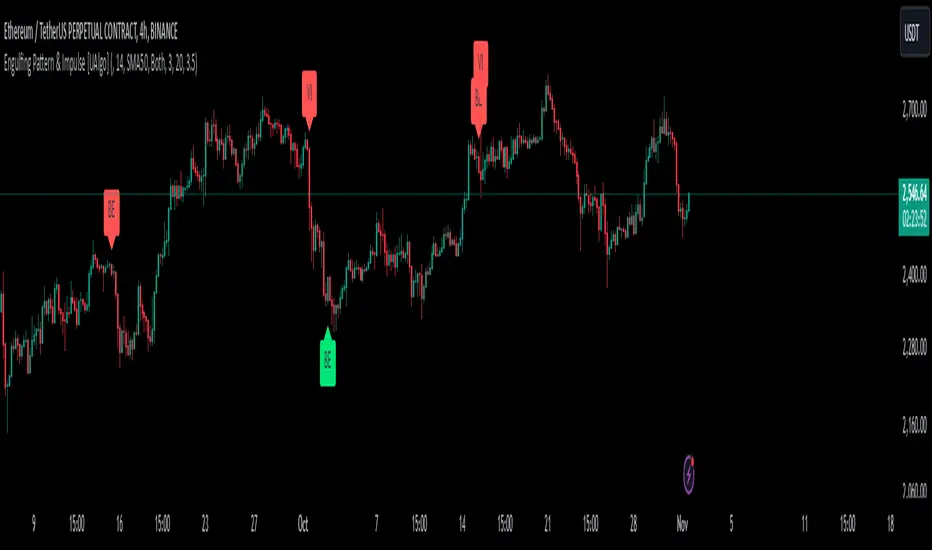
Bullish Engulfing Pattern: Indicates a potential bullish reversal in a downtrend. This signal occurs when a white candlestick with a body size exceeding a specified multiplier completely engulfs the previous black candlestick. The pattern will display a “BE” label below the candle if it meets the criteria, signaling potential upward momentum.
Bearish Engulfing Pattern: Indicates a potential bearish reversal in an uptrend. A black candlestick with a body size exceeding the specified multiplier fully engulfs the previous white candlestick, signaling possible downward movement. The “BE” label appears above the candle to denote this pattern.
Volume Impulse Up: Displays a “VI” label below the candle when the volume surpasses the defined multiplier, and the price closes higher than it opened, indicating strong upward buying interest.
Volume Impulse Down: Displays a “VI” label above the candle when the volume meets or exceeds the specified threshold, and the price closes lower than it opened, signaling strong selling pressure.
Indicator uses the SMA50 and SMA200 to determine trend direction due to their popularity in technical analysis as indicators of medium- and long-term trends. The SMA50 reflects the average price over the past 50 periods, providing insight into intermediate trends, while the SMA200 is often used to identify the broader trend direction. These SMAs help traders quickly assess whether the market is in an uptrend, downtrend, or consolidation phase, enhancing decision-making for both short-term and long-term strategies.
🔶 Disclaimer
Use with Caution: This indicator is provided for educational and informational purposes only and should not be considered as financial advice. Users should exercise caution and perform their own analysis before making trading decisions based on the indicator's signals.
Not Financial Advice: The information provided by this indicator does not constitute financial advice, and the creator (UAlgo) shall not be held responsible for any trading losses incurred as a result of using this indicator.
Backtesting Recommended: Traders are encouraged to backtest the indicator thoroughly on historical data before using it in live trading to assess its performance and suitability for their trading strategies.
Risk Management: Trading involves inherent risks, and users should implement proper risk management strategies, including but not limited to stop-loss orders and position sizing, to mitigate potential losses.
No Guarantees: The accuracy and reliability of the indicator's signals cannot be guaranteed, as they are based on historical price data and past performance may not be indicative of future results.
SuperATR 7-Step Profit - Strategy [presentTrading] Long time no see!
█ Introduction and How It Is Different
The SuperATR 7-Step Profit Strategy is a multi-layered trading approach that integrates adaptive Average True Range (ATR) calculations with momentum-based trend detection. What sets this strategy apart is its sophisticated 7-step take-profit mechanism, which combines four ATR-based exit levels and three fixed percentage levels. This hybrid approach allows traders to dynamically adjust to market volatility while systematically capturing profits in both long and short market positions.
Traditional trading strategies often rely on static indicators or single-layered exit strategies, which may not adapt well to changing market conditions. The SuperATR 7-Step Profit Strategy addresses this limitation by:
- Using Adaptive ATR: Enhances the standard ATR by making it responsive to current market momentum.
- Incorporating Momentum-Based Trend Detection: Identifies stronger trends with higher probability of continuation.
- Employing a Multi-Step Take-Profit System: Allows for gradual profit-taking at predetermined levels, optimizing returns while minimizing risk.
BTCUSD 6hr Performance
█ Strategy, How It Works: Detailed Explanation
The strategy revolves around detecting strong market trends and capitalizing on them using an adaptive ATR and momentum indicators. Below is a detailed breakdown of each component of the strategy.
🔶 1. True Range Calculation with Enhanced Volatility Detection
The True Range (TR) measures market volatility by considering the most significant price movements. The enhanced TR is calculated as:
TR = Max
Where:
High and Low are the current bar's high and low prices.
Previous Close is the closing price of the previous bar.
Abs denotes the absolute value.
Max selects the maximum value among the three calculations.
🔶 2. Momentum Factor Calculation
To make the ATR adaptive, the strategy incorporates a Momentum Factor (MF), which adjusts the ATR based on recent price movements.
Momentum = Close - Close
Stdev_Close = Standard Deviation of Close over n periods
Normalized_Momentum = Momentum / Stdev_Close (if Stdev_Close ≠ 0)
Momentum_Factor = Abs(Normalized_Momentum)
Where:
Close is the current closing price.
n is the momentum_period, a user-defined input (default is 7).
Standard Deviation measures the dispersion of closing prices over n periods.
Abs ensures the momentum factor is always positive.
🔶 3. Adaptive ATR Calculation
The Adaptive ATR (AATR) adjusts the traditional ATR based on the Momentum Factor, making it more responsive during volatile periods and smoother during consolidation.
Short_ATR = SMA(True Range, short_period)
Long_ATR = SMA(True Range, long_period)
Adaptive_ATR = /
Where:
SMA is the Simple Moving Average.
short_period and long_period are user-defined inputs (defaults are 3 and 7, respectively).
🔶 4. Trend Strength Calculation
The strategy quantifies the strength of the trend to filter out weak signals.
Price_Change = Close - Close
ATR_Multiple = Price_Change / Adaptive_ATR (if Adaptive_ATR ≠ 0)
Trend_Strength = SMA(ATR_Multiple, n)
🔶 5. Trend Signal Determination
If (Short_MA > Long_MA) AND (Trend_Strength > Trend_Strength_Threshold):
Trend_Signal = 1 (Strong Uptrend)
Elif (Short_MA < Long_MA) AND (Trend_Strength < -Trend_Strength_Threshold):
Trend_Signal = -1 (Strong Downtrend)
Else:
Trend_Signal = 0 (No Clear Trend)
🔶 6. Trend Confirmation with Price Action
Adaptive_ATR_SMA = SMA(Adaptive_ATR, atr_sma_period)
If (Trend_Signal == 1) AND (Close > Short_MA) AND (Adaptive_ATR > Adaptive_ATR_SMA):
Trend_Confirmed = True
Elif (Trend_Signal == -1) AND (Close < Short_MA) AND (Adaptive_ATR > Adaptive_ATR_SMA):
Trend_Confirmed = True
Else:
Trend_Confirmed = False
Local Performance
🔶 7. Multi-Step Take-Profit Mechanism
The strategy employs a 7-step take-profit system
█ Trade Direction
The SuperATR 7-Step Profit Strategy is designed to work in both long and short market conditions. By identifying strong uptrends and downtrends, it allows traders to capitalize on price movements in either direction.
Long Trades: Initiated when the market shows strong upward momentum and the trend is confirmed.
Short Trades: Initiated when the market exhibits strong downward momentum and the trend is confirmed.
█ Usage
To implement the SuperATR 7-Step Profit Strategy:
1. Configure the Strategy Parameters:
- Adjust the short_period, long_period, and momentum_period to match the desired sensitivity.
- Set the trend_strength_threshold to control how strong a trend must be before acting.
2. Set Up the Multi-Step Take-Profit Levels:
- Define ATR multipliers and fixed percentage levels according to risk tolerance and profit goals.
- Specify the percentage of the position to close at each level.
3. Apply the Strategy to a Chart:
- Use the strategy on instruments and timeframes where it has been tested and optimized.
- Monitor the positions and adjust parameters as needed based on performance.
4. Backtest and Optimize:
- Utilize TradingView's backtesting features to evaluate historical performance.
- Adjust the default settings to optimize for different market conditions.
█ Default Settings
Understanding default settings is crucial for optimal performance.
Short Period (3): Affects the responsiveness of the short-term MA.
Effect: Lower values increase sensitivity but may produce more false signals.
Long Period (7): Determines the trend baseline.
Effect: Higher values reduce noise but may delay signals.
Momentum Period (7): Influences adaptive ATR and trend strength.
Effect: Shorter periods react quicker to price changes.
Trend Strength Threshold (0.5): Filters out weaker trends.
Effect: Higher thresholds yield fewer but stronger signals.
ATR Multipliers: Set distances for ATR-based exits.
Effect: Larger multipliers aim for bigger moves but may reduce hit rate.
Fixed TP Levels (%): Control profit-taking on smaller moves.
Effect: Adjusting these levels affects how quickly profits are realized.
Exit Percentages: Determine how much of the position is closed at each TP level.
Effect: Higher percentages reduce exposure faster, affecting risk and reward.
Adjusting these variables allows you to tailor the strategy to different market conditions and personal risk preferences.
By integrating adaptive indicators and a multi-tiered exit strategy, the SuperATR 7-Step Profit Strategy offers a versatile tool for traders seeking to navigate varying market conditions effectively. Understanding and adjusting the key parameters enables traders to harness the full potential of this strategy.

Immediate Rebalance ICT [TradingFinder] No Imbalances - MTF Gaps🔵 Introduction
The concept of "Immediate Rebalance" in technical analysis is a powerful and advanced strategy within the ICT (Inner Circle Trader) framework, widely used to identify key market levels.
Unlike the "Fair Value Gap," which leaves a price gap requiring a retracement for a fill, an Immediate Rebalance fills the gap immediately, representing an instant balance that strengthens the prevailing market trend. This structure allows traders to quickly spot critical price zones, capitalizing on strong trend continuations without the need for price retracement.
The "Immediate Rebalance ICT" indicator leverages this concept, providing traders with automated identification of critical supply and demand zones, order blocks, liquidity voids, and key buy-side and sell-side liquidity levels.
Through features like crucial liquidity points and immediate rebalancing areas, this tool enables traders to perform precise real-time market analysis and seize profitable opportunities.
🔵 How to Use
The Immediate Rebalance indicator assists traders in identifying reliable trading signals by detecting and analyzing Immediate Rebalance zones. By focusing on supply and demand areas, the indicator pinpoints optimal entry and exit positions.
Here’s how to use the indicator in both bearish (Supply Immediate Rebalance) and bullish (Demand Immediate Rebalance) structures :
🟣 Bullish Structure (Demand Immediate Rebalance)
In a bullish scenario, the indicator detects a Demand Immediate Rebalance formed by two consecutive bullish candles with overlapping wicks. This structure signifies an immediate demand zone, where price instantly balances within the zone, reducing the likelihood of a revisit and indicating potential upside momentum.
Zone Identification : Look for two consecutive bullish candles with overlapping wicks, forming a demand zone. This structure, due to its rapid balance, usually does not require a revisit and supports further upward movement.
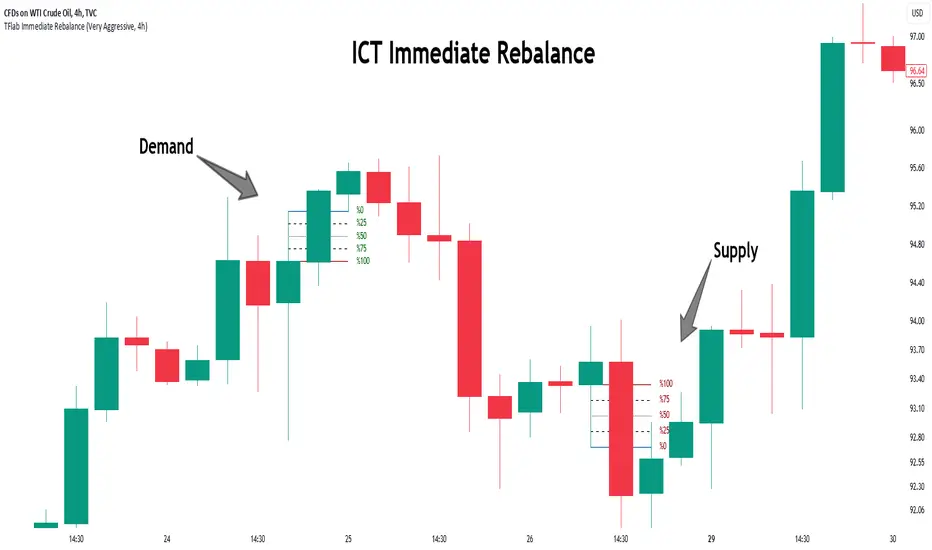
Entry and Exit Levels : If price revisits this zone, percentage markers, particularly 50% and 75%, act as supportive levels, creating ideal entry points for long positions.
Example : In the second image, an example of a Demand Immediate Rebalance is shown, where overlapping bullish candle shadows indicate immediate balance, supporting the continuation of the bullish trend.
🟣 Bearish Structure (Supply Immediate Rebalance)
In a bearish setup, the indicator identifies a Supply Immediate Rebalance when two consecutive bearish candles with overlapping wicks appear. This formation signals an immediate supply zone, suggesting a high probability of trend continuation to the downside, with minimal expectation for price to retrace back to this area.
Zone Identificatio n: Look for two consecutive bearish candles with overlapping shadows. This structure forms a supply area where price is expected to continue its downtrend without revisiting the zone.
Entry and Exit Level s: Should price revisit this zone, percentage-based levels (e.g., 50% and 75%) serve as potential resistance points, optimizing entry for short positions, especially if the downtrend is expected to persist.
Example : The attached chart illustrates a Supply Immediate Rebalance, where overlapping candle shadows define this area, reassuring traders of a continued downward trend with a low likelihood of price returning to this zone.
🔵 Settings
ImmR Filter : This filter allows users to adjust the detection of Immediate Rebalance zones in four modes, from "Very Aggressive" to "Very Defensive," based on zone width. The chosen mode controls the sensitivity of Immediate Rebalance detection, allowing users to fine-tune the indicator to their trading style.
Multi Time Frame : Enabling this option allows users to set the indicator to a specific timeframe (1 minute, 5 minutes, 15 minutes, 30 minutes, 1 hour, 4 hours, daily, weekly, or monthly), broadening the perspective for identifying Immediate Rebalance zones across multiple timeframes.
🔵 Conclusion
The Immediate Rebalance indicator, based on rapid balancing zones within supply and demand areas, serves as a powerful tool for market analysis and improving trade decision-making.
By accurately identifying zones where price achieves instant balance without gaps, the indicator highlights areas likely to support strong trend continuations, exempt from common retracements.
The indicator’s use of percentage levels enables traders to pinpoint optimal entry and exit points more effectively, with levels like 50% and 75% acting as support within demand zones and resistance within supply zones. This empowers traders to ride strong trends without the worry of abrupt reversals.
Overall, the Immediate Rebalance is a reliable tool for both professional and beginner traders seeking precise methods to recognize supply and demand zones, capitalizing on consistent trends.
By choosing appropriate settings and focusing on the zones highlighted by this indicator, traders can enter trades with greater confidence and improve their risk management.
FibExtender [tradeviZion]FibExtender : A Guide to Identifying Resistance with Fibonacci Levels
Introduction
Fibonacci levels are essential tools in technical analysis, helping traders identify potential resistance and support zones in trending markets. FibExtender is designed to make this analysis accessible to traders at all levels, especially beginners, by automating the process of plotting Fibonacci extensions. With FibExtender, you can visualize potential resistance levels quickly, empowering you to make more informed trading decisions without manually identifying every pivot point. In this article, we’ll explore how FibExtender works, guide you step-by-step in using it, and share insights for both beginner and advanced users.
What is FibExtender ?
FibExtender is an advanced tool that automates Fibonacci extension plotting based on significant pivot points in price movements. Fibonacci extensions are percentages based on prior price swings, often used to forecast potential resistance zones where price might reverse or consolidate. By automatically marking these Fibonacci levels on your chart, FibExtender saves time and reduces the complexity of technical analysis, especially for users unfamiliar with calculating and plotting these levels manually.
FibExtender not only identifies Fibonacci levels but also provides a customizable framework where you can adjust anchor points, colors, and level visibility to suit your trading strategy. This customization allows traders to tailor the indicator to fit different market conditions and personal preferences.
Key Features of FibExtender
FibExtender offers several features to make Fibonacci level analysis easier and more effective. Here are some highlights:
Automated Fibonacci Level Identification : The script automatically detects recent swing lows and pivot points to anchor Fibonacci extensions, allowing you to view potential resistance levels with minimal effort.
Customizable Fibonacci Levels : Users can adjust the specific Fibonacci levels they want to display (e.g., 0.618, 1.0, 1.618), enabling a more focused analysis based on preferred ratios. Each level can be color-coded for visual clarity.
Dual Anchor Points : FibExtender allows you to choose between anchoring levels from either the last pivot low or a recent swing low, depending on your preference. This flexibility helps in aligning Fibonacci levels with key market structures.
Transparency and Visual Hierarchy : FibExtender automatically adjusts the transparency of levels based on their "sequence age," creating a subtle visual hierarchy. Older levels appear slightly faded, helping you focus on more recent, potentially impactful levels.
Connection Lines for Context : FibExtender draws connecting lines from recent lows to pivot highs, allowing users to visualize the price movements that generated each Fibonacci extension level.
Step-by-Step Guide for Beginners
Let’s walk through how to use the FibExtender script on a TradingView chart. This guide will ensure that you’re able to set it up and interpret the key information displayed by the indicator.
Step 1: Adding FibExtender to Your Chart
Open your TradingView chart and select the asset you wish to analyze.
Search for “FibExtender ” in the Indicators section.
Click to add the indicator to your chart, and it will automatically plot Fibonacci levels based on recent pivot points.
Step 2: Customizing Fibonacci Levels
Adjust Levels : Under the "Fibonacci Settings" tab, you can enable or disable specific levels, such as 0.618, 1.0, or 1.618. You can also change the color for each level to improve visibility.
Set Anchor Points : Choose between "Last Pivot Low" and "Recent Swing Low" as your Fibonacci anchor point. If you want a broader view, choose "Recent Swing Low"; if you prefer tighter levels, "Last Pivot Low" may be more suitable.
Fib Line Length : Modify the line length for Fibonacci levels to make them more visible on your chart.
Step 3: Spotting Visual Clusters (Manual Analysis)
Identify Potential Resistance Clusters : Look for areas on your chart where multiple Fibonacci levels appear close together. For example, if you see 1.0, 1.272, and 1.618 levels clustered within a small price range, this may indicate a stronger resistance zone.
Why Clusters Matter : Visual clusters often signify areas where traders expect heightened price reaction. When levels are close, it suggests that resistance may be reinforced by multiple significant ratios, making it harder for price to break through. Use these clusters to anticipate potential pullbacks or consolidation areas.
Step 4: Observing the Price Action Around Fibonacci Levels
As price approaches these identified levels, watch for any slowing momentum or reversal patterns, such as doji candles or bearish engulfing formations, that might confirm resistance.
Adjust Strategy Based on Resistance : If price hesitates or reverses at a clustered resistance zone, it may be a signal to secure profits or tighten stops on a long position.
Advanced Insights (for Intermediate to Advanced Users)
For users interested in the technical workings of FibExtender, this section provides insights into how the indicator functions on a code level.
Pivot Point and Swing Detection
FibExtender uses a pivot-high and pivot-low detection function to identify significant price points. The upFractal and dnFractal variables detect these levels based on recent highs and lows, creating the basis for Fibonacci extension calculations. Here’s an example of the code used for this detection:
// Fractal Calculations
upFractal = ta.pivothigh(n, n)
dnFractal = ta.pivotlow(n, n)
By setting the number of periods for n, users can adjust the sensitivity of the script to recent price swings.
Fibonacci Level Calculation
The following function calculates the Fibonacci levels based on the selected pivot points and applies each level’s specific ratio (e.g., 0.618, 1.618) to project extensions above the recent price swing.
calculateFibExtensions(float startPrice, float highPrice, float retracePrice) =>
fibRange = highPrice - startPrice
var float levels = array.new_float(0)
array.clear(levels)
if array.size(fibLevels) > 0
for i = 0 to array.size(fibLevels) - 1
level = retracePrice + (fibRange * array.get(fibLevels, i))
array.push(levels, level)
levels
This function iterates over each level enabled by the user, calculating extensions by multiplying the price range by the corresponding Fibonacci ratio.
Example Use Case: Identifying Resistance in Microsoft (MSFT)
To better understand how FibExtender highlights resistance, let’s look at Microsoft’s stock chart (MSFT), as shown in the image. The chart displays several Fibonacci levels extending upward from a recent pivot low around $408.17. Here’s how you can interpret the chart:
Clustered Resistance Levels : In the chart, note the grouping of several Fibonacci levels in the range of $450–$470. These levels, particularly when tightly packed, suggest a zone where Microsoft may encounter stronger resistance, as multiple Fibonacci levels signal potential barriers.
Applying Trading Strategies : As price approaches this clustered resistance, traders can watch for weakening momentum. If price begins to stall, it may be wise to lock in profits on long positions or set tighter stop-loss orders.
Observing Momentum Reversals : Look for specific candlestick patterns as price nears these levels, such as bearish engulfing candles or doji patterns. Such patterns can confirm resistance, helping you make informed decisions on whether to exit or manage your position.
Conclusion: Harnessing Fibonacci Extensions with FibExtender
FibExtender is a powerful tool for identifying potential resistance levels without the need for manual Fibonacci calculations. It automates the detection of key swing points and projects Fibonacci extensions, offering traders a straightforward approach to spotting potential resistance zones. For beginners, FibExtender provides a user-friendly gateway to technical analysis, helping you visualize levels where price may react.
For those with a bit more experience, the indicator offers insight into pivot points and Fibonacci calculations, enabling you to fine-tune the analysis for different market conditions. By carefully observing price reactions around clustered levels, users can identify areas of stronger resistance and refine their trade management strategies accordingly.
FibExtender is not just a tool but a framework for disciplined analysis. Using Fibonacci levels for guidance can support your trading decisions, helping you recognize areas where price might struggle or reverse. Integrating FibExtender into your trading strategy can simplify the complexity of Fibonacci extensions and enhance your understanding of resistance dynamics.
Note: Always practice proper risk management and thoroughly test the indicator to ensure it aligns with your trading strategy. Past performance is not indicative of future results.
Trade smarter with TradeVizion—unlock your trading potential today!

Market Structure Overlay🚀 Market Structure Overlay Indicator 🚀
🔍 Overview
The Market Structure Overlay (MSO) is a sophisticated technical analysis tool created to analyze price action and understand market structure in a more precise way. It identifies Break of Structure (BOS), Market Structure Breaks (MSBs), Equal Highs (EQH), and Equal Lows (EQL) with meticulous precision by utilizing both wicks and closing prices for better accuracy. The MSO is suitable for all trading timeframes, providing traders with the flexibility to observe and trade on any scale, from intraday to long-term trends.
⚙️ How It Works
The MSO uses advanced logic to detect critical price levels that highlight structural changes in the market. It calculates swing highs and lows using user-defined settings, allowing for customization in market structure analysis. The indicator further highlights BOS and MSB levels by leveraging supply and demand detection, offering a comprehensive understanding of trend reversals and continuation points.
✨ Key features include:
📈 Bullish and Bearish BOS/MSB Lines: MSO differentiates between bullish and bearish structural events, which helps traders understand the prevailing trend and identify key pivot points.
🎨 Customizable Appearance: Traders can personalize line styles and colors for BOS/MSB, trendlines and EQH/EQL, making the tool integrate seamlessly into any chart setup.
🔄 Swing Length and Demand Memory Settings: MSO allows users to specify the swing length for BOS lookback and how many historical zones should be stored on the chart, enhancing control over how much data is analyzed visually.
📊 Market Structure Elements Explained
Break of Structure (BOS): A BOS occurs when the price breaks through a previous Higher High (HH) or Lower Low (LL), indicating a continuation of the current trend. It helps confirm the prevailing market direction.
Market Structure Break (MSB): occurs when a Higher Low (HL) or Lower High (LH) is broken, signaling a potential shift in the market trend. This typically marks the beginning of a trend reversal.
Equal Highs (EQH) and Equal Lows (EQL): These levels are areas of liquidity where previous highs or lows are tested again by the market, often signifying areas of accumulation or distribution. EQH and EQL are crucial for recognizing potential liquidity traps.
Trendlines: Trendlines are used to connect successive highs or lows, providing a visual representation of the current direction of the market. They help traders understand trend momentum and potential breakouts.
🔥 Key Features and Benefits
✅ Accurate Market Structure Detection
The Market Structure Overlay identifies Break of Structure (BOS) and Market Structure Breaks (MSB) events that indicate potential trend changes or continuations. The indicator also distinguishes between bullish and bearish market structures using color-coded lines and custom labels, which helps in immediately identifying market dynamics.
📊 Supply and Demand Zones for BOS/MSB Detection
The MSO uses Supply and Demand Zones as part of the detection logic for BOS and MSB. Although these zones are not directly plotted, they play a key role in determining when a significant structural break occurs. This unique approach enhances the accuracy of BOS and MSB identification, as it takes into account areas of accumulation or distribution that often serve as precursors to trend shifts.
🔍 Equal Highs and Lows Detection
The MSO features Equal Highs (EQH) and Equal Lows (EQL) detection, which is a significant indicator for liquidity zones where potential orders might be resting. These areas often trigger key price actions as they get tested or broken.
⚙️ Customizable Settings
Users can customize the indicator’s behavior, including choosing whether to use candle wicks or closing prices, setting swing lengths for identifying key levels, and specifying memory for storing past zones. This flexibility allows traders to adjust the indicator to suit their personal trading strategy and preferences.
⏱️ Multi-Timeframe Highs and Lows
The indicator includes multi-timeframe support for significant highs and lows (daily, weekly, monthly, yearly). This helps traders understand where they are in the larger market context, especially when making decisions during intra-session trading.
🔎 Precise Detection Approach
Unlike traditional market structure indicators that rely heavily on simple pivot points, the MSO employs a more advanced and precise detection mechanism for BOS and MSB. Traditional pivot points typically use a lookback function to identify highs and lows over a fixed period, which can lead to false signals due to market noise or temporary price fluctuations. In contrast, the MSO records and checks swing and interim points against stored memory, only signaling structural breaks after a thorough evaluation. This results in a non-repainting and highly accurate depiction of market structure, minimizing false alerts and providing traders with reliable insights based on price action that remains consistent once confirmed.
🎨 Visualization Options
The MSO uses color-coded BOS and MSB lines to easily differentiate between bullish and bearish scenarios. Users also have options to visualize equal highs/lows (EQH/EQL) to recognize potential liquidity points. A detailed breakdown of Supply and Demand Zones helps traders identify high-probability areas for entries and exits. Additionally, the indicator allows traders to toggle visibility of key elements, including trend lines, labels, and multi-timeframe levels.
📝 Summary
The Market Structure Overlay is an essential tool for understanding price behavior and structural shifts in any financial market. Its use of sophisticated logic to detect structural breaks, coupled with customizable visualizations, allows traders to gain a nuanced view of market dynamics. The supply and demand zones, together with the BOS, MSB, EQH, and EQL labels, provide a strong foundation for both trend-following and reversal trading strategies.
MSO is not just a tool for understanding market direction—it's designed to enhance decision-making by delivering reliable and actionable insights into market structure. This indicator provides a seamless blend of market theory with advanced technical features, making it a valuable asset for serious traders.
📊 Key Visual Examples:
📈 Bullish and Bearish BOS/MSB Lines
📸
🌀 Trendlines
📸
⚠️ Note:
This indicator should be used as part of a broader trading strategy. Always confirm your entries and exits with additional tools and analysis methods. 💡
Black Tie FibonacciThis indicator plots Yesterday’s, Last Week’s, or Last Month’s Open/Close/High/Low levels, plus Fibonacci retracements and the Optimal Trade Entry (OTE) zone. It includes alerts for each key level, making it perfect for trading reactions on lower timeframes (15m-5m).
The goal of all my indicators is to save you time on manual charting—because making money shouldn’t mean being glued to a screen.
Hope you enjoy it,

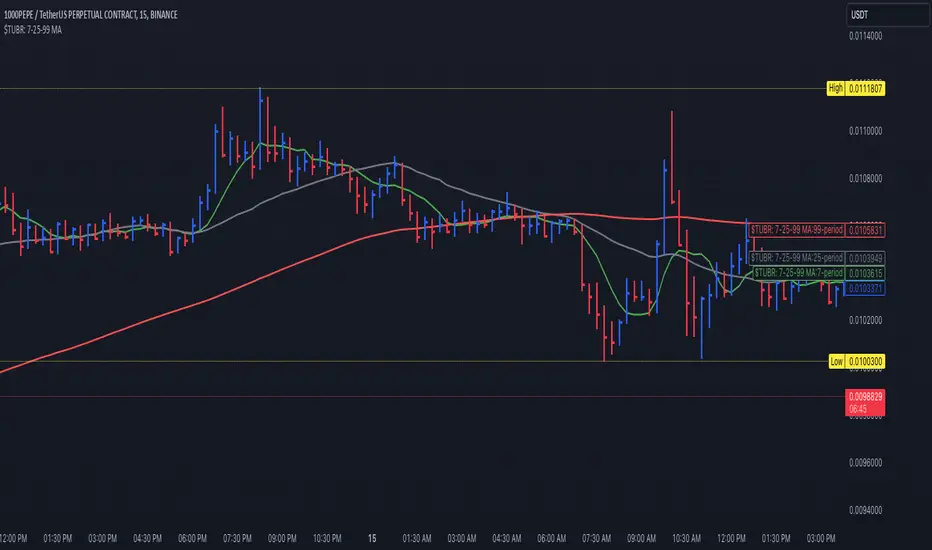
$TUBR: 7-25-99 Moving Average7, 25, and 99 Period Moving Averages
This indicator plots three moving averages: the 7-period, 25-period, and 99-period Simple Moving Averages (SMA). These moving averages are widely used to smooth out price action and help traders identify trends over different time frames. Let's break down the significance of these specific moving averages from both supply and demand perspectives and a price action perspective.
1. Supply and Demand Perspective:
- 7-period Moving Average (Short-Term) :
The 7-period moving average represents the short-term sentiment in the market. It captures the rapid fluctuations in price and is heavily influenced by recent supply and demand changes. Traders often look to the 7-period SMA for immediate price momentum, with price moving above or below this line signaling short-term strength or weakness.
- Bullish Supply/Demand : When price is above the 7-period SMA, it suggests that buyers are currently in control and demand is higher than supply. Conversely, price falling below this line indicates that supply is overpowering demand, leading to a short-term downtrend.
Is current price > average price in past 7 candles (depending on timeframe)? This will tell you how aggressive buyers are in short term.
- Key Supply/Demand Zones : The 7-period SMA often acts as dynamic support or resistance in a trending market, where traders might use it to enter or exit positions based on how price interacts with this level.
- 25-period Moving Average (Medium-Term) :
The 25-period SMA smooths out more of the noise compared to the 7-period, providing a more stable indication of intermediate trends. This moving average is often used to gauge the market's supply and demand balance over a broader timeframe than the short-term 7-period SMA.
- Supply/Demand Balance : The 25-period SMA reflects the medium-term equilibrium between supply and demand. A crossover between the price and the 25-period SMA may indicate a shift in this balance. When price sustains above the 25-period SMA, it shows that demand is strong enough to maintain an upward trend. Conversely, if the price stays below it, supply is likely exceeding demand.
Is current price > average price in past 25 candles (depending on timeframe)? This will tell you how aggressive buyers are in mid term.
- Momentum Shift : Crossovers between the 7-period and 25-period SMAs can indicate momentum shifts between short-term and medium-term demand. For example, if the 7-period crosses above the 25-period, it often signifies growing short-term demand relative to the medium-term trend, signaling potential buy opportunities. What this crossover means is that if 7MA > 25MA that means in past 7 candles average price is more than past 25 candles.
- 99-period Moving Average (Long-Term):
The 99-period SMA represents the long-term trend and reflects the market's supply and demand over an extended period. This moving average filters out short-term fluctuations and highlights the market's overall trajectory.
- Long-Term Supply/Demand Dynamics : The 99-period SMA is slower to react to changes in supply and demand, providing a more stable view of the market's overall trend. Price staying above this line shows sustained demand dominance, while price consistently staying below reflects ongoing supply pressure.
Is current price > average price in past 99 candles (depending on timeframe)? This will tell you how aggressive buyers are in long term.
- Market Trend Confirmation : When both the 7-period and 25-period SMAs are above the 99-period SMA, it signals a strong bullish trend with demand outweighing supply across all timeframes. If all three SMAs are below the 99-period SMA, it points to a bear market where supply is overpowering demand in both the short and long term.
2. Price Action Perspective :
- 7-period Moving Average (Short-Term Trends):
The 7-period moving average closely tracks price action, making it highly responsive to quick shifts in price. Traders often use it to confirm short-term reversals or continuations in price action. In an uptrend, price typically stays above the 7-period SMA, whereas in a downtrend, price stays below it.
- Short-Term Price Reversals : Crossovers between the price and the 7-period SMA often indicate short-term reversals. When price breaks above the 7-period SMA after staying below it, it suggests a potential bullish reversal. Conversely, a price breakdown below the 7-period SMA could signal a bearish reversal.
- 25-period Moving Average (Medium-Term Trends) :
The 25-period SMA helps identify the medium-term price action trend. It balances short-term volatility and longer-term stability, providing insight into the more persistent trend. Price pullbacks to the 25-period SMA during an uptrend can act as a buying opportunity for trend traders, while pullbacks during a downtrend may offer shorting opportunities.
- Pullback and Continuation: In trending markets, price often retraces to the 25-period SMA before continuing in the direction of the trend. For instance, if the price is in a bullish trend, traders may look for support at the 25-period SMA for potential continuation trades.
- 99-period Moving Average (Long-Term Trend and Market Sentiment ):
The 99-period SMA is the most critical for identifying the overall market trend. Price consistently trading above the 99-period SMA indicates long-term bullish momentum, while price staying below the 99-period SMA suggests bearish sentiment.
- Trend Confirmation : Price action above the 99-period SMA confirms long-term upward momentum, while price action below it confirms a downtrend. The space between the shorter moving averages (7 and 25) and the 99-period SMA gives a sense of the strength or weakness of the trend. Larger gaps between the 7 and 99 SMAs suggest strong bullish momentum, while close proximity indicates consolidation or potential reversals.
- Price Action in Trending Markets : Traders often use the 99-period SMA as a dynamic support/resistance level. In strong trends, price tends to stay on one side of the 99-period SMA for extended periods, with breaks above or below signaling major changes in market sentiment.
Why These Numbers Matter:
7-Period MA : The 7-period moving average is a popular choice among short-term traders who want to capture quick momentum changes. It helps visualize immediate market sentiment and is often used in conjunction with price action to time entries or exits.
- 25-Period MA: The 25-period MA is a key indicator for swing traders. It balances sensitivity and stability, providing a clearer picture of the intermediate trend. It helps traders stay in trades longer by filtering out short-term noise, while still being reactive enough to detect reversals.
- 99-Period MA : The 99-period moving average provides a broad view of the market's direction, filtering out much of the short- and medium-term noise. It is crucial for identifying long-term trends and assessing whether the market is bullish or bearish overall. It acts as a key reference point for longer-term trend followers, helping them stay with the broader market sentiment.
Conclusion:
From a supply and demand perspective, the 7, 25, and 99-period moving averages help traders visualize shifts in the balance between buyers and sellers over different time horizons. The price action interaction with these moving averages provides valuable insight into short-term momentum, intermediate trends, and long-term market sentiment. Using these three MAs together gives a more comprehensive understanding of market conditions, helping traders align their strategies with prevailing trends across various timeframes.
------------- RULE BASED SYSTEM ---------------
Overview of the Rule-Based System:
This system will use the following moving averages:
7-period MA: Represents short-term price action.
25-period MA: Represents medium-term price action.
99-period MA: Represents long-term price action.
1. Trend Identification Rules:
Bullish Trend:
The 7-period MA is above the 25-period MA, and the 25-period MA is above the 99-period MA.
This structure shows that short, medium, and long-term trends are aligned in an upward direction, indicating strong bullish momentum.
Bearish Trend:
The 7-period MA is below the 25-period MA, and the 25-period MA is below the 99-period MA.
This suggests that the market is in a downtrend, with bearish momentum dominating across timeframes.
Neutral/Consolidation:
The 7-period MA and 25-period MA are flat or crossing frequently with the 99-period MA, and they are close to each other.
This indicates a sideways or consolidating market where there’s no strong trend direction.
2. Entry Rules:
Bullish Entry (Buy Signals):
Primary Buy Signal:
The price crosses above the 7-period MA, AND the 7-period MA is above the 25-period MA, AND the 25-period MA is above the 99-period MA.
This indicates the start of a new upward trend, with alignment across the short, medium, and long-term trends.
Pullback Buy Signal (for trend continuation):
The price pulls back to the 25-period MA, and the 7-period MA remains above the 25-period MA.
This indica
tes that the pullback is a temporary correction in an uptrend, and buyers may re-enter the market as price approaches the 25-period MA.
You can further confirm the signal by waiting for price action (e.g., bullish candlestick patterns) at the 25-period MA level.
Breakout Buy Signal:
The price crosses above the 99-period MA, and the 7-period and 25-period MAs are also both above the 99-period MA.
This confirms a strong bullish breakout after consolidation or a long-term downtrend.
Bearish Entry (Sell Signals):
Primary Sell Signal:
The price crosses below the 7-period MA, AND the 7-period MA is below the 25-period MA, AND the 25-period MA is below the 99-period MA.
This indicates the start of a new downtrend with alignment across the short, medium, and long-term trends.
Pullback Sell Signal (for trend continuation):
The price pulls back to the 25-period MA, and the 7-period MA remains below the 25-period MA.
This indicates that the pullback is a temporary retracement in a downtrend, providing an opportunity to sell as price meets resistance at the 25-period MA.
Breakdown Sell Signal:
The price breaks below the 99-period MA, and the 7-period and 25-period MAs are also below the 99-period MA.
This confirms a strong bearish breakdown after consolidation or a long-term uptrend reversal.
3. Exit Rules:
Bullish Exit (for long positions):
Short-Term Exit:
The price closes below the 7-period MA, and the 7-period MA starts crossing below the 25-period MA.
This indicates weakening momentum in the uptrend, suggesting an exit from the long position.
Stop-Loss Trigger:
The price falls below the 99-period MA, signaling the breakdown of the long-term trend.
This can act as a final exit signal to minimize losses if the long-term uptrend is invalidated.
Bearish Exit (for short positions):
Short-Term Exit:
The price closes above the 7-period MA, and the 7-period MA starts crossing above the 25-period MA.
This indicates a potential weakening of the downtrend and signals an exit from the short position.
Stop-Loss Trigger:
The price breaks above the 99-period MA, invalidating the bearish trend.
This signals that the market may be reversing to the upside, and exiting short positions would be prudent.
Price Action All In OneThis indicator represents the most advanced level of price action indicators, incorporating six useful features: traditional gaps, shadow gaps, bar counting, moving averages, previous values, and IO pattern matching .
When I refer to price action, I mean the teachings of Dr. Al Brooks.
While you can find these features in other indicators, mine is more advanced. The default settings are designed to work on a 5-minute timeframe, but you can also use this indicator on other time periods if you prefer.
Gaps
Traditional Gaps: Occurs when the lowest price of a bar is higher than the highest price of the previous bar, or the highest price of a bar is lower than the lowest price of the previous bar.
Shadow/Tail Gaps: Occurs when the lowest price of a bar is higher than the highest price of the second last bar, or the highest price of a bar is lower than the lowest price of the second last bar.
Gaps indicate strength, and consecutive gaps in one direction are characteristic of a strong trend. They offer a perspective on the strength of a trend, signifying that limit orders on one side are at a loss with no opportunity to exit at breakeven. Can bulls or bears create gaps? Are the gaps they create filled, or do they remain open?
Traditional Gaps & Shadow/Tail Gaps
Bar Counting
The ability to use different timeframes (e.g., to determine the minute within an hour or the hour within a week).
Consistent display of 1; in other indicators, if you set intervals to 2, you see 2, 4, 6, etc., or 1, 2, 4, 6. In my indicator, you will see 1, 3, 5, etc.
In intraday trading, certain specific times are more important than others. For example, a form of reversal is more likely to occur at the midpoint of the trading day (if there are 80 candles in a day, the midpoint is at the 40th candle).
This doesn't mean you should make reversal trades at the 40th candle. The bar count feature simply reminds you of the current time, helping you gauge how long until the trading day ends. For instance, if there are 80 candles in a day and you're an intraday trader, you probably shouldn't make a swing trade at the 70th candle because there are only 10 candles left until the close—likely not enough time for a swing to develop.
Additionally, if you trade on a 5-minute timeframe, seeing candles numbered 3, 6, 9, etc. indicates the close of a 15-minute candle. This means that in addition to 5-minute timeframe traders, 15-minute timeframe traders will also pay attention to these candles, making them more significant. For the same reason, the 12th candle is crucial, as its close also marks the close of an hourly candle.
Day Time Frame & Week Time Frame
Moving Averages
Provides three EMAs. You can set different timeframes and choose between continuous or discrete modes.
Moving averages are excellent tools for determining trends. The 20 EMA is particularly popular, which increases its significance. Traders using different timeframes, such as 5-minute, 15-minute, and 1-hour, all utilize the 20 EMA. This indicator allows you to see what traders on 15-minute and 1-hour timeframes are observing, even when you're on a 5-minute timeframe.
Once again, the default settings of this indicator assume that the user is trading intraday on a 5-minute timeframe. However, if that's not the case, you can easily adjust the moving average periods. For instance, if you trade on a 1-hour timeframe and want to display the 4-hour and daily moving averages on your chart, this can be done effortlessly.
5m 20, 15m 20 & 1h 20
Previous Values
Features three previous value displays. You can set their sources and timeframes independently and define the range for all previous values.
For intraday trading, marking the previous day's high, low, and close prices can be crucial. While some other indicators provide this feature, mine does it better. You can set different timeframes and choose various sources. For example, you might want to display the average of (O+H+L+C)/4 for the last week.
In addition to setting the timeframe and source, you can also configure the display range:
All: This will show the data in all positions. For example, you can see the high price from two days ago on yesterday's chart.
Today: This will only display the previous day's high price on the current day's chart.
Timeframe: This will display the data based on the specified timeframe you set.
Last Week High, Last Day Close & Low(Timeframe Display)
IO Pattern Matching
More advanced than other IO pattern matching indicators. For adjacent IIs, it merges to display as III, IIII, and so on. The same applies to OO patterns. Additionally, it automatically merges adjacent IOI and II into IOII, and adjacent OO and IOI into IIOI.
II Pattern: This refers to two consecutive inside bar candles. On a lower timeframe, the II pattern forms a converging triangle, which is a breakout pattern. The II pattern could also potentially become a final flag, which is the last flag in a trend.
OO Pattern: This refers to two consecutive outside bar candles. On a lower timeframe, the OO pattern forms an expanding triangle. You can use the OO pattern similarly to how you would use an expanding triangle.
IOI Pattern: This pattern occurs when the first candle is contained within the second candle, and the third candle is also contained within the second candle. This is a breakout pattern and could similarly represent a terminal flag in a trend.
The appearance of II, OO, or IOI patterns does not necessarily mean you should make a reversal trade. These patterns are meant to mark potential moves in a lower timeframe within the current cycle, providing a new perspective on the market and reminding you to stay vigilant.
You shouldn't look for IO patterns in a tight trading range. There are many IO patterns in a tight trading range, but they don't hold much significance.
II, OO & IOI
Supply and Demand Areas Responsible and Origins [PRO][keypoems]Supply and Demand Areas Responsible and Origins by Keypoems
This indicator highlights supply and demand areas responsible for breaking market structure (SNDR) and tracks how many times these have been "tapped". This is a very advanced and unique capability not present on TradingView at the moment. It also draws and track the "Origins" of breakout moves.
Using this fellow traders can to track with great precision order flow by gauging the reaction of price to these very sensitive areas.
Various powerful trading models can be built around this indicator. Here's an example on how to use it: Price Action will tend to retrace and visit ("tap") critical areas where orders are accumulated (SNDR and Origins) usually twice ("double tap") before continuing a trend. With this knowledge traders can either enter profitably a pro-trend trade after a "double tap" retracement in a responsible area or a origin or if those areas are violated, understand the change in narrative and enter a counter-trend trade.
This indicator is not a mashup of something you have already seen. It is absolutely unique: early testers and fellow traders have been very loud in requesting this to be released to the public (I love you moderators!).
SNDRs (Supply and Demand Responsible)
- Advanced Detection: Looks for the last up-move swing in a bearish zone, or the last down-move in a bullish zone. Adjust the sensitivity choosing a customizable pivot length.
- Mitigation Extension: Option to extend SNDR zones until they are fully mitigated.
- First Tap Indication: Zones change color and text upon the first tap, signaling initial mitigation.
- Second Tap Indication: Zones change color and text upon the first tap, signaling possible trade idea.
- Set pivot length for swing detection.
- Enable bullish and bearish SNDR zones separately.
- Customize texts, colors, and border colors for SNDR zones.
- Adjust line styles, widths, and display of 30%, 50%, and 70% levels within SNDR zones.
Origins
- Definition Flexibility: Mark Origins as the last down-close candle in a bullish zone, last up-close candle in a bearish zone or use the initial swing point with a customizable pivot length.
- Mitigation Extension: Extend origin zones until they are fully mitigated.
- First Tap Indication: Similar to SNDR, origin zones can change appearance upon the first tap.
- Set pivot length for swing detection.
- Enable bullish and bearish origin zones separately.
- Customize texts, colors, borders, and line styles.
- Adjust display of 30%, 50%, and 70% levels within origin zones.
Zones
To be able to draw SNDRs (which are internal counter-trend areas in a zone) the indicator needs to track market structure zones. So the indicator can also draw those zones if needed. The indicator can also extend the current price zones until the 50% of the zone is mitigated.
Info Box
Displays a box with detailed information about the last identified zone, including risk and range size.
- Risk Management: Set the risk amount to calculate contract sizes or position sizing.
- Visibility Options: Adjust the labels' size within the info box for better readability.
- Set the risk amount for calculations.

Mars Signals - SSL Trend AnalyzerIntroduction
The "Mars Signals - Precision Trend Analyzer with SSL Baseline & Price Action Zones" is a comprehensive technical analysis tool designed for traders seeking to enhance their market analysis and trading strategies. This indicator integrates multiple advanced trading concepts, including dynamic moving averages, trend detection algorithms, momentum indicators, volume analysis, higher timeframe confirmation, candlestick pattern recognition, and precise price action zones. By combining these elements, the indicator aims to provide clear and actionable buy and sell signals, helping traders to make informed decisions in various market conditions.
Core Components and Functionality
1.Dynamic Baseline Calculation
Moving Average Types: The indicator allows users to select from a variety of moving average types for the baseline calculation, including Simple Moving Average (SMA), Exponential Moving Average (EMA), Hull Moving Average (HMA), Weighted Moving Average (WMA), Double EMA (DEMA), Triple EMA (TEMA), Least Squares Moving Average (LSMA), Triangular Moving Average (TMA), Kijun (from Ichimoku Kinko Hyo), and McGinley's Dynamic.
Baseline Length: Users can customize the length of the moving average, providing flexibility to adjust the sensitivity of the baseline to market movements.
Signal Line Generation: The indicator computes a dynamic signal line based on the relationship between the close price and the moving averages of the high and low prices. This signal line adapts to market volatility and trend changes.
2.SSL Baseline Integration
SSL Baseline: In addition to the primary baseline, the indicator incorporates an SSL (Semaphore Signal Level) Baseline, which further refines trend detection by considering the highs and lows over a specified period.
Dual Confirmation: The combination of the primary baseline and the SSL baseline enhances the reliability of the trend signals by requiring agreement between both baselines before generating a signal.
3.Momentum and Trend Filters
Relative Strength Index (RSI): The indicator uses the RSI to assess the momentum of price movements, filtering out signals that occur during overbought or oversold conditions.
Moving Average Convergence Divergence (MACD): The MACD is employed to identify the direction and strength of the trend, adding another layer of confirmation to the signals.
Average Directional Index (ADX): The ADX measures the strength of the trend, ensuring that signals are generated only when the market shows significant directional movement.
4.Volume Analysis
Volume Filter: An optional volume filter compares the current volume to its moving average, allowing traders to focus on signals that occur during periods of higher market activity.
5.Higher Timeframe Confirmation
Multi-Timeframe Analysis: The indicator can incorporate data from a higher timeframe, comparing the current price to the higher timeframe's baseline and signal line. This feature helps traders align their trades with the broader market trend.
6.Candlestick Pattern Recognition
Bullish Patterns: The indicator detects bullish patterns such as Bullish Engulfing, Piercing Line, Hammer, and Doji.
Bearish Patterns: It also identifies bearish patterns like Bearish Engulfing, Dark Cloud Cover, Shooting Star, and Doji.
Pattern Prioritization: The patterns are prioritized to highlight the most significant formations, which can serve as additional confirmation for trade entries and exits.
7.Price Action Zones
Support and Resistance Levels: The indicator automatically identifies pivot highs and lows to establish dynamic support and resistance levels.
Zone Visualization: It draws shaded rectangles on the chart to represent these zones, providing a clear visual aid for potential reversal or breakout areas.
ATR-Based Zone Width: The zones' thickness is dynamically calculated using the Average True Range (ATR), adjusting to the current market volatility.
Background Coloring: The chart background changes color when the price is above the maximum resistance or below the minimum support, alerting traders to significant price movements.
Interpreting the Signals
1.Buy Signals
Conditions:
Price crosses above the signal line.
RSI is below 70 (not overbought).
MACD line is above the signal line (indicating bullish momentum).
ADX is above the user-defined threshold (default is 20), confirming a strong trend.
(Optional) Volume is above its moving average if the volume filter is enabled.
(Optional) Price is above the higher timeframe baseline and signal line if the higher timeframe filter is enabled.
(Optional) A bullish candlestick pattern is detected if the candlestick pattern filter is enabled.
Visual Indicators:
An upward-pointing label with the text "BUY" appears below the price bar.
The baseline and SSL baseline lines turn to colors indicating bullish conditions.
2.Sell Signals
Conditions:
Price crosses below the signal line.
RSI is above 30 (not oversold).
MACD line is below the signal line (indicating bearish momentum).
ADX is above the user-defined threshold, confirming a strong trend.
(Optional) Volume is above its moving average if the volume filter is enabled.
(Optional) Price is below the higher timeframe baseline and signal line if the higher timeframe filter is enabled.
(Optional) A bearish candlestick pattern is detected if the candlestick pattern filter is enabled.
Visual Indicators:
A downward-pointing label with the text "SELL" appears above the price bar.
The baseline and SSL baseline lines turn to colors indicating bearish conditions.
3.Support and Resistance Zones
Interpretation:
Resistance Zones: Represent areas where the price may face selling pressure. A break above these zones can signal a strong bullish move.
Support Zones: Represent areas where the price may find buying interest. A break below these zones can signal a strong bearish move.
Background Color:
The background turns red when the price is above the maximum resistance, indicating potential overextension.
The background turns green when the price is below the minimum support, indicating potential undervaluation.
Effective Usage Strategies
1.Customization
Adjusting Baseline and SSL Settings: Traders should experiment with different moving average types and lengths to match their trading style and the specific characteristics of the asset being analyzed.
Filtering Parameters: Modify RSI, MACD, and ADX settings to fine-tune the sensitivity of the signals.
Volume and Higher Timeframe Filters: Enable these filters to add robustness to the signals, especially in volatile markets or when trading higher timeframes.
2.Combining with Other Analysis
Fundamental Analysis: Use the indicator in conjunction with fundamental insights to validate technical signals.
Risk Management: Always apply proper risk management techniques, such as setting stop-loss and take-profit levels based on the support and resistance zones provided by the indicator.
3.Backtesting
Historical Analysis: Utilize the indicator's settings to backtest trading strategies on historical data, helping to identify the most effective configurations before applying them in live trading.
4.Monitoring Market Conditions
Volatility Awareness: Pay attention to the ATR and ADX readings to understand market volatility and trend strength, adjusting strategies accordingly.
Event Considerations: Be cautious around major economic announcements or events that may impact market behavior beyond technical indications.
Indicator Inputs and Customization Options
Baseline Type and Length: Select from multiple moving average types and specify the period length.
ADX Settings: Adjust the length, smoothing, and threshold for trend strength confirmation.
Volume Filter: Enable or disable the volume confirmation filter.
Higher Timeframe Filter: Choose to incorporate higher timeframe analysis and specify the desired timeframe.
Candlestick Patterns: Enable or disable the detection of candlestick patterns for additional signal confirmation.
SSL Baseline Type and Length: Customize the SSL baseline settings separately from the primary baseline.
Price Action Zones Settings:
Zone Thickness: Adjust the visual thickness of the support and resistance zones.
Lookback Period: Define how far back the indicator looks for pivot points.
ATR Multiplier for Zone Width: Set the multiplier for ATR to determine the dynamic width of the zones.
Maximum Number of Zones: Limit the number of support and resistance zones displayed.
Pivot Bars: Customize the number of bars to the left and right used for identifying pivot highs and lows.
Conclusion
The "Mars Signals - Precision Trend Analyzer with SSL Baseline & Price Action Zones" is a versatile and powerful tool that amalgamates essential technical analysis techniques into a single, user-friendly indicator. By providing clear visual signals and incorporating multiple layers of confirmation, it assists traders in identifying high-probability trading opportunities. Whether you are a day trader, swing trader, or long-term investor, this indicator can be tailored to suit your trading style and enhance your decision-making process.
To maximize the benefits of this indicator:
Understand Each Component: Familiarize yourself with how each part of the indicator contributes to the overall signal generation.
Customize Thoughtfully: Adjust the settings based on the asset class, market conditions, and your risk tolerance.
Practice Diligently: Use demo accounts or paper trading to practice and refine your strategy before deploying it in live markets.
Stay Informed: Continuously educate yourself on technical analysis and market dynamics to make the most informed decisions.
Disclaimer
Trading financial markets involves risk, and past performance is not indicative of future results. This indicator is a tool to aid in analysis and should not be the sole basis for any trading decision. Always conduct your own research and consider consulting with a licensed financial advisor.

Alternative Shark Harmonic Pattern [TradingFinder] ALT Shark🔵 Introduction
The Alternative Shark harmonic pattern, similar to the original Shark harmonic pattern introduced by Scott Carney, is a powerful tool in technical analysis used to identify potential reversal zones (PRZ) in financial markets.
These harmonic patterns help traders spot key turning points in market trends by relying on specific Fibonacci ratios. The Alternative Shark pattern is particularly unique due to its distinct Fibonacci retracements within the PRZ, which differentiate it from the standard Shark pattern and provide traders with more precise entry and exit signals.
By focusing on harmonic patterns and utilizing tools like the Harmonic Pattern Indicator, traders can easily identify both the Shark and Alternative Shark patterns, making it easier to find PRZs and capture potential trend reversals. This enhanced detection of potential reversal zones allows for better trade optimization and improved risk management.
Incorporating the Alternative Shark pattern into your technical analysis strategy enables you to enhance your trading performance by identifying market reversals with greater accuracy, improving the timing of your trades, and reducing risks associated with sudden market shifts.
🟣 Understanding the Types of Alternative Shark Pattern
The Alternative Shark harmonic pattern, much like the original Shark pattern, forms at the end of price trends and is divided into two types: Bullish and Bearish Alternative Shark patterns.
Bullish Alternative Shark Pattern :
This pattern typically forms at the end of a downtrend, signaling a potential reversal into an uptrend. Traders can use this pattern to identify buy entry points. The image below illustrates the core components of the Bullish Alternative Shark Pattern.
Bearish Alternative Shark Pattern :
Conversely, the Bearish Alternative Shark Pattern appears at the end of an uptrend and signals a potential reversal to a downtrend. This variation allows traders to adjust their strategies for selling. The image below outlines the characteristics of the Bearish Alternative Shark Pattern.
🟣 Differences Between Shark and Alternative Shark Patterns
Although both patterns share similar structures and serve as tools for identifying price reversals, there is one key difference between them :
AB to XA Ratio : In the Shark pattern, the AB leg retraces between 1 and 2 of the XA leg, whereas in the Alternative Shark pattern, this retracement is reduced to 0.382 to 0.618 of the XA leg. This difference in the retracement ratio leads to slightly different trade signals and can affect the timing of entry and exit points.
Other ratios and reversal signals remain consistent between the two patterns, but this difference in the AB to XA ratio provides traders with more nuanced opportunities to optimize their trades.
🔵 How to Use
🟣 Trading with the Bullish Alternative Shark Pattern
The Bullish Alternative Shark Pattern functions similarly to the traditional Bullish Shark, acting as a reversal pattern that helps traders recognize the end of a downtrend and the beginning of an uptrend.
The main distinction lies in the reduced AB retracement, which can offer more refined entry signals. Once the pattern completes, traders can look to enter buy trades and place a stop-loss below the lowest point of the pattern for effective risk management.
🟣 Trading with the Bearish Alternative Shark Pattern
The Bearish Alternative Shark Pattern operates much like the Bearish Shark pattern but with the adjusted AB to XA ratio. This difference provides traders with unique entry points for sell trades. Once the pattern is fully identified, traders can enter short positions, placing a stop-loss above the highest point of the pattern to safeguard against market fluctuations.
🔵 Setting
🟣 Logical Setting
ZigZag Pivot Period : You can adjust the period so that the harmonic patterns are adjusted according to the pivot period you want. This factor is the most important parameter in pattern recognition.
Show Valid Forma t: If this parameter is on "On" mode, only patterns will be displayed that they have exact format and no noise can be seen in them. If "Off" is, the patterns displayed that maybe are noisy and do not exactly correspond to the original pattern.
Show Formation Last Pivot Confirm : if Turned on, you can see this ability of patterns when their last pivot is formed. If this feature is off, it will see the patterns as soon as they are formed. The advantage of this option being clear is less formation of fielded patterns, and it is accompanied by the latest pattern seeing and a sharp reduction in reward to risk.
Period of Formation Last Pivot : Using this parameter you can determine that the last pivot is based on Pivot period.
🟣 Genaral Setting
Show : Enter "On" to display the template and "Off" to not display the template.
Color : Enter the desired color to draw the pattern in this parameter.
LineWidth : You can enter the number 1 or numbers higher than one to adjust the thickness of the drawing lines. This number must be an integer and increases with increasing thickness.
LabelSize : You can adjust the size of the labels by using the "size.auto", "size.tiny", "size.smal", "size.normal", "size.large" or "size.huge" entries.
🟣 Alert Setting
Alert : On / Off
Message Frequency : This string parameter defines the announcement frequency. Choices include: "All" (activates the alert every time the function is called), "Once Per Bar" (activates the alert only on the first call within the bar), and "Once Per Bar Close" (the alert is activated only by a call at the last script execution of the real-time bar upon closing). The default setting is "Once per Bar".
Show Alert Time by Time Zone : The date, hour, and minute you receive in alert messages can be based on any time zone you choose. For example, if you want New York time, you should enter "UTC-4". This input is set to the time zone "UTC" by default.
🔵 Conclusion
The Alternative Shark harmonic pattern, despite its structural similarity to the traditional Shark pattern, introduces a key difference in the AB to XA ratio, making it a valuable addition to the trader’s toolkit. This subtle variation enables traders to pinpoint reversal points with greater accuracy and fine-tune their trading strategies.
As with any technical pattern, it is crucial to use the Alternative Shark pattern in combination with other technical indicators and strong risk management practices. Incorporating this pattern into a broader trading strategy can help traders enhance their ability to detect and capitalize on market reversals more effectively.

Price Action UltimateThe Price Action Ultimate indicator is an innovative tool designed to provide traders with a comprehensive view of price action based on either volume or touches. By default, the indicator displays touches, offering a unique perspective on price levels that have been frequently interacted with by the market.
At its core, the indicator divides the price range of a specified lookback period into a number of rows (default 25). For each row, it calculates either the volume traded or the number of times the price touched that level. This data is then visualized in two ways: as a histogram and as horizontal lines on the chart.
The histogram, displayed on the right side of the chart, represents the distribution of touches (or volume) across different price levels. Each bar in the histogram shows the number of touches and the percentage of total touches for that price level. The color of the bars ranges from a user-defined low activity color to a high activity color, providing a quick visual reference for the most active price levels.
The horizontal lines drawn across the chart represent the most significant levels based on touches (or volume). By default, the indicator displays the top 3 levels, but this can be adjusted. The thickness of these lines corresponds to the relative importance of each level - thicker lines indicate more touches or higher volume. This feature allows traders to quickly identify key support and resistance levels based on historical price action.
One of the most innovative aspects of this indicator is the option to fade older levels over time. When enabled, this feature gradually increases the transparency of lines as they age, with newer levels appearing more prominently. This helps traders focus on the most recent and relevant price action while still maintaining awareness of older, potentially significant levels.
The indicator offers flexibility in its display options. Users can choose to show levels based on volume, touches, or both. This allows traders to compare and contrast different perspectives on price action. Additionally, the indicator includes options to display a volume profile and a background fill for the analysis range, further enhancing its visual appeal and informational content.
What makes this indicator particularly valuable is its ability to provide a clear, uncluttered view of key price levels without relying on complex calculations or multiple indicators. It distills price action down to its essence - where price has spent the most time or where the most trading activity has occurred. This can be incredibly useful for identifying potential support and resistance levels, areas of consolidation, or possible breakout points.
For traders focused on price action strategies, this indicator offers a powerful tool to enhance their analysis. It provides a data-driven approach to identifying significant price levels, which can be used to inform entry and exit decisions, set stop losses, or anticipate potential market reactions.
This indicator is a tool to aid in market analysis and should not be used as the sole basis for trading decisions. Always combine multiple forms of analysis and practice proper risk management when trading. Past performance does not guarantee future results.
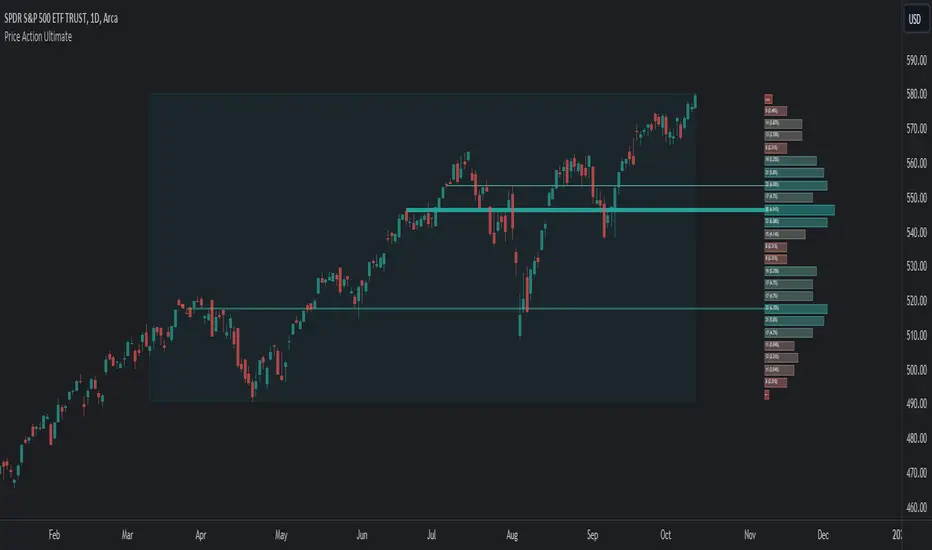
Volumetric Volatility Breaker Blocks [UAlgo]The "Volumetric Volatility Breaker Blocks " indicator is designed for traders who want a comprehensive understanding of market volatility combined with volume analysis. This indicator provides a clear visualization of significant volatility areas (or blocks), characterized by price movements that exceed a specific volatility threshold, as calculated using the ATR (Average True Range). The concept is enhanced by integrating volume-based insights, offering a view of market activity that helps users to recognize when significant price changes are being supported by an appropriate level of market participation.
The indicator calculates breaker blocks for both bullish and bearish market conditions, providing distinct visual elements that identify periods of high volatility and substantial volume divergence. The focus on both volume and volatility makes this tool versatile, allowing traders to assess the strength of price movements as well as areas where price might break above or below previously established levels.
It supports adjustable parameters, such as volatility length, smoothness factor, and volume display, allowing traders to fine-tune the indicator according to their trading strategy and market environment. The highlighted breaker blocks assist in identifying zones of potential price reversal or continuation, which can be critical for making informed trading decisions.
🔶 Key Features
Volatility-Based Block Identification: The indicator uses the Average True Range (ATR) to determine the volatility of the market. When the ATR exceeds a specified threshold (smooth ATR multiplied by a user-defined multiplier), it highlights these areas as volatility blocks. The idea is to mark periods where price activity is significantly divergent from normal conditions, which often signals market opportunities.
Volume Integrated Analysis: In addition to tracking volatility, the indicator incorporates volume data, allowing traders to see the amount of activity that occurs during these high-volatility periods. This helps in identifying whether a price movement is likely sustainable or whether it lacks market support.
User Adjustable Parameters: The indicator offers customization options for the volatility length (using ATR), smooth length, and multiplier for sensitivity adjustment. These settings enable users to modify the indicator’s responsiveness to market conditions.
The option to display the last few volatility blocks allows traders to manage clutter on their charts and focus only on the most recent significant data.
Mitigation Method: Users can select between different mitigation methods ("Close" or "Wick") to determine how blocks are broken. This adds an extra layer of adaptability, allowing traders to modify the indicator's response based on different price action strategies.
Dynamic Visual Representation: The indicator dynamically draws boxes for volatility blocks and shades them according to market direction, with split areas showing the bullish and bearish strength contributions. It also provides percentage volume for each block, helping traders understand the relative market participation during these moves.
🔶 Interpreting the Indicator
Identifying High Volatility Areas: When a new volatility block appears, it signifies that the market is experiencing higher-than-usual volatility, driven by increased ATR values. Traders should pay attention to these blocks, as they often indicate that a significant price move is occurring. Bullish blocks suggest upward pressure, whereas bearish blocks indicate downward pressure.
Volume Insights: The volume associated with each volatility block provides an insight into how much market participation accompanies these moves. Higher volume within a block implies that the market is actively supporting the price change, which may be a sign of continuation. Low volume suggests that the movement may lack the strength to persist.
Bullish vs. Bearish Strength Analysis: Each block is split into bullish and bearish strength, giving a clearer picture of what’s happening within the volatility period. If the bullish portion dominates, it indicates strong upward sentiment during that period. Conversely, if the bearish side is more prominent, there is more selling pressure. This breakdown helps in understanding intra-block market dynamics.
Volume Percentage Display: The indicator also displays the volume percentage in each block, which provides context for the strength of the move relative to recent market activity. Higher percentages mean more market engagement, which could confirm the legitimacy of a trend or a significant breakout.
🔶 Disclaimer
Use with Caution: This indicator is provided for educational and informational purposes only and should not be considered as financial advice. Users should exercise caution and perform their own analysis before making trading decisions based on the indicator's signals.
Not Financial Advice: The information provided by this indicator does not constitute financial advice, and the creator (UAlgo) shall not be held responsible for any trading losses incurred as a result of using this indicator.
Backtesting Recommended: Traders are encouraged to backtest the indicator thoroughly on historical data before using it in live trading to assess its performance and suitability for their trading strategies.
Risk Management: Trading involves inherent risks, and users should implement proper risk management strategies, including but not limited to stop-loss orders and position sizing, to mitigate potential losses.
No Guarantees: The accuracy and reliability of the indicator's signals cannot be guaranteed, as they are based on historical price data and past performance may not be indicative of future results.
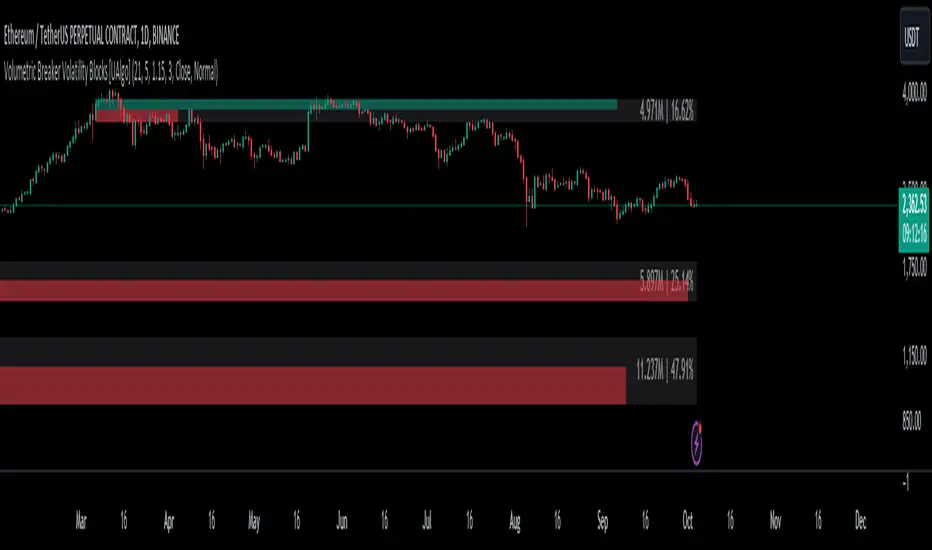
FVG Channel [LuxAlgo]The FVG Channel indicator displays a channel constructed from the averages of unmitigated historical fair value gaps (FVG), allowing to identify trends and potential reversals in the market.
Users can control the amount of FVGs to consider for the calculation of the channels, as well as their degree of smoothness through user settings.
🔶 USAGE
The FVG Channel is constructed by averaging together recent unmitigated Bullish FVGs (contributing to the creation of the upper bands), and Bearish unmitigated FVGs (contributing to the creation of the lower bands) within a lookback determined by the user. A higher lookback will return longer-term indications from the indicator.
The channel includes 5 bands, with one upper and one lower outer extremities, as well as an inner series of values determined using the Fibonacci ratios (respectively 0.786, 0.5, 0.236) from the channel's outer extremities.
An uptrend can be identified by price holding above the inner upper band (obtained from the 0.786 ratio), this band can also provide occasional support when the price retraces to it while in an uptrend.
Breaking below the inner upper band with an unwillingness to reach above again is a clear sign of hesitation in the market and can be indicative of an upcoming consolidation or reversal.
This can directly be applied to downtrends as well, below are examples displaying both scenarios.
Uptrend Example:
Downtrend Example:
🔹 Breakout Levels
When the price mitigates all FVGs in a single direction except for 1, the indicator will display a "Breakout Level". This is the level that price will need to cross in order for all FVGs in that direction to be mitigated, because of this they can also be aptly called "Last Stand Levels".
These levels can be considered as potential support and resistance levels, however, should always be monitored for breakouts since a substantial push above or below these points would indicate strong momentum.
🔹 Signals
The indicator includes Bullish and Bearish Signals, these signals fire when all FVGs for a single direction have been mitigated and an engulfing candle occurs in the opposite direction. These are reversal signals and should be used alongside other indicators to appropriately manage risk.
Note: When all FVGs in a single direction have been mitigated, the candles will change colors accordingly.
🔶 DETAILS
The script uses a typical identification method for FVGs. Once identified, the script collects and stores the mitigation levels of the respective bullish and bearish FVGs:
For Bullish FVGs this is the bottom of the FVG.
For Bearish FVGs this is the top of the FVG.
The data is managed to only consider a specific amount of FVG mitigation levels, determined by the set "Unmitigated FVG Lookback". If an FVG is mitigated, it frees up a spot in the memory for a new FVG, however, if the memory is full, the oldest will be deleted.
The averages displayed (Channel Upper and Lower) are created from 2 calculation steps, the first step involves taking the raw average of the FVG mitigation levels, and the second step applies a simple moving average (SMA) smoothing of the precedent obtained averages.
Note: To view the mitigation levels average obtained in the first step, the "Smoothing Length" can be set to 1.
🔶 SETTINGS
Unmitigated FVG Lookback: Sets the maximum number of Unmitigated FVG mitigation levels that the script will use to calculate the channel.
Smoothing Length: Sets the smoothing length for the channel to reduce noise from the raw data.

Price Action Volumetric Breaker Blocks [UAlgo]The Price Action Volumetric Breaker Blocks indicator is designed to identify and visualize significant price levels in the market. It combines concepts of price action, volume analysis, and market structure to provide traders with a comprehensive view of potential support and resistance areas. This indicator identifies "breaker blocks," which are price zones where the market has shown significant interest in the past.
These blocks are created based on swing highs and lows, and are further analyzed using volume data to determine their strength. The indicator also tracks market structure shifts, providing additional context to price movements.
By visualizing these key levels and market structure changes, traders can gain insights into potential areas of price reversal or continuation, helping them make more informed trading decisions.
🔶 Key Features
Dynamic Breaker Block Identification: The indicator automatically detects and draws breaker blocks based on swing highs and lows. These blocks represent areas of potential support and resistance.
Volume-Weighted Strength Analysis: Each breaker block is analyzed using volume data to determine its bullish and bearish strength. This is visually represented by the proportion of green (bullish) and red (bearish) coloring within each block.
Market Structure Break (MSB) and Break of Structure (BOS): The indicator identifies and labels Market Structure Breaks (MSB) and Break of Structure (BOS) events, providing context to larger market trends.
Customizable Settings:
- Adjustable swing length for identifying pivot points
- Option to show a specific number of recent breaker blocks
- Choice between wick or close price for violation checks
- Toggle to hide overlapping blocks for cleaner analysis
Violation Detection: Automatically detects when a breaker block has been violated (broken through), either by wick or close price, depending on user settings.
Overlap Control: Provides an option to hide overlapping order blocks, ensuring that the chart remains clean and easy to read when multiple blocks are detected in close proximity.
🔶 Interpreting Indicator
Breaker Blocks:
Breaker blocks are key areas where the price moves through and invalidates a previously identified order block. The indicator detects a breaker block when the price violates an order block by exceeding its high or low (depending on whether it's a bullish or bearish block). This violation is determined by either the wick or the close of a candle, depending on the user's selection in the "Violation Check" setting. When a breaker block is detected, the indicator removes the violated order block from the chart, signaling that the zone is no longer relevant for future price action.
Bullish Breaker Block: This occurs when a bearish order block (red) is violated by the price closing above the block’s top boundary or when the wick surpasses this level. It signals that a prior bearish structure has been invalidated, and the market may shift to a bullish trend.
Bearish Breaker Block: This occurs when a bullish order block (teal) is violated by the price closing below the block’s bottom boundary or when the wick drops below it. It suggests that a previous bullish structure has been broken, indicating potential bearish momentum.
Market Structure Labels:
"MSB" (Market Structure Break) labels indicate a potential change in trend direction.
"BOS" (Break of Structure) labels confirm the continuation of the current trend after breaking a significant level.
Block Strength:
A block with more green indicates stronger bullish interest.
A block with more red indicates stronger bearish interest.
The relative sizes of the green and red portions show the balance of power between buyers and sellers at that level.
🔶 Disclaimer
Use with Caution: This indicator is provided for educational and informational purposes only and should not be considered as financial advice. Users should exercise caution and perform their own analysis before making trading decisions based on the indicator's signals.
Not Financial Advice: The information provided by this indicator does not constitute financial advice, and the creator (UAlgo) shall not be held responsible for any trading losses incurred as a result of using this indicator.
Backtesting Recommended: Traders are encouraged to backtest the indicator thoroughly on historical data before using it in live trading to assess its performance and suitability for their trading strategies.
Risk Management: Trading involves inherent risks, and users should implement proper risk management strategies, including but not limited to stop-loss orders and position sizing, to mitigate potential losses.
No Guarantees: The accuracy and reliability of the indicator's signals cannot be guaranteed, as they are based on historical price data and past performance may not be indicative of future results.

Advanced Volume-Driven Breakout SignalsThe "Advanced Volume-Driven Breakout Signals" indicator is a cutting-edge tool designed to help traders identify high-potential trading opportunities through sophisticated volume analysis techniques. This indicator integrates volume flow analysis, moving averages, and Relative Volume (RVOL) to provide a comprehensive view of market conditions, going beyond traditional Volume Spread Analysis (VSA) methods.
Key Features:
Volume Flow Analysis: Distinguishes bullish and bearish volume flows with distinct colors, making it easier to visualize market sentiment and potential breakout points.
Volume Flow Moving Averages: Calculates moving averages for volume using various methods (SMA, EMA, WMA, HMA, VWMA), accommodating different trading strategies. This includes settings for adjusting the type of moving average and its period, as well as thresholds for high, medium, and low volume levels.
Volume Spikes Detection: Identifies significant volume spikes based on user-defined multipliers and moving averages, highlighting unusual trading activity.
Volume MA Cloud Settings: Computes general moving averages of volume to track trends and detect deviations. This feature includes options to select different moving average types and adjust thresholds for detecting high volume activity.
Relative Volume (RVOL): Measures current volume relative to historical averages, triggering signals when RVOL exceeds predefined thresholds, indicating notable changes in trading activity.
Entry Conditions: Provides clear long and short entry signals based on combined volume flow conditions and RVOL, offering actionable trading opportunities.
Volume Visualization:
— Bullish Volume Flow: Light and dark green bars indicate bullish volume flow.
— Bearish Volume Flow: Light and dark red bars denote bearish volume flow.
— High Volume Bars: Highlighted in yellow, and extreme volume bars in orange for additional context. These bars are plotted for visual aid and do not directly influence trade signals, focusing instead on the quality and strength of the volume flow.
Alerts: Allows users to create alert notifications for long and short entry signals when the criteria are met, enabling traders to respond promptly to trading opportunities.
Usage:
Overlay: Apply the indicator directly to your price chart to visualise real-time signals and volume conditions.
Customisable: Adjust settings for moving averages, RVOL, and other parameters to match your trading strategy and preferences.
Comparison to VSA Scripts: The "Advanced Volume-Driven Breakout Signals" indicator extends beyond traditional VSA scripts by incorporating a wider range of analytical features. While VSA primarily focuses on volume spread patterns and price action, this indicator offers enhanced functionality with advanced RVOL metrics, customizable moving averages, and detailed volume spike detection, making it a more versatile tool for identifying breakout opportunities and managing trades. It is particularly effective when used alongside key levels and order blocks.
Acknowledgements: Special thanks to @oh92 and @goofoffgoose for their invaluable scripts, which served as inspiration in the development of this advanced trading indicator.
Notes: The script is continually evolving, with ongoing refinements aimed at enhancing accuracy and performance.

Shifted Lines Based on Hourly CandleOverview
The Shifted Lines Based on Hourly Candle indicator plots two dynamic horizontal lines on your chart, offset by a specified price amount above and below the closing price of the last completed hourly candle. These lines update every hour, providing real-time reference levels that can assist in identifying potential support and resistance zones.
How the Indicator Works
• Hourly Close Reference:
• The indicator uses the closing price of the most recent completed hourly candle as a reference point, regardless of your current chart timeframe.
• Price Offset Calculation:
• You can specify a Price Offset value, which determines how far above and below the hourly close the lines will be drawn.
• Upper Level: Calculated by adding the Price Offset to the hourly closing price.
• Lower Level: Calculated by subtracting the Price Offset from the hourly closing price.
• Dynamic Updates:
• The indicator automatically updates the positions of the lines at the start of each new hour, ensuring they always reflect the latest market data.
Settings and Parameters
Input Parameters
• Price Offset
• Description: The amount (in price units) by which the upper and lower lines are offset from the hourly closing price.
• Type: Numerical input (allows decimal values).
• Default Value: 10.0
• Usage: Adjust this value to set your desired offset distance. For instance, if you set it to 5, the upper line will be drawn 5 units above the hourly close, and the lower line will be 5 units below.
Style Settings
In the indicator’s Style tab, you’ll find the following options:
• Upper Level and Lower Level Lines:
• Color: Default is red. You can change it to any color that suits your preference.
• Line Width: Adjust the thickness of the lines for better visibility.
• Precision: Controls the number of decimal places displayed for the level values. It’s recommended to leave this at the default setting to match the instrument’s standard precision.
• Labels and Values:
• Labels on Price Scale: Enabled by default. This displays the current values of the upper and lower levels directly on the price scale, making them easily visible.
• Values in Status Line: Enabled by default. This shows the values of the levels in the status line at the top of the chart when you hover over the indicator.
Note: The default settings are optimized for general use. You don’t need to adjust them unless you have specific visualization preferences.
How to Use the Indicator
1. Adding the Indicator:
• Since the script is private, you can add it to your chart from the list of indicators you’ve been granted access to.
2. Configuring the Price Offset:
• Open the indicator settings by clicking the gear icon next to its name in the chart.
• In the Inputs tab, adjust the Price Offset to your desired value.
3. Interpreting the Lines:
• Upper Level Line:
• Represents a price level above the last hourly close, offset by your specified amount.
• Can act as a potential resistance level.
• Lower Level Line:
• Represents a price level below the last hourly close, offset by your specified amount.
• Can act as a potential support level.
4. Trading Applications:
• Support and Resistance:
• Use the lines to identify key support and resistance areas for potential entry and exit points.
• Breakout Strategies:
• Monitor price action around these levels to spot possible breakouts or reversals.
• Risk Management:
• Incorporate the levels into your stop-loss or take-profit strategies.
Practical Example
Suppose the last hourly candle closed at a price of 1,500, and your Price Offset is set to 10:
• Upper Level: 1,500 + 10 = 1,510
• Lower Level: 1,500 - 10 = 1,490
These levels will be plotted on your chart and will remain until the next hourly candle closes, at which point they will update based on the new closing price.
Notes and Tips
• Timeframe Flexibility:
• The indicator can be applied to any chart timeframe, but it always references the hourly close for consistency.
• No Need to Adjust Precision:
• The Precision setting in the Style tab is optimized for most instruments and typically doesn’t require changes.
• Visual Customization:
• Feel free to adjust the colors and line styles to integrate seamlessly with your chart’s appearance.
• Indicator Access:
• Since the script is private, only users with access can add it to their charts. The source code remains hidden to protect proprietary logic.

[BRAIN] Absolute Volatility of Price
Hello traders!
Today I want to share with you a series of scripts and strategies that I developed a few years ago. This is one of my first works, born from the curiosity of seeing a candlestick representation in a different way, without considering the price movement along the y-axis.
Imagine observing the price movement in dollars and percentages, always starting from the same reference point: the 0 axis. This approach can offer new insights and ideas on how and how much prices move.
To explain it better, the open of each candle does not start from the previous close negotiations but always starts from the 0 axis . In this way, it is possible to clearly compare the bodies of the candles with each other.
Script Visualization Methods and Input
- Study Normal: Simply reports the prices, including the negative ones of the red candles, on the same scale in absolute terms (ABS), as shown in the first indicator above.
- Study Normal Neg: In this version, the red candles vary negatively below zero, instead of in absolute terms above zero, as shown in the second indicator above.
- Study Perc: Similar to "Study Normal" but uses percentage values instead of dollars, useful for very low timeframes and low variations with many decimals, such as 1 minute on EUR/USD.
- Study Perc Neg: Similar to "Study Normal Neg" but uses percentage values.
Additionally, I have added the possibility to display or not, through two buttons, an average of the candle bodies adjustable in length via input and the range of each candle, always correlated in dollars or percentages, as per the main study setting.
I hope this work can be useful to many of you. I invite you to like if you appreciate my scripts and want to see more like these. Do not hesitate to comment or contact me for any doubts or questions.
PS: If you notice that in the script the sum of the percentage values between the shadow and the body of the candle does not correspond to the range, it is only a rounding issue. Change the precision setting to a lower value and you will see that the rounding disappears.
PS: In the script, to better visualize the percentage growth and decline of the instrument on very high timeframes, I decided to represent it as follows:
- If close ≥ open: (high - low) / low * 100
- If close < open: (high - low) / high * 100
The same method is also applied for calculating the percentage variations of the shadows relative to themselves.
I hope you like this version! If you need any further modifications or adjustments, let me know. Good luck with your project!
(In the photos below I show 3 versions of the indicator open on 3 different tickers as an example: from top to bottom in the 3 indicators are set these Study: Study Normal, Study Perc and Study Perc Neg)
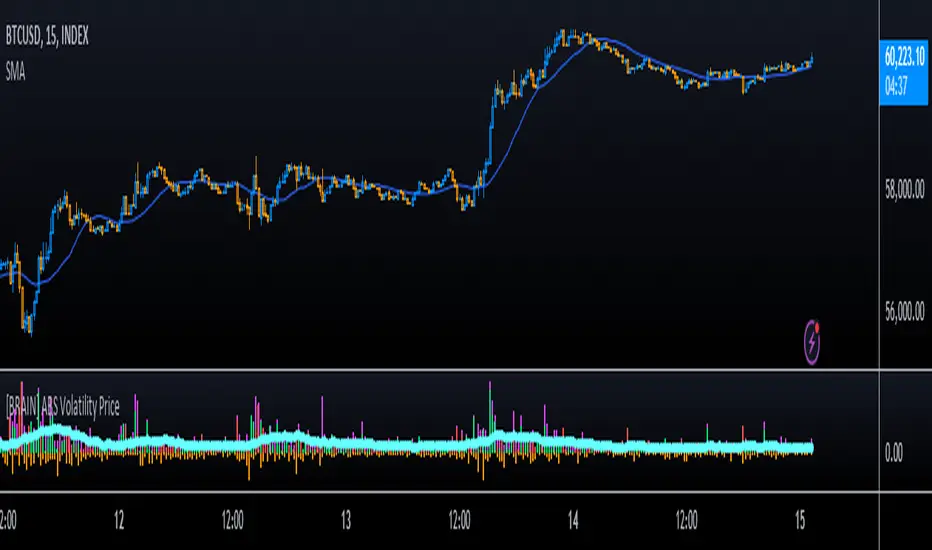
Pure Price Action ICT Tools [LuxAlgo]The Pure Price Action ICT Tools indicator is designed for pure price action analysis, automatically identifying real-time market structures, liquidity levels, order & breaker blocks, and liquidity voids.
Its unique feature lies in its exclusive reliance on price patterns, without being constrained by any user-defined inputs, ensuring a robust and objective analysis of market dynamics.
🔶 MARKET STRUCTURES
A Market Structure Shift, also known as a Change of Character (CHoCH), is a pivotal event in price action analysis indicating a potential change in market sentiment or direction. An MSS occurs when the price reverses from an established trend, signaling that the prevailing trend may be losing momentum and a reversal might be underway. This shift is often identified by key technical patterns, such as a higher low in a downtrend or a lower high in an uptrend, which indicate a weakening of the current trend's strength.
A Break of Structure typically indicates the continuation of the current market trend. This event occurs when the price decisively moves beyond a previous swing high or low, confirming the strength of the prevailing trend. In an uptrend, a BOS is marked by the price breaking above a previous high, while in a downtrend, it is identified by the price breaking below a previous low.
While a Market Structure Shift (MSS) can indicate a potential trend reversal and a Break of Structure (BOS) often confirms trend continuation, they do not assure a complete reversal or continuation. MSS and BOS levels can also function as liquidity zones or areas of price consolidation rather than definitively signaling a change in market direction. Traders should approach these signals cautiously and validate them with additional factors before making trading decisions. For further details on other components of the tool, please refer to the following sections.
🔶 ORDER & BREAKER BLOCKS
Order and Breaker Blocks are key concepts in price action analysis that help traders identify significant levels in the market structure.
Order Blocks are specific price zones where significant buying or selling activity has occurred. These zones often represent the actions of large institutional traders or market makers, who execute substantial orders that impact the market.
Breaker Blocks are specific price zones where a strong reversal occurs, causing a break in the prevailing market structure. These blocks indicate areas where the price encountered significant resistance or support, leading to a reversal.
In summary, Order and Breaker Blocks are essential tools in price action analysis, providing insights into significant market levels influenced by institutional trading activities. These blocks help traders make informed decisions about potential support and resistance levels, trend reversals, and breakout confirmations.
🔶 BUYSIDE & SELLSIDE LIQUIDITY
Both buy-side and sell-side liquidity zones are critical for identifying potential turning points in the market. These zones are where significant buying or selling interest is concentrated, influencing future price movements.
In summary, buy-side and sell-side liquidity provide crucial insights into market demand and supply dynamics, helping traders make informed decisions based on the availability of orders at different price levels.
🔶 LIQUIDITY VOIDS
Liquidity voids are gaps or areas on a price chart where there is a lack of trading activity. These voids represent zones with minimal to no buy or sell orders, often resulting in sharp price movements when the market enters these areas.
In summary, liquidity voids are crucial areas on a price chart characterized by a lack of trading activity. These voids can lead to rapid price movements and increased volatility, making them essential considerations for traders in their analysis and decision-making processes.
🔶 SWING POINTS
Reversal price points are commonly referred to as swing points. Traders often analyze historical swing points to discern market trends and pinpoint potential trade entry and exit points.
Do note that in this script these are subject to backpainting, that is they are not located where they are detected.
The detection of swing points and the unique feature of this script rely exclusively on price action, eliminating the need for numerical user-defined settings. The process begins with detecting short-term swing points:
Short-Term Swing High (STH): Identified as a price peak surrounded by lower highs on both sides.
Short-Term Swing Low (STL): Recognized as a price trough surrounded by higher lows on both sides.
Intermediate-term and long-term swing points are detected using the same approach but with a slight modification. Instead of directly analyzing price candles, previously detected short-term swing points are utilized. For intermediate-term swing points, short-term swing points are analyzed, while for long-term swing points, intermediate-term ones are used.
This method ensures a robust and objective analysis of market dynamics, offering traders reliable insights into market structures. Detected swing points serve as the foundation for identifying market structures, buy-side/sell-side liquidity levels, and order and breaker blocks presented with this tool.
In summary, swing points are essential elements in technical analysis, helping traders identify trends, support, and resistance levels, and optimal entry and exit points. Understanding swing points allows traders to make informed decisions based on the natural price movements in the market.
🔶 SETTINGS
🔹 Market Structures
Market Structures: Toggles the visibility of the market structures, both shifts and breaks.
Detection: An option that allows users to detect market structures based on the significance of swing levels, including short-term, intermediate-term, and long-term.
Market Structure Labels: Controls the visibility of labels that highlight the type of market structure.
Line Style: Customizes the style of the lines representing the market structure.
🔹 Order & Breaker Blocks
Order & Breaker Blocks: Toggles the visibility of the order & breaker blocks.
Detection: An option that allows users to detect order & breaker blocks based on the significance of swing levels, including short-term, intermediate-term, and long-term.
Last Bullish Blocks: Number of the most recent bullish order/breaker blocks to display on the chart.
Last Bearish Blocks: Number of the most recent bearish order/breaker blocks to display on the chart.
Use Candle Body: Allows users to use candle bodies as order block areas instead of the full candle range.
🔹 Buyside & Sellside Liquidity
Buyside & Sellside Liquidity: Toggles the visibility of the buyside & sellside liquidity levels.
Detection: An option that allows users to detect buy-side & sell-side liquidity based on the significance of swing levels, including short-term, intermediate-term, and long-term.
Margin: Sets margin/sensitivity for a liquidity level detection.
Visible Levels: Controls the amount of the liquidity levels/zones to be visualized.
🔹 Liquidity Voids
Liquidity Voids: Enable display of both bullish and bearish liquidity voids.
Threshold Multiplier: Defines the multiplier for the threshold, which is hard-coded to the 200-period ATR range.
Mode: Controls the lookback length for detection and visualization. Present considers the last X bars specified in the option, while Historical includes all available data.
Label: Enable display of a label indicating liquidity voids.
🔹 Swing Highs/Lows
Swing Highs/Lows: Toggles the visibility of the swing levels.
Detection: An option that allows users to detect swing levels based on the significance of swing levels, including short-term, intermediate-term, and long-term.
Label Size: Control the size of swing level labels.
🔶 RELATED SCRIPTS
Pure-Price-Action-Structures.
Market-Structures-(Intrabar).
Buyside-Sellside-Liquidity.
Order-Breaker-Blocks.