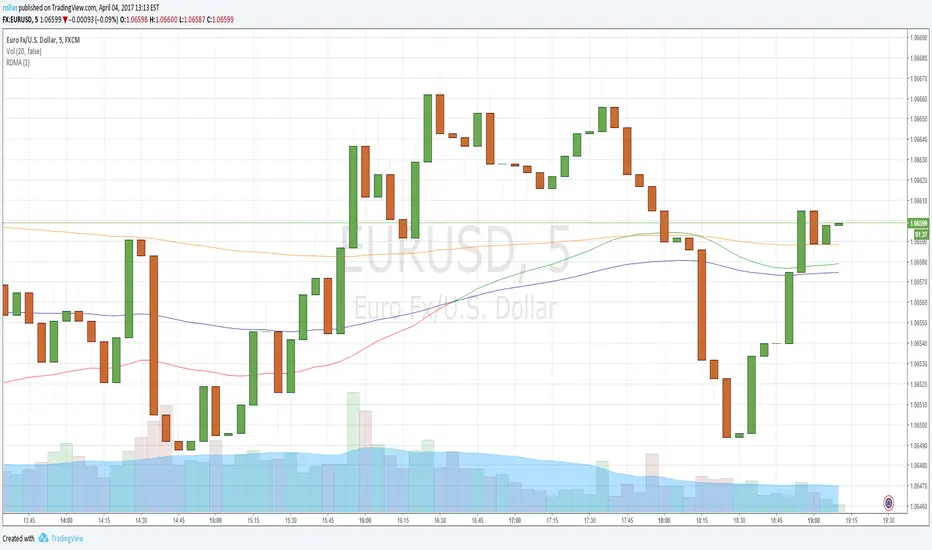
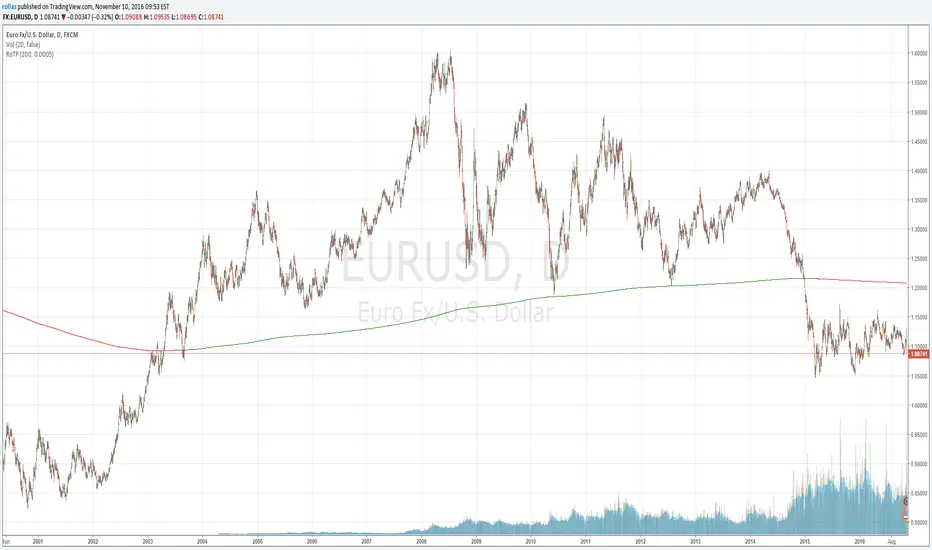
RPATemplate for price action traders. Includes 100 and 200 exponential moving averages, pivot points and background color for Euro and USD shared session zone.
Priceaction

Price Action Channel Master by JustUncleLThis indicator combines a number of PAC types into one indicator and will replace some of my previously PAC scripts (some were not published).
It draws a Moving Average (MA) channel based on various boundary criteria. Even though the MA choices are not limited to SMA and EMA, these would be the your first choices with most PAC requirements, feel free to experiment though.
Optional Bar colouring around that channel.
Options Available:
(1) Select between 11 different types of moving averages for the base (centre) MA line choices are :
SMA = Simple Moving Average (default)
EMA = Exponential Moving Average.
WMA = Weighted Moving Average
VWMA = Volume Weighted Moving Average
SMMA = Smoothed Simple Moving Average.
DEMA = Double Exponential Moving Average
TEMA = Triple Exponential Moving Average.
HullMA = Hull Moving Average
SSMA = Ehlers Super Smoother Moving average
ZEMA = Near Zero Lag Exponential Moving Average.
TMA = Triangular (smoothed) Simple Moving Average.
(2) Select Channel Boundary Criteria:
HILO = Channel boundaries based on High and Low MAs (default).
ATR = Channel boundaries are Multiplier * ATR distance from base line
PIP = Channel boundaries are Multiplier * PIPs distance from base line
STDEV = Channel boundaries are Multiplier * StdDev(price) distance from base line (this is the same as Bollinger bands if SMA is the base MA)
KC = Channel boundaries are Multiplier * StdDev(True Range) distance from base line (this is the same as Keltner channel if SMA is the base MA)
(3) Option to display coloured Candles around the Ribbon, the colouring uses the Default candle 3-tone colour scheme:
Lime = candle closed above Ribbon.
Red = candle closed below Ribbon.
Gray = Candle Closed inside Ribbon.
The Grab candles 6-tone colour scheme:
Lime = Bull candle closed above Ribbon.
Green = Bear candle closed above Ribbon.
Red = Bull candle closed below Ribbon.
DarkRed = Bear candle closed below Ribbon.
Aqua = Bull candle closed inside Ribbon.
Blue = Bear candle closed inside Ribbon.

Price Action Trend Reversal Prediction V1To use this indicator click on "Add to Favorites". In your chart add it as you would any any other indicator.
Version 1 of this script supports Buy/Long actions.
*** This is a predictive indicator based off previous bars data, not current bars action. There is no such thing as a 100% correct indicator ***
This is based on 9 day consecutive price action.
Each day the criteria is met in a row the green will become brighter.
Once it hits the 9th day the indicator will be bright green with half of it aqua.
If it meets the criteria for a perfect reversal the indicator will be all aqua.
Version 2 will include Sell/Short indication as well.

[naoligo] Pivot Points (Daily)Suporte/Resistência do Pivot diário para gráficos intraday
Marcação do S/R tradicional e S/R Fibonacci
Daily Pivot Point Support/Resistances on intraday charts
Both Traditional and Fibonacci methods plotted

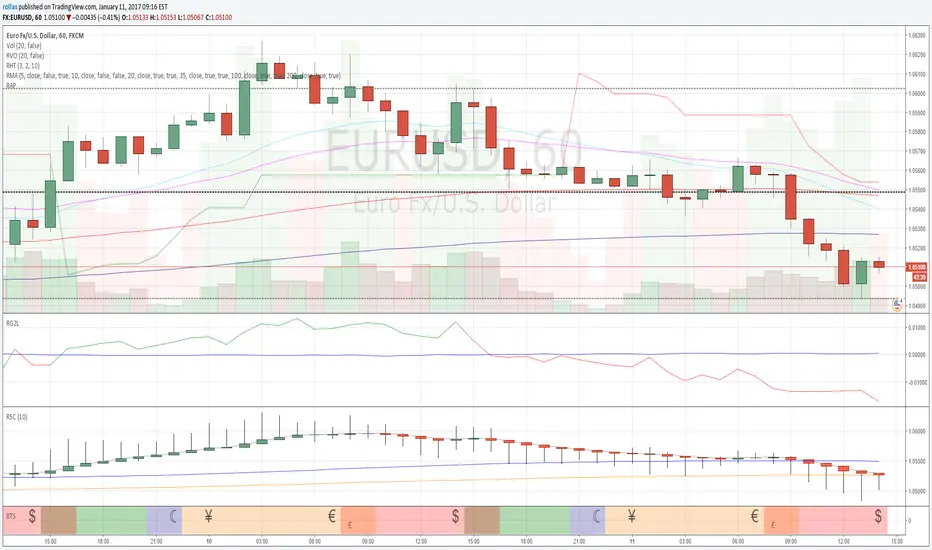
Dynamic Moving AverageAll moving averages adapt to different time frames preserving their functionalities. Blue one is either support or resistance depending on the situation. Orange is the trend indicator. Third moving average alternates between red and green depending on crossing over/under the blue moving average. Threshold is in pips and sets the amount of pips three moving averages get in range to fire an alarm.
FriendlyTrend Signal//FriendlyTrend Signal//
Our Tradingview representation of our strategy. Trend-Following techniques combining analysis of buying and selling on fractals, entering low-risk positions at counter-trend points, and trailing-stop orders along moving averages.
//Strategy//
Red/Green circles indicate counter-trend entry positions. These are not lagging and form on the closing of the corresponding bar. Best opportunities for a credit, debit, or other defined-risk options spreads and closed if the trade goes against us directionally with the stop loss above the high or below the low of the previous bar on market close.
Lines represent fractal support and resistance. We execute a buy if the moving average cloud is green and the green line is broken and the price closes above. Reverse for selling.
Cloud represents long or short opportunities. If the top cloud and bottom cloud are intertwined we are sidelined & wait for a large move in one direction or the other. The middle moving average is our trailing stop & another counter-trend entry point if a major support level is broken at the moving average itself.
//Still refining the code into a Tradingview Strategy form. More to come...//

Free BirdShows the move of the symbol When not correlated with the source index. Gives the upward or downward tendency when symbol moves uncorrelated that can be used to determine the flow.
The flow curve gives an general idea while the move is more precise showing pure price action.

UltraTrends.V2This is version 2 of Ultratrends.
Like the last version:
Fuschia is pivot down, yellow is pivot up, up is confirmed up, down is confirmed down, green is uptrend, red is downtrend, gray is no trend.
"UP" Is a good indication that the market is going to go up. "DOWN" is a good indication that the market will go down. However, use your head. Think about support / resistance.
Additions:
- 200 EMA/SMA Average (Thick aqua line): Great for determining trend and acts as support / resistance.
- 50 SMA (thin yellow line): Use for 50/200 crosses to determine trend. Serves as weaker resistance.
- Dynamic Pivot points (by finn): Serve as support / resistance levels. Plotted as horizontal dots.
- Early move detection: demonstrated by either a green triangle below bar or red triangle above bar.
- "Hot Zones": volume based background highlighting the manifestation of bullish conditions. Default color is white, so if you use a lighter background, please change it to another color.
This indicator works best with 1337 Volume:
The only way to get this script is by joining Gambit Private Trading Room. There are currently ~ 90 experienced traders in the room at the time of this post that share the best ideas / setups. For more information, please fill out the form at: GambitCrypto.com
Enjoy

HYPER PIVOT V2As requested added two more Fib levels. 0.618 and 1.272. Turn them off from style menu if no need.


Gain Over LossSelf adjusting gain over loss indicator. Shows price movement and momentum. If you want to reach to the parameters you can use the old version.


HYPER ADX V5Fixed rendering problen at progressing bars for ultra low time frames. Added alert options for cross types.


Price-Actionclassic patterns.
daily charts.
CPR-
Green+level=buy
red+level=sell
pinbar
green pinbar+level=buy
red pinbar+level=sell
green ppr+level=buy
ppr-
red ppr+level=sell
IB- and OB-
green IB/OB+level=buy
red IB/OB+level=sell
third bar
green third bar+green cpr+level=buy
red third bar+redcpr+level=sell
3 candles green = buy, tp30 pips(gbpusd,gbpjpy)
3 candles red = sell, tp30 pips. (gbpusd,gbpjpy)

Ro Hidden Volatility OverlayWorks only on Forex pairs. See the inside bar volatility. Use precision to get data from lower time frames. Be aware that script initialization will be slower with the precision going higher. Added an option to show average volatility for long term as forex market transactions grow rapidly, suppressing all other markets. Bar color changes to green when volatility exceeds average.
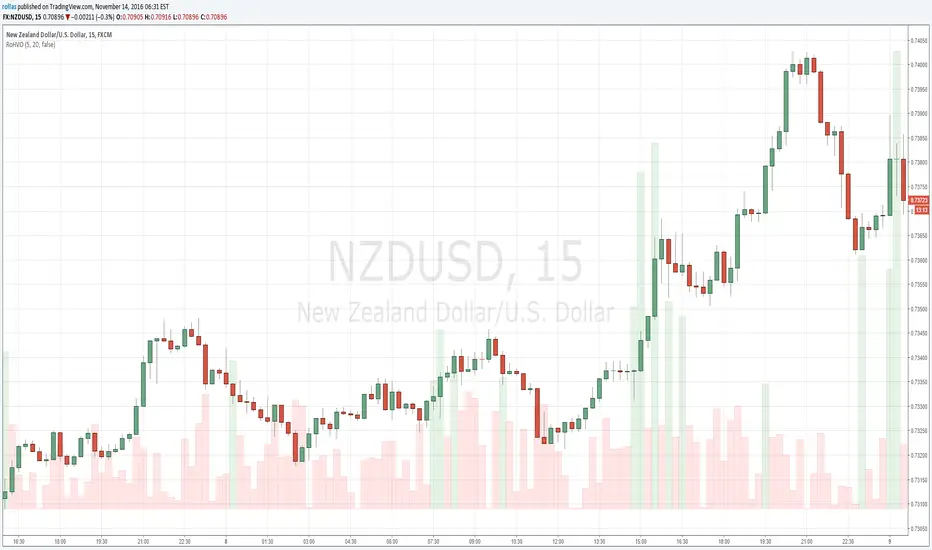
Ro Hidden Volatility V2.0Works only on Forex pairs. See the inside bar volatility. Use precision to get data from lower time frames. Be aware that script initialization will be slower with the precision going higher. Added an option to show average volatility for long term as forex market transactions grow rapidly, suppressing all other markets.

Ro Hidden VolatilityWorks only on Forex pairs. See the inside bar volatility. Use precision to get data from lower time frames. Be aware that script initialization will be slower with the precision going higher.

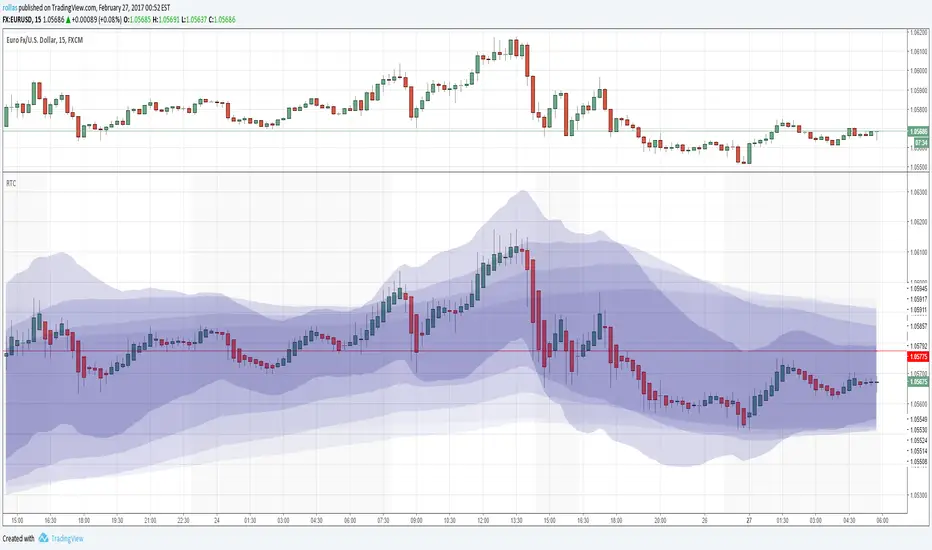
Ro True PriceGiven enough time, market tends to oscillate around the true price. The true price slope gives information about the long term trend. Ro True Price lights red when the trend is down, green for up. If the color is blue market is in a decision period. For intraday lower the precission value to make signal sensitive to short term action.
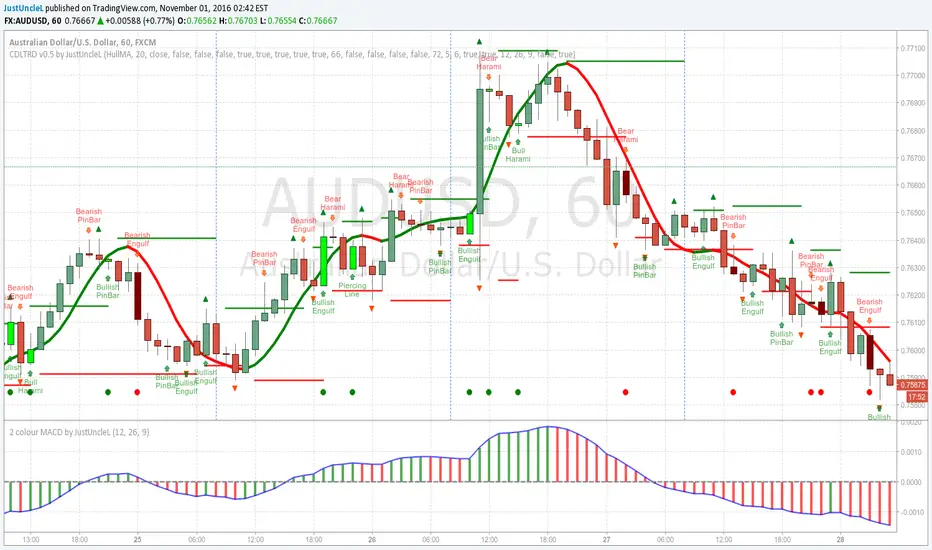
Candlestick Trend Indicator v0.5 by JustUncleLRequested Update to this Indicator alert project. In this update I have added the option to be able select which Price Action candles you want included in the display and the generated alarm Alert. Other changes also included in this update:
Also added a Price Action candle for "Last Fractal S/R Break", this also a good continuation indication.
Added option to select a different moving average types for directional MA line.
Modified some default settings, using HullMA instead of Zero Lag EMA and standard MACD settings(12,26,9).
Description:
This is a trend following indicator and alert for Binary Options based on Candlestick patterns and trend line -
NOTE: original system was a forex trading system.
This code combines a number of indicators to create an overall trading strategy.
The indicator recognises and displays some useful candle named defined patterns that are used to support trend continuation:
Bearish + Bullish PinBars
Dark Cloud Cover
Piecing Line
Bullish + Bearish Harami
Bullish + Bearish Engulfing Candle
Bullish + Bearish Last Fractal S/R break
Also recognises main Price Action candles from ChrisMoody (CM), the four(4) price action patterns are colored coded bars:
Yellow = Inside Bar - breakout/continuance
Orange = Outside Bar - breakout/continuance
Aqua/Fuschia = Up/Down Shaved Bars - Buying/Selling pressure
Red/Green = Possible reversal PinBars - Reverse Down / reverse Up
The highlighted candles (maroon and darker green) represent the defined PA patterns that have been confirmed following the current trend direction that is indicated by the Hull MA(20) line (can select a different type of MA, or even disable) and confirmed by MACD direction (can be disabled). The confirmed Alerts are indication by green (buy) and red (sell) dots at the bottom of the chart. An alert is generated from this selection for the alert condition of the alarming system.
The fractal upper/lower break lines are also draw, if the (optional) last fractal break line is broken by a highlighted bar then this indicates a stronger trend conformation.
The MACD indicator MACD DEUTER 2 colour(12,26,9) you can visually see the MACD histogram colours with MACD direction - needs "MACD DEUTER 2 colour" indicator.
This multi-indicator set up is suitable for 1hr, 4hr and daily charts with 1-4 candle expiry.
References and Inspiration from:
Fractal Levels by RicardoSantos
Almost Zero Lag EMA
Candlestick Patterns With EMA by rmwaddelljr
CM_Price-Action-Bars by ChrisMoody
www.forexstrategiesresources.com
"Scalp Jockey - MTF MA Cross Visual Strategizer by JayRogers"
Ro G2L AdvancedGain over Loss Movement indicator with adjustable parameters. Also added an option to show cumulative gain/loss graph.
