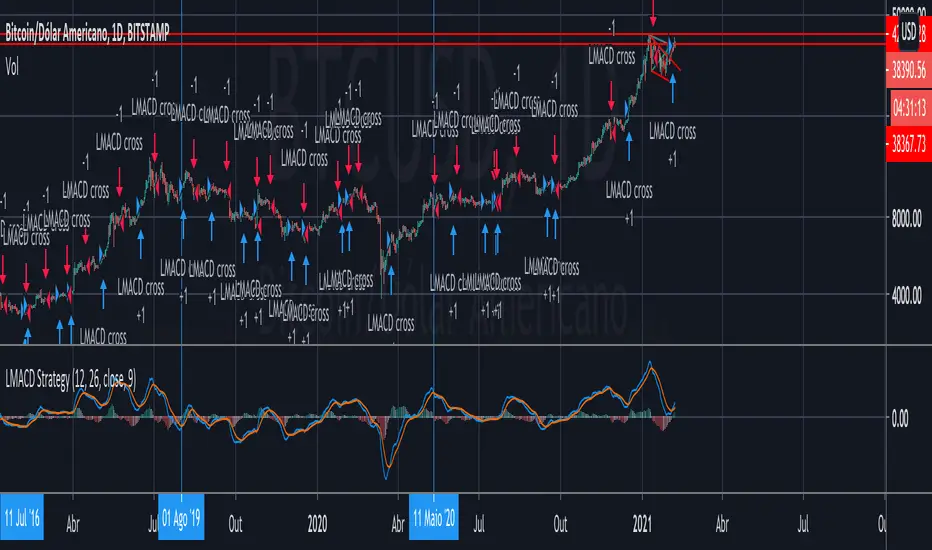
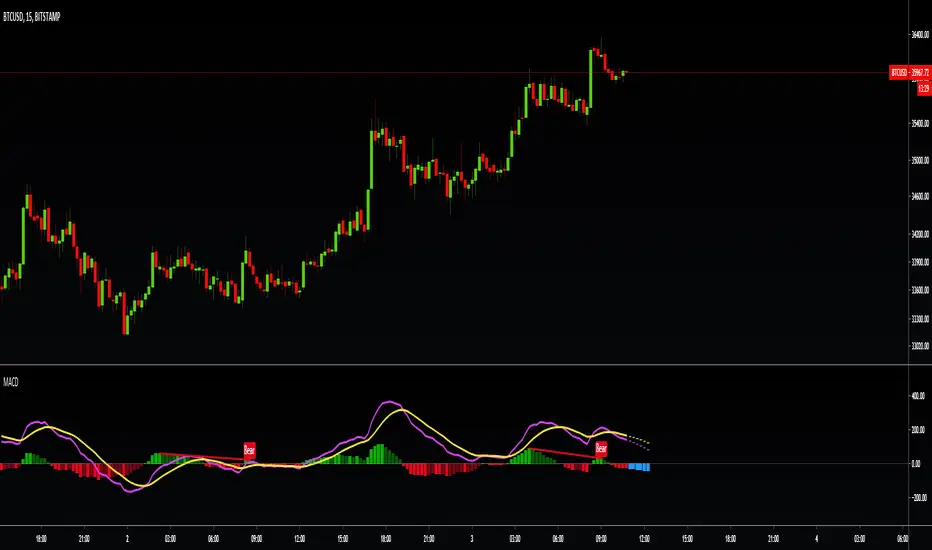
[FTA] Logarithmic MACD with Regular and Hidden DivergencesThis is a highly stable, volatility adaptive, Moving Average Convergence Divergence (MACD) that uses a modified calculation based on improved logarithmic measurements of the momentum.
1- This MACD provides the trader with most accurate detection of divergences, both regular and hidden ones, and shows them on the MACD Histogram.
2- Furthermore, the MACD/Signal divergences are also easily detectable (unlike the regular MACD which often does not provide accurate divergences; see the screenshot for comparison).
3- Finally, due to some different calculation methods, this MACD, unlike the regular MACD, is highly stable in higher time frames even in the most volatile markets (such as BTC, ETH, ADA, etc...) and thus can easily be utilized for the market prediction state in the crypto (see the screenshot for comparison).
Use it and let me know what you think about it in comparison to regular MACD!
Схождение/расхождение скользящих средних (MACD)

Customizable Percentage Price Oscillator (PPO)The PPO is basically the MACD but in percentage terms. This is better for comparing momentum across different securities.
This script is a standard PPO but with many options for customization. You can set the moving average type of the signal and the oscillator lines separately. You can also weight any moving average of the PPO by volume.
Supported Types of MA:
SMA
EMA
ALMA
HMA
WMA
Personally, I believe weighting by volume is helpful across markets but especially helpful for equities. I like to use 3,10,16 settings similar to Linda Raschke but with EMA instead of SMA. This indicator is especially useful for signaling trend continuation and generating exit signals. For entries, I believe this indicator should not be blindly followed and works better when combined with a trend or price action signal.
If there are requests for more types of moving average to be used with the PPO, I would be down to implement them, but I believe most moving averages are pretty similar.

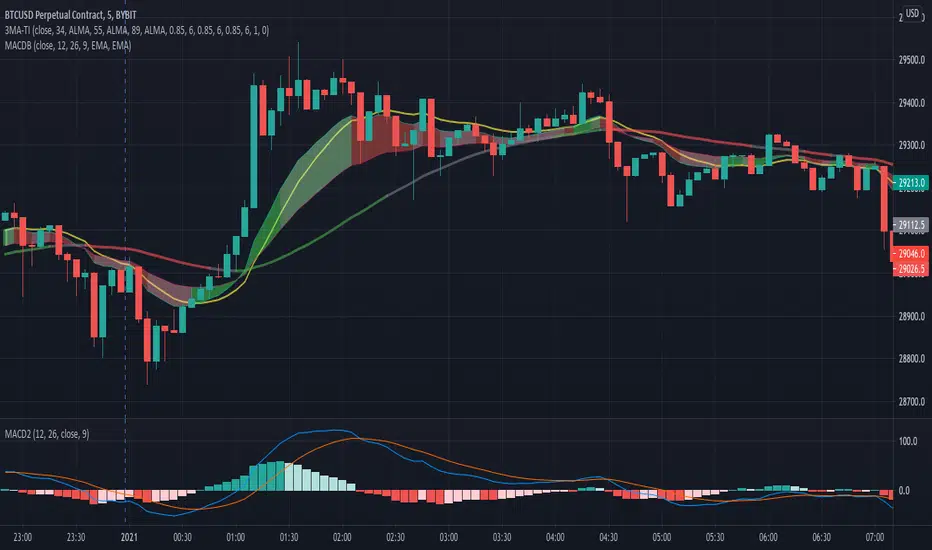
MACD BandsThis is MACD indicator on the price chart. You can read the same information as the original MACD but much more.
You can use it the same way as MACD but it won't use any space below your chart. Also you can use signal line and cloud as trend confirmation: e.g. if above them it can be a stronger uptrend.
The signal line (yellow by default) can be used as a support-resistance line.
If teal line is above maroon line, MACD is positive, otherwise it is negative
MACD value is the width of the cloud
Cloud color is green when MACD histogram is positive, red if negative
You can change MA types
MACD and histogram values can be seen in Data Window
Jim's MACDMACD Buy/Sell Strategy
Filters bearish crossovers above the 0 line and bullish crossovers below.
Uses 34 ema to further filter the trades and take only longs above and only shorts below.
Apply at least 2:1 risk to reward ratio to account for losing trades.
Trade at own risk!

Dominant Cycle Adaptive MACDThis Indicator is based on classic MACD but with an exceptional smoothing.
This smoothing eliminates the noise of the classic MACD as you see in the Chart
Adaptive MACD is compiled using with two adaptive moving averages, one adaptive to the dominant cycle and the other adaptive to twice the dominant cycle. As the basic behind the MACD is the difference of two moving averages we cannot find much difference between the conventional MACD (12, 26) and the adaptive MACD. However the adaptive MACD is less prone for less whipsaws and it catches the trends very well at the same time the catches the turning points in time. The Adaptive MACD is definite one notch better than the conventional MACD.
Dominant Cycle Period is calculated using Ehler's Method {Mentioned in the code}
This is how the Adaptiveness Impacts the Price Chart
1. (12, 26 EMA) VS Adaptive Dominant Cycle EMA
2. See how the Adaptive Lengths {both FastLength and SlowLength changes with time!}
Enjoy!

JamesCart's Feigenbaum Constant/Rate Of Change indicatorThis is an indicator that compares the rate of change as a proportion to the Feigenbaum Constant (The black line). The green line is a positive divergence from the rate of change, the red is a negative divergence from the rate of change. When the Red line is on top and the green line is on the bottom, then that is a bearish trend. When the Green is on top and the red is on bottom, that is a bullish trend. The black line also helps indicate a general bullish or bearish trend based on how it moves.
When the lines "open up" that means a trend is beginning, when the lines close that means the trend is ending. This indicator is a powerful leading indicator and needs sensitive eyes. Every small movement needs to be given consideration.

Volume Weighted MACD with Named PlotsLiterally just copied VWMACD but named the plot lines to make setting alerts more clear.


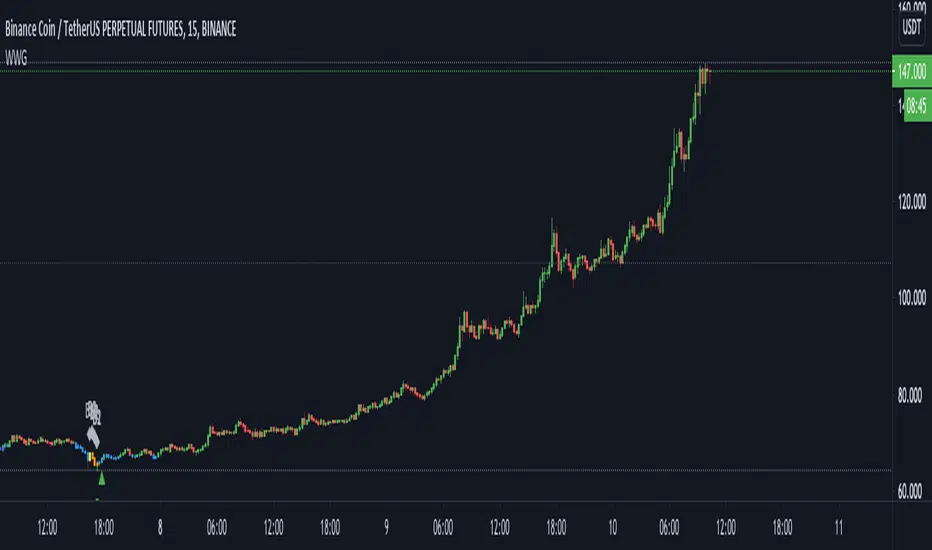
The WWG Plan Indicator V2█ OVERALL
This indicator was specifically created for the Walsh Wealth Group.
In short it is a fusion of some of the most basic and widely used indicators to show overbought patterns and trend reversals.
Its best usage is with LTF scalping and agressive profit taking but can also be used to find HTF dips and buy-zones.
█ FEATURES
Buy Signal (Buy):
Printed only with all confirmations triggered
Small Buy Signal (B1 & B2)
Printed if some of the confirmations are triggered and can be treated as DCA entries or for further
confirmation with other indicators and basic TA.
Crayons (Color Bars):
Blue: RSI is oversold
Olive: RSI and Stoch RSI are oversold
Yellow: RSI, Stoch RSI are oversold and lower Bollinger Bands are crossed by Low
Orange: RSI, Stoch RSI and CCI are oversold
Trailing SL:
If activated in the config, a trailing SL can be displayed on the chart based on ATR.
█ SETTINGS
The underlying indicators used are RSI, Stoch RSI, Bollinger Bands, MACD and CCI.
All possible configs can be changed in the config settings.
█ GENERAL INFORMATION
Depending on the settings, the indicator performance will be highly affected.
This indicator is only displaying highly oversold areas and events of trend reversal it is not a *God*-Signal and will print false positives.
█ ALERTS
An alert for the main buy-signal is implemented and can be used via the TV alert functionality.
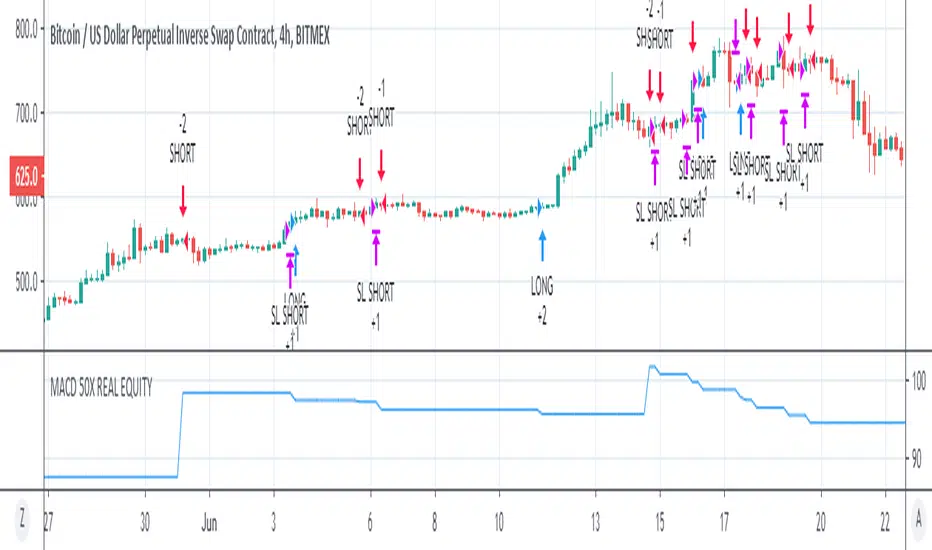
MACD 50x Leveraged Strategy Real Equity Simulation Hello, I wrote this script to merge the two scripts I shared before.
The aim here is to see the real value of the state of the capital as a result of leveraged transactions and to combine both long and short directions.
Scripts :
MACD Long 50x Leverage Strategy :
MACD Short 50x Leverage Strategy :
The parameters have not changed so they are the same as the previous two scripts:
Adding margin: Forbidden or not specified. (Add Margin : No)
Position Size : %1 (0.01) (For each trade)
Stop-Loss : %2 (For each trade)
Long : Crossover(delta,0) (Standard MACD)
Long Exit : Long Stop Level or Short Entry
(In the case of Long Stop, all trades are closed and no positions are opened in short direction.)
Short : Crossunder(delta,0) (Standard MACD)
Short Exit : Short Stop or Long Entry
(In the case of Short Stop, all trades are closed and no positions are opened in the long direction.)
NOTE :
This is a simulation made using standard parameters, showing the state of the balance in very simple rules with leveraged transactions only.
The nice thing here is the direct observation of the results by making modifications on the strategy parameters.
Regards.
EMA Cross and MACD Signal CombinedThe rule is simple.
When MACD crosses up, it is supposed to give a buy signal. However, before entering into a Long position, there is a need for a confirmation. This confirmation can be from a down trendline breakout or from another indicator.
In this case, I've chosen the Exponential Moving Average Cross to be as the confirmation.
The Buy Signal will appear when there it fulfills the following conditions:-
i. The MACD line is above the Signal Line
ii. The fast EMA crosses the Slow EMA
The Sell signal will appears when the opposite of the above condition is met.
This indicator is meant for the Swing Trader whom would like to hold a position for a long time.

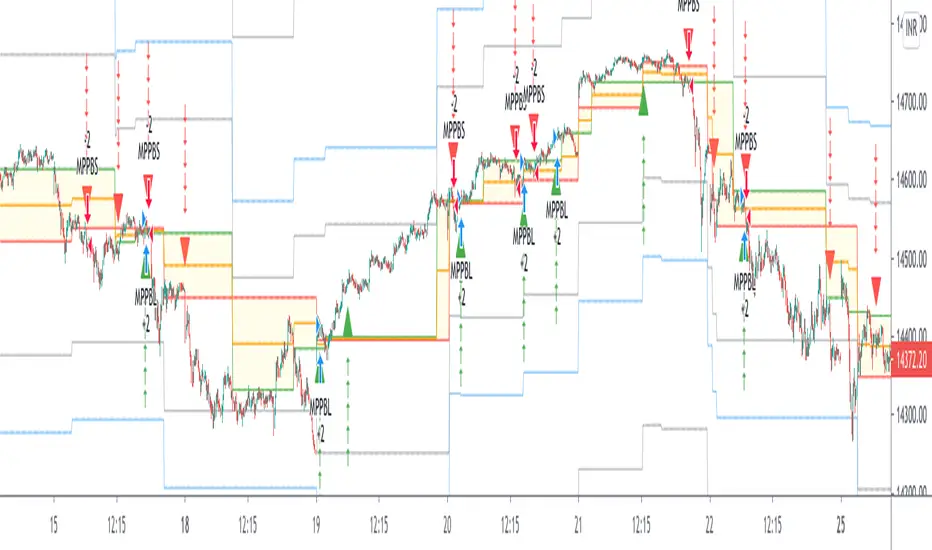
MACD Price Projected Bands [MPPB] Strategy for NIFTY / BTC 2 minMACD Price Projected Bands is an intraday NON REPAINTING Strategy to be used over BTCUSD and NIFTY on 2mins charts for optimum results!!
How the Strategy works
The strategy uses MACD with standard configuration as its main component.
The adaptive Bands are calculated over the MACD lookback, and MACD crosses of the adaptive bands are projected over the Price for creating a decision logic
A cyclic Trend Filter is used to calculate the Optimum Entry and Exit Points for the Strategy,
Levels are also plotted over the price projected bands for better visualisation of the targets!
What is used !
Macd_config : { fast:12 , slow:26 , signal:9 }
Lookback Length : 55
The Strategy has Provision for Alerts
You get Two signals
1. MPPBS Buy Signal
2. MPPBS Sell Signal
How the Visual Target System Works and How to trade Using this Strategy
An Adaptive Projected Band is constructed using MACD for traders to get Visual inputs regarding targets!!
The Trading Methodologies are in below Charts
For Short Trades
For Long Trades
Strategy Configurations for Backtest
For Englishmen!
The Backtesting Rules in the Strategy calculates only when order gets filled, the basic pyramiding in the strategy is set to 1, i.e The maximum number of entries allowed in the same direction is set to 1,
Also we trade only 1 quantity of the security with initial capital of 100000USD, and The commission type used in the strategy is set to 0.05 USD that means we pay 0.05USD as commissions in every trade!
For Coders!
{
calc_on_order_fills=true,
pyramiding=1,
default_qty_type=strategy.fixed,
default_qty_value=1,
initial_capital=100000,
currency=currency.USD,
commission_type= strategy.commission.cash_per_order,
commission_value = 0.05
}
How can you get access
Only do private message to me, donot use comment box for requesting access!
RSI of MACD Strategy [Long only]This strategy uses the RSI on MACD indicator.
BUY
====
When RSI indicator crossing over 30 or 35 line and price above slow ema
Note: when the position already taken, you may reenter on the purple candle
Partial Exit
==========
Partial profit taking option is available in settings. If this is selected , 1/3 position exited when RSI indicator crossing down 80 line
Close
=====
When RSI indicator crossing below 15
Stop Loss
=========
I havent used hard stop loss in this strategy. Reason is , when price going down , indicator may go up ... so just wanted to ride along with indicator ...
Stop loss mentioned in the settings is used in calculation of how many units can be be purchased based on risk level
Tested with SPY and QQQ ETFs on hourly chart
Warning
=========
For the eductional purposes only ...
This is not a financial advise. please do your own research before taking any trading decission

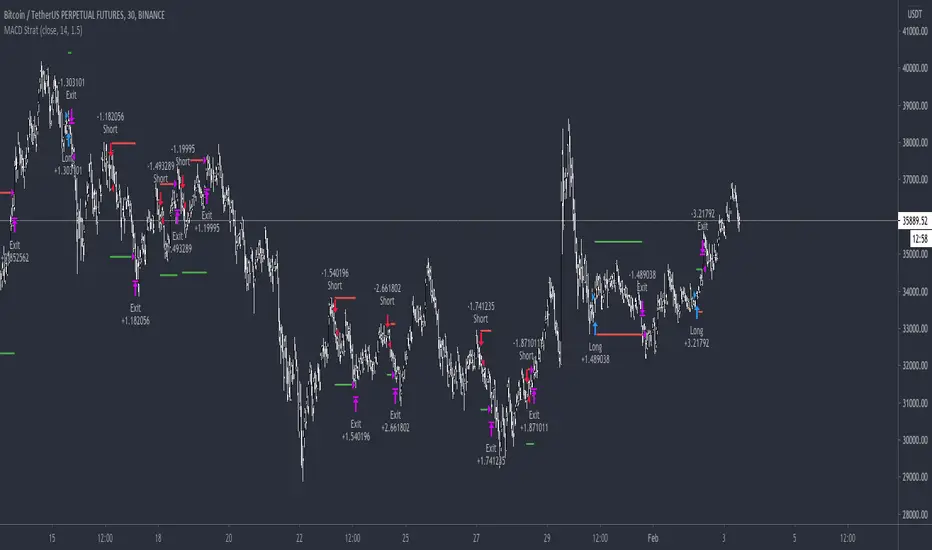
MACD Strategy (SL/TP Levels and Risk Management)Strategy based on MACD and EMA.
- Risk/Reward Ratio can be adjusted
- SL level can be slightly adjusted (Takes the last low/high as SL)
- Visual representation of SL and TP levels
- Risk management => 1 % max loss on a trade
MACD including 6-period Forecast and Divergences█ OVERVIEW
This is my personal interpretation of the classic MACD Indicator. I am using the MACD as part of my analysis, and often I was wondering when I can expect the next signal (e.g. a Histogram cross). As I had come across some EMA forecast logics on tradingview, my goal was to use the EMA forecast calculation as basis to come to a complete MACD forecast. Here is the result.
Starting point is the classic MACD which is then plotted with MACD-Line, Signal Line and Histogram. In addition to the classic MACD, a 6 period Forecast for MACD, Signal and Histogram is available and divergences can be displayed on either the Histogram or the MACD Line.
Important:
As I am considering the closing price of the current candle as the basis for the calculation, the forecast values will REPAINT. But in my opinion this is fine as this indicator will not provide direct trading signals, but more an outlook into a potential future.
█ CALCULATION LOGIC
Below some details regarding the additional functionalities:
MACD Forecast:
The MACD Forecast is mainly based on a combination of EMA Forecasts. The inspiration for this basic forecast calculation is taken from the below tradingview members:
--> EMA Forecast input taken from "Triple MA Forecast" by yatrader2
--> Forecast Bias input taken from "Fancy Bollinger Bands" by BigBitsIO
When showing the forecast, the following options are available:
- Forecast Type: Determines if the Forecast is assuming a Flat price (last values of the MA calculation are replaced by current value) or if a Linear Regression is taken
- Number of candles taken for Linear Regression Calculation
- Bias of Forecast (Based on the recent Average True Range, the forecast values are either more bullish or more bearish calculated. "Neutral" turns off this function)
- Number of ATR Periods used to calculate Bias adjustment value
- Possibility to weight the Bias via a Multiplier - Default value is 1
Based on the above inputs, the forecasted values for MACD, Signal Line and Histogram are calculated and plotted for the next 6 periods.
Divergence Detection:
Based on the default tradingview divergence script with some adjustments:
- User can select to use either Histogram or MACD Line as basis for Divergence detection (Histogram by default)
- User can select if Divergence detection should be based on the candles including Wicks or only the Candle Bodies (Wicks by default)
█ DISCLAIMER
This is an experimental indicator and I do not know if my theory works in real life. So treat this not as financial advise, but purely for entertainment and educational purposes.
I publish this code open so that everyone can re-use it or hopefully even improve it.
Let me know if you have any ideas for improvement and if it is within my coding capabilities (which to be honest are quite limited), I will try to accomodate it.
Have fun.
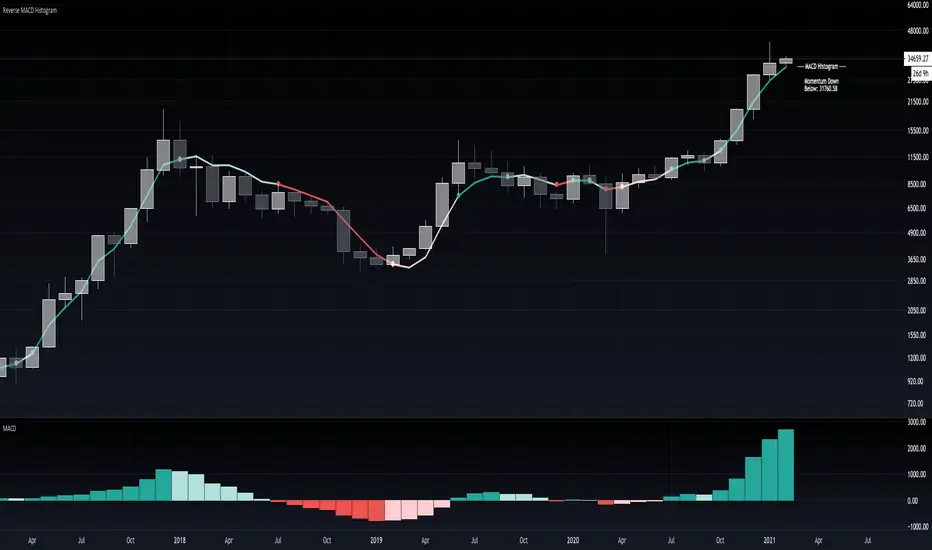
On Chart Reverse MACD HistogramThe On Chart Reverse MACD Histogram is a visual representational spin of the original MACD Histogram to assist the end-user in their decision making for entry, exit and risk management, as well as freeing up space for the chart.
The On Chart Reverse MACD Histogram, which very basically is a reverse engineered calculation of the MACD's Histogram gives the user a visual representation of the relationship between the current price and the MACD's Histogram on the chart instead of having to reference the MACD itself. At a glance this can then be used to visually see on the chart the closing price level needed in order to change the MACD's Histogram momentum either up or down.
Optional Settings Include:
-------------------------------
1.) Show/Hide Reverse MACD Histogram Momentum text
2.) Change the Reverse MACD Histogram Momentum information type (Basic/Detailed)
3.) Change the Reverse MACD Histogram Momentum text size
4.) Change the Reverse MACD Histogram Momentum text color
5.) Change the Reverse MACD Histogram Momentum text left margin
6.) Show/hide the Reverse MACD Histogram Momentum text currency
7.) Change the Reverse MACD Histogram Momentum text decimal value
8.) Show/hide the MACD Histogram Momentum Level
9.) Show the MACD Histogram Momentum Level As Columns *
* Please Note: When using the "Show Histogram Level As Columns" setting, in order to display this feature correctly without distorting the chart, click the ⚙️ (cog) icon in the bottom right corner of your chart and select the 'Scale Price Chart Only' option.
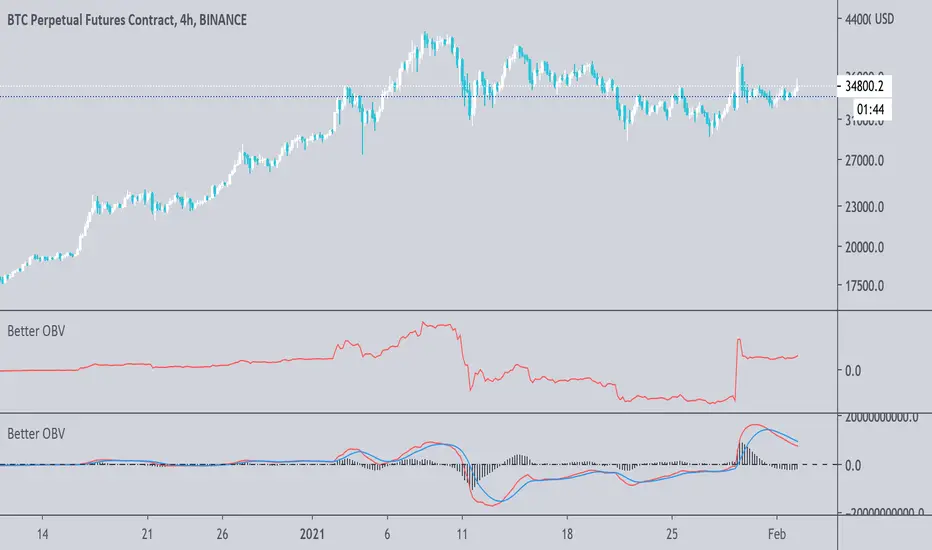
Better OBVOBV with William C. Garrett's Approximation
In the classical OBV (On-Balance Volume) indicator, it simply takes the idea from traditional tape reading - treat the "up tick" as Buy, "down tick" as Sell, and it assumes no change in price as neutral* (*which is not the case in tape reading).
When it comes to interpret the daily volume as such, errors will add up cumulatively. For example, there are days when a Doji Star with high volume just merely one cent higher than yesterday price and the whole day volume would be taken as a BUY Volume....
Here is a gentlemen, William C. Garrett, attempted to break down the daily volume into two parts in his book - "Torque Analysis of Stock Market Cycle".
Published indicator has two modes: Cumulative and Time Segmented. Time Segmented Volume (TSV) - performs a MACD operation on the Garrett Money Flow.
Note on Divergence:
When using a indicator as Time Segmented Money Flow, divergence would surely occur on and off. This is where Wyckoff 3rd principle comes into play - "Effort vs Result" that is not matching. Meaning that the cumulation of shares goes in one direction while the price goes another direction.
MACD Seasons by Dr Ken Longthis specific Moving Average Divergence Convergence Seasons Indicator is made by Dr Ken Long Tortoise Capital brings a unique way of the flow of the market, the 4 seasons are used to describe the areas of the MACD so for example when the area is below zero and hasn't crossed the EMA 5 we call that winter which is very bear bias, once you get support in winter and crosses above the EMA 5 we call that fall which is the first indication of support for price and some weakness toward the downside. if the MACD is above the zero line we call that summer which is a very bull bias valued area, and once it crosses below the EMA 5 then that's where we call fall mode showing us weakness and very slight indication of a possible reversal. the MACD can be both used for swing trade and day trading, it provides a unique insight to the markets showing the layers of a trend using seasons.

MACD with Lines - ChartWhat is MACD with Lines - Chart and why do you need it?
I use it for chart analysis to identify key macd /signal levels from which bullish / bearish market structure continues to develop.
Chart means that every Macd /Signal cross above/below the signal lines will be notified on your Chart and not on your MACD Indicator. To see them on your chart please choose "MACD with Lines - Default" in my library.
Once Signal, Macd or the Histogramm cross over or under your upper or lower signal line you will see background colors which you can adjust in the settings menu.
This small indicator is for a larger project which will be uploaded in several days/weeks.

MACD with Lines - DefaultWhat is MACD with Lines - Default and why do you need it?
I use it for chart analysis to identify key macd/signal levels from which bullish/bearish market structure continues to develop.
Default means that every Macd/Signal cross above/below the signal lines will be notified on your MACD Indicator and not on your chart. To see them on your chart please choose "MACD with Lines - Chart" in my library.
Once Signal,Macd or the Histogramm cross over or under your upper or lower signal line you will see background colors which you can adjust in the settings menu.
This small indicator is for a larger project which will be uploaded in several days/weeks.

Combo Backtest 123 Reversal & MACD Crossover with Trail and Stop
This is a modification of @HPotter "Combo Backtest 123 Reversal & MACD Crossover" script.
I've added a trail stop, basic leverage simulation and stop loss.
Below is HPotter's explanation of the script principals.
First strategy
This System was created from the Book "How I Tripled My Money In The
Futures Market" by Ulf Jensen, Page 183. This is reverse type of strategies.
The strategy buys at market, if close price is higher than the previous close
during 2 days and the meaning of 9-days Stochastic Slow Oscillator is lower than 50.
The strategy sells at market, if close price is lower than the previous close price
during 2 days and the meaning of 9-days Stochastic Fast Oscillator is higher than 50.
Second strategy
MACD – Moving Average Convergence Divergence. The MACD is calculated
by subtracting a 26-day moving average of a security's price from a
12-day moving average of its price. The result is an indicator that
oscillates above and below zero. When the MACD is above zero, it means
the 12-day moving average is higher than the 26-day moving average.
This is bullish as it shows that current expectations (i.e., the 12-day
moving average) are more bullish than previous expectations (i.e., the
26-day average). This implies a bullish , or upward, shift in the supply/demand
lines. When the MACD falls below zero, it means that the 12-day moving average
is less than the 26-day moving average, implying a bearish shift in the
supply/demand lines.
A 9-day moving average of the MACD (not of the security's price) is usually
plotted on top of the MACD indicator. This line is referred to as the "signal"
line. The signal line anticipates the convergence of the two moving averages
(i.e., the movement of the MACD toward the zero line).
Let's consider the rational behind this technique. The MACD is the difference
between two moving averages of price. When the shorter-term moving average rises
above the longer-term moving average (i.e., the MACD rises above zero), it means
that investor expectations are becoming more bullish (i.e., there has been an
upward shift in the supply/demand lines). By plotting a 9-day moving average of
the MACD , we can see the changing of expectations (i.e., the shifting of the
supply/demand lines) as they occur.
WARNING:
- For purpose educate only
- This script to change bars colors.
