Auto Fibonacci [Misu]█ This indicator shows an automatic Fibonacci retracement levels.
This indicator is designed based on highs, lows, and trend interpretation to orientate the fibonacci retracement in the good direction.
Fibonacci analysis uses a logical sequence of numbers to predict trends and price action.
█ Usages:
The Fibonacci retracement is used to identify hidden support and resistance levels that an investor can use for entry, exit, and stop placement.
Depending on your usage, you can track breakouts above and below retracement levels to provide early entry points for major breakouts and breakdowns.
█ Features:
> Choose Fib levels
> Color Fib Levels all in one
> Color Fib Levels Individually
█ Parameters:
Deviation: A parameter used to calculate pivots.
Depth: A parameter used to calculate pivots.
UI Settings: Select Fibs levels and colors.
Levels

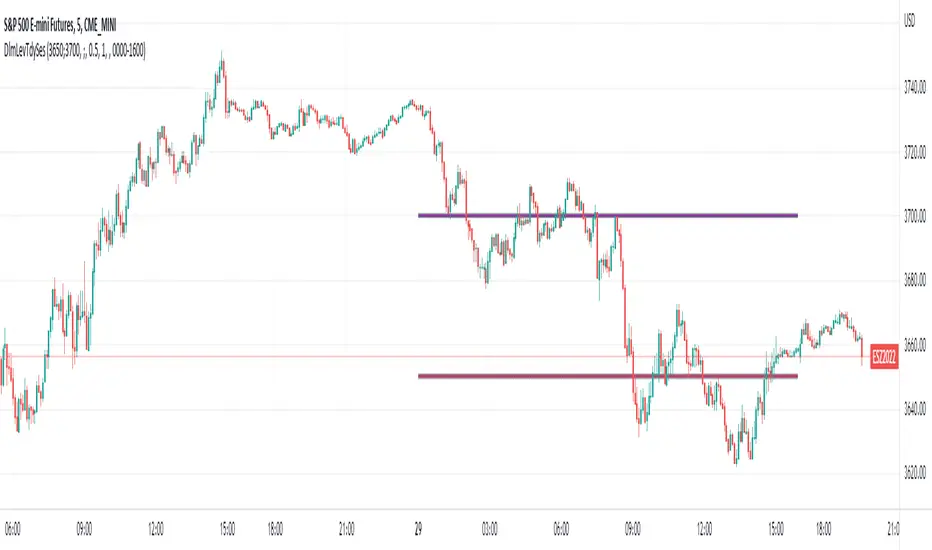
Delimited Levels Today Session - Colors as InputsThis script is an alternative to
It was developed to address user feedback / enhancement requests.
The difference is that the 12 color settings are separate input variables, and therefore will retain their values across level input value changes, and support 'default' template saving.
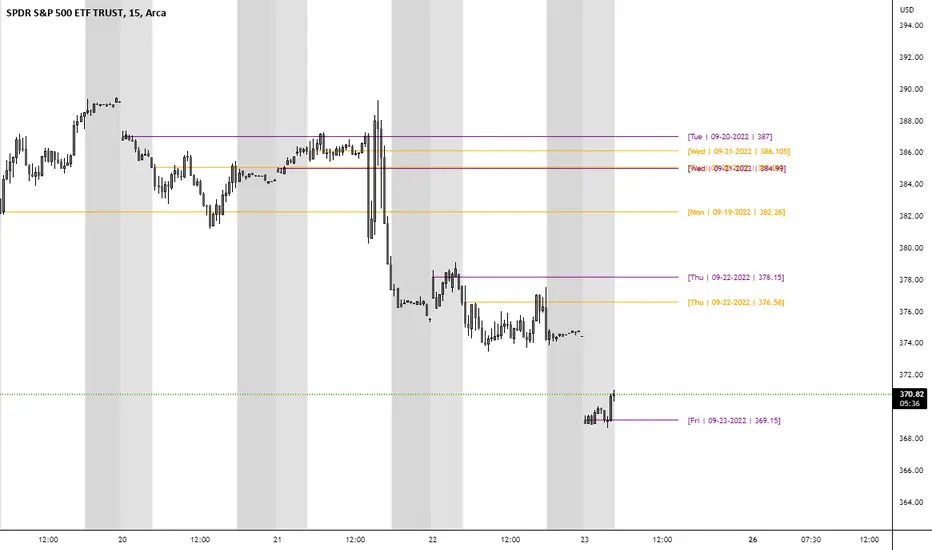
[FrizLabz]PB OLvlsDisplay Market Open and/or Premarket Open
Labels are offset to the right of Lines
You can adjust the number of opens back to display
If you want to change the format of the label please read the tool tip
Hope you enjoy
FrizLabz
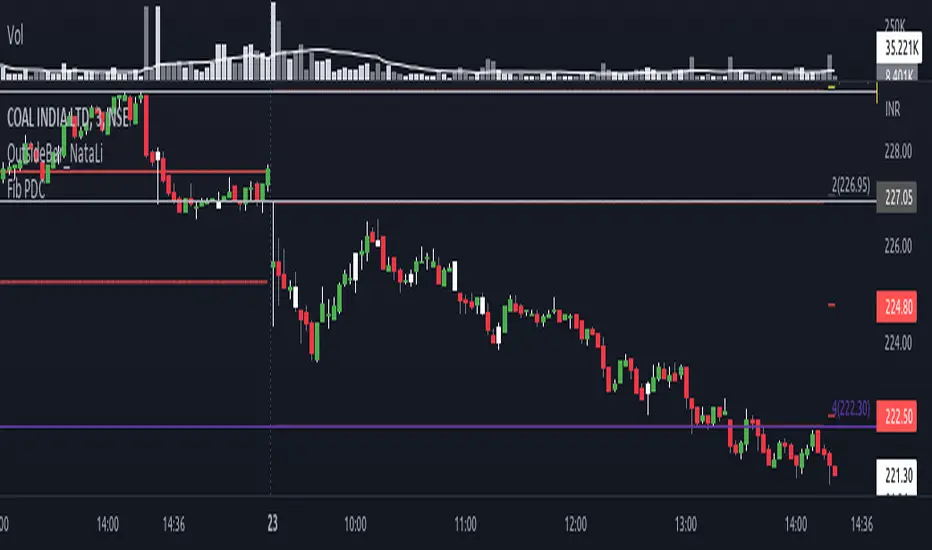
Fib Percentage Previous Day CloseIntraday regulated markets move within their circuit range above or below which the market activity is halted.
These levels are protected by the MM to accumulate or distribute. These levels are mostly same for all markets i.e. 2%, 4% , 5%, 10% and 20% of previous day close, crossing which the market activity halts.
So, from here the expectation of turning or breaking increases.
This indicator automatically plots the levels and helps understanding the price behavior at these points. This in turn helps taking better RR trades.
Automated OHLC OLHC LevelsA simple, clean, effective visualization tool, for the OHLC or OLHC of a chosen candle/timeframe.
Apply this indicator using a higher timeframe, in conjunction with other levels and the directional bias, to easily recognize trading opportunities at lower timeframes.

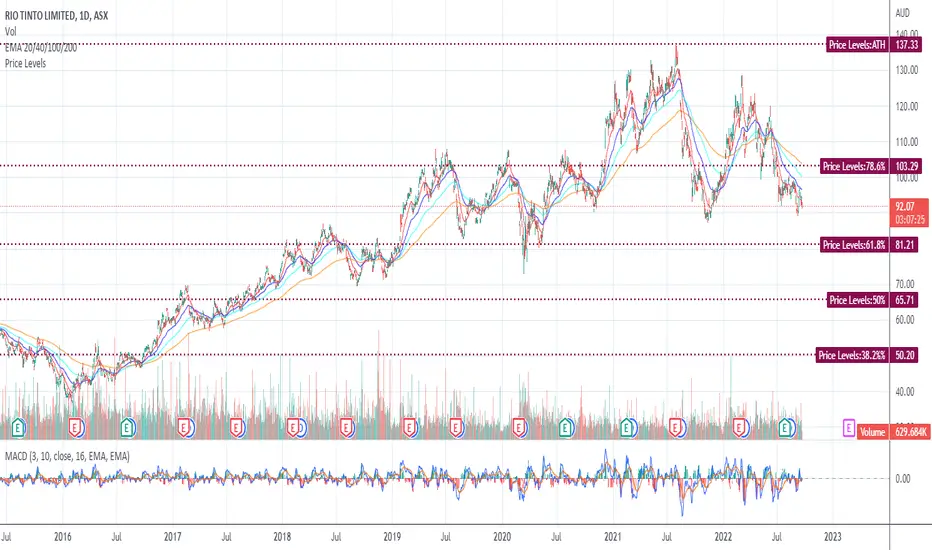
Price LevelsAuto plots significant Gann and Fib price levels using the all time range. Useful to quickly identify significant levels of support and resistance.
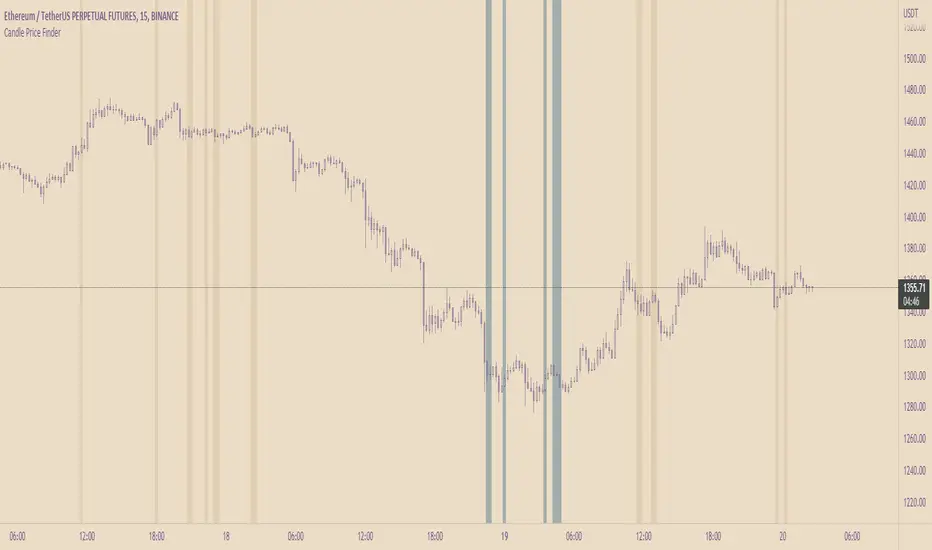
Candle Price FinderCandle Price Finder
A simple script that finds a candle (or candles) with user defined price levels. Search prices of a candle's high, low, open, close (or any element of the candle).
How To Use:
You can search prices with whole numbers and/or decimals. The search is tail end so if you are looking for a whole number that ends with 00 you type in 00 in search.
Indicator can be used to detect levels of interest, locked in range/points of consolidation. Originally coded to be used with anchored vwap.
Alerts included
In action:
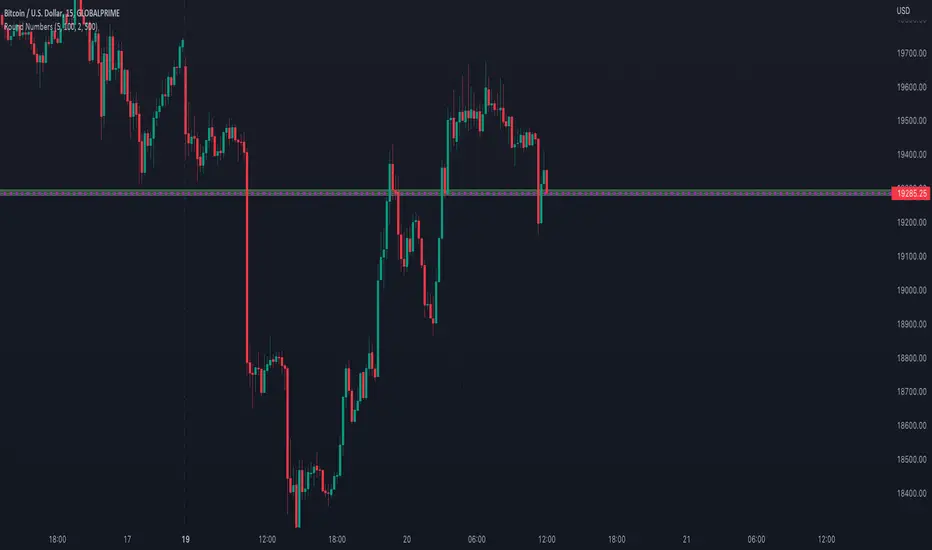
Psychological levels (Bank levels) PsychoLevels v2 - TartigradiaPsychological levels (Bank levels) plots "round" price levels above and below current price, by truncating after the nth leftmost digits, based on neuroscience research of how humans intuitively calculate in logarithms.
Psychological levels, also called bank levels, are "round" price numbers around which price often experience resistance or support, because traders and investors tend to set orders around these round numbers.
Calculation here is fully automatic and dynamic, contrary to other similar scripts, this one uses a mathematical calculation that extracts the 1, 2 or 3 leftmost digits and calculate the previous and next level by incrementing/decrementing these digits. This means it works for any symbol under any price range.
This approach is based on neuroscience research, which found that human brains intuitively approximate numbers on a logarithmic scale, adults and children alike, and similarly to macaques, for more info see Numerical Cognition , Weber-Fechner Law , Zipf law.
For example, if price is at 0.0421, the next major price level is 0.05 and medium one is 0.043. For another asset currently priced at 19354, the next and previous major price levels are 20000 and 10000 respectively, and the next/previous medium levels are 20000 and 19000, and the next/previous weak levels are 19400 and 19300.
Usage:
* By default, strong upper level is in green, strong lower level is in red, medium upper level is in blue, medium lower level is in yellow, and weak levels aren't displayed but can be. Half levels are also displayed, in a darker color. Strong levels are increments of the first leftmost digit (eg, 10000 to 20000), medium levels are increments of the second leftmost digit (eg, 19000 to 20000), and weak levels of the third leftmost digit (eg, 19100 to 19200). Instead of plotting all the psychological levels all at once as a grid, which makes the chart unintelligible, here the levels adapt dynamically around the current price, so that they show the upper/lower levels relatively to the current price.
* A simple moving average is implemented, so that "half-levels" are also displayed when relevant (eg, medium level can also display 19500 instead of only 19000 or 20000). This can be disabled by setting smoothing to 1.
* By default, the script runs on the daily timeframe, whatever the current chart's timeframe is. This is to reduce the variability in levels, to make it less noisy than intraday price movement, but this can be changed in the settings.
* The step can be adjusted to increase the gap between levels, eg, if you want to display one every 2 levels then input step = 2 (eg, 22000, 24000, 26000, etc), or if you want to display quarter levels, input 0.25 (eg, 22000, 22250, 22500, etc). The default values should fit most use cases and cover most psychological levels.
I made this script mainly to train with PineScript, but I found it surprisingly accurate to define levels that are respected by price movements. So I guess it can be useful for new traders and experienced traders alike, as it's easy to forget that psychological levels can often be as strong if not stronger than technical levels. It can also be used to quickly screen other minor assets for trading opportunities. For example, a hybrid strategy would be to manually define levels on BTCUSD but using this script to automatically define levels in crypto altcoins and quickly screen them for a trade opportunity that can be greater than with BTCUSD but with the same trend.
Changes compared to v1:
* Deduplicated redundant calculations and hence faster script.
* Added half-step levels, which allows to more easily see breakouts (because the levels are still on-screen).
* All steps are now configuration on the GUI.
* Revamped color scheme.
* And major reasons to post as a separate v2 script rather than updating: because we can't update the original description nor screenshot. I have now read more about the House Rules and saw other scriptmakers, so I am trying to write better descriptions like wizards do, by explaining not only how the script works but what the underlying financial concept is to a neophyte audience.

Round NumbersThis is a variation of "Round numbers above and below" indicator by BitcoinJesus-Not-Roger-Ver. I've made it two sets of lines and round number range changeable. Defaults at 100 and 500 round numbers.
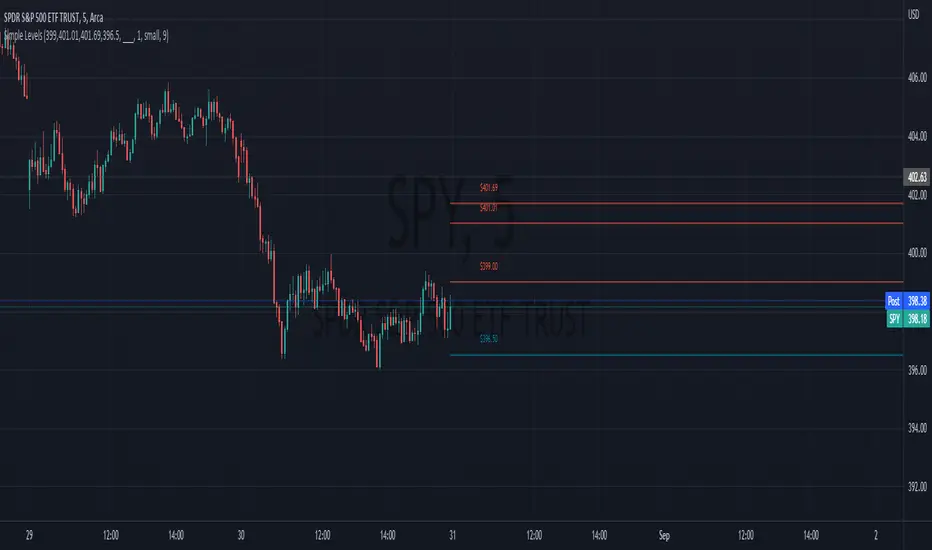
Simple LevelsSimple Level provides a (you guessed it) simple user to user level sharing experience, with less boxes, less formatting, and less hassle.
Simply insert your levels into the input box, separated by commas. That's it.
Example: 1,2,3,4,5
The Simple Levels indicator will automatically color your lines based on their position to the current close price.
If the level is crossed, the level line will change color.
This indicator is intended for those who just want to skip filling out boxes or typing in a tricky format, and cut to the chase.
There are additional, nice-to-have settings as well for the "more" technically inclined; however, nothing too complicated.
Enjoy!
All-In-One Sessions, Weekly, Monday, Previous Highs/LowsWe are forever drawing key levels on our charts with saved drawing templates, but finding the levels, adding the labels, is all tedious stuff. We have indicators, but we have multiple different ones at a time.
What if you could just tick a box on/off?
Well now you can.
This all in one 'levels' indicator is designed to show all the key highs and lows from previous weeks, Monday, the current week, as well as an option to highlight the market sessions and their highs and lows.
There are lots of options available for extending lines and choosing their colors, so once you have set it up how you want, don't forget to save YOUR defaults.
Oorah.

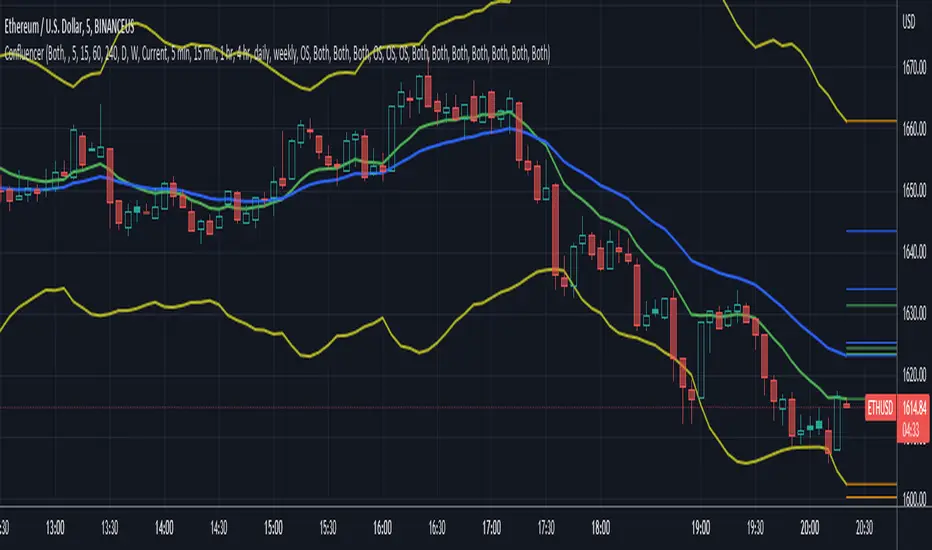
RSI + GDAX EMA ConfluencerHighly customizable RSI + GDAX EMA tool to help you quickly spot levels of confluence
- Displays current RSI levels as a plot
- Displays current 12 + 26 EMA as a plot
- 7 customizable time frames
- Each time frame marks RSI oversold, RSI overbought, 12 EMA, and 26 EMA as a line with label
- Each time frame RSI and EMA have options to toggle visibility and oversold/overbought only so you can choose exactly what you want to see
Planned for future release:
- Further customization for lines (color, size, direction, etc)
- Further customization for labels (location, offset, color, size, etc)
- Highlighting areas of confluence (if 2-3+ lines are within a certain % of each other)
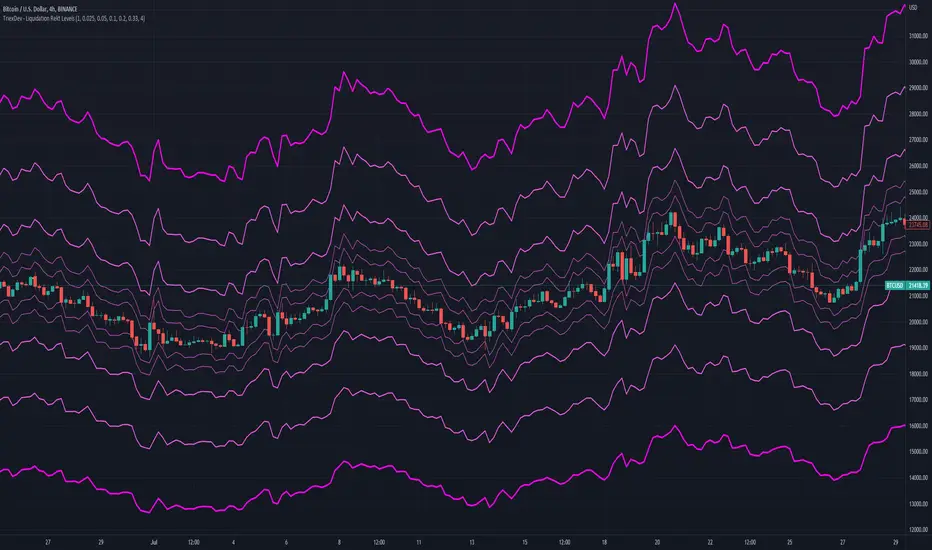
TriexDev - Liquidation Rekt LevelsTriexDev - Liquidation Rekt Levels TradingView Indicator
A basic indicator which lets you see where positions will be liquidated. Each line is based on default leverage levels typically used for trading. (3x,5x,10x,25x,50x)
Have a subtle 'label prompt' on the 3x - because I had noticed some people didn't understand what labels were in other indicators.
In the settings:
- There is an offset to adjust the levels horizontally, this is to help make it easier to track if the chart has hit liquidation positions.
- You can change colours/opacity of the lines.
- You can hide the 'Labels', and/or 'label prompt'
- In the 'Style' tab you can hide individual levels.
Inspired/initially based off 'Mex Rekt Level'
I often have this added to my charts, and toggle visibility when I want to check the liq levels.
GitHub Repo for tidier/more detailed documentation as it is updated.
Background ZonesThis script provides up to 5 zones to apply background colors. This is especially useful for applying to indices such as USI:TICK , USI:ADD , and USI:VOLD , where certain levels provides significant meaning to market sentiment and directions. This script will give you the visual cue to help with your trading.
All levels and colors are fully customizable.
Enjoy~!!
Example:

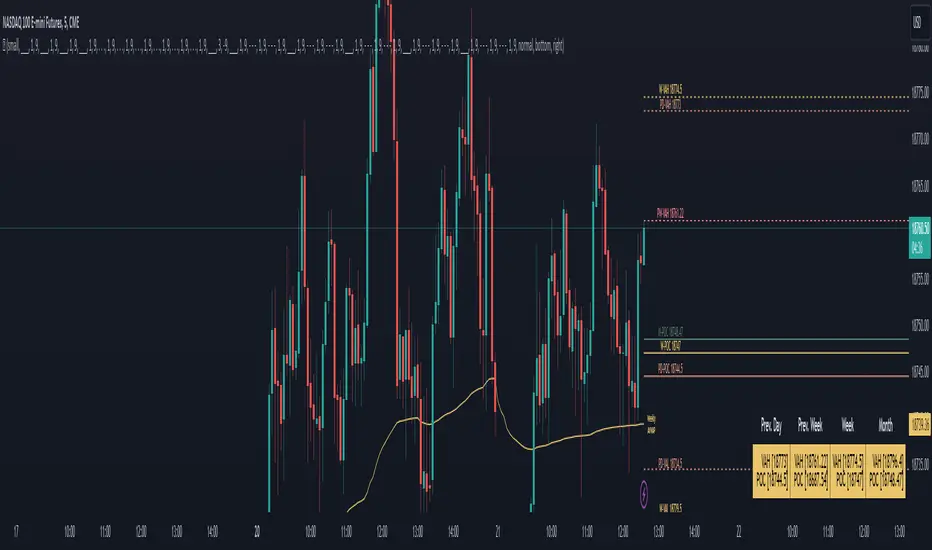
LevelsThe Levels indicator automatically draws important market pivots based on multiple timeframe value zones and pivotal trading areas. This information is displayed in front of the price, to keep things out of the way of your price action chart. All of these levels are fully customizable, for visual tranquility, and all values are available to set alerts on. Last but not least is an easy-to-read dialogue box so you know exactly where you are in the auction at a quick glance to save you time while analyzing charts.
Levels included:
Value Low (Day, Week, Month)
Value High (Day, Week, Month)
Point of Control (Day, Week, Month)
VPOCs (Daily)
Highs and Lows (Week, Month)
Average range zones( Day, Week, Month)
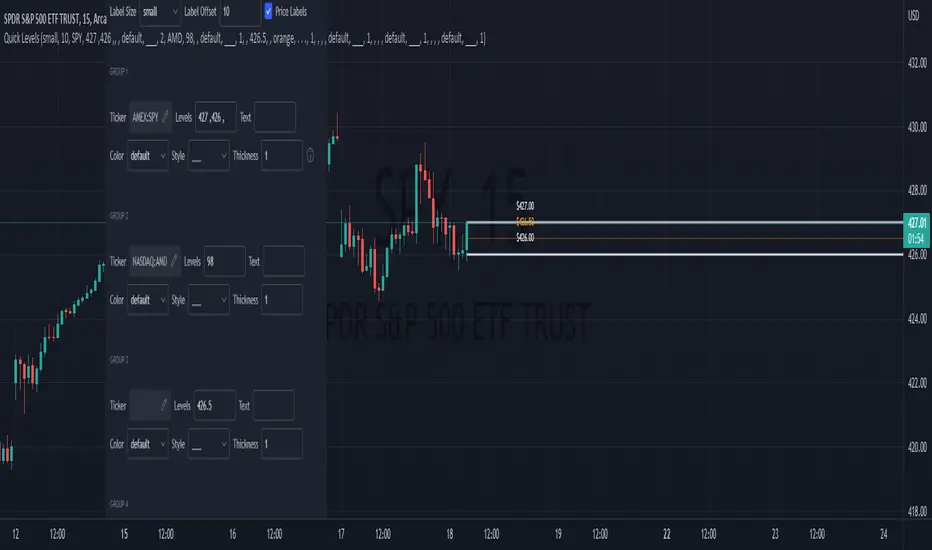
Quick LevelsQuick Levels allow users to quickly add multiple levels to their chart all at once through an intuitive user interface!
No need to fiddle with drawing lines and then inputting their exact position afterwards, do all of it with one string of numbers!
Insert multiple levels at once, simply separate your price levels by commas(,).
Insert levels across tickers to save time when switching between charts.
Notes:
For users coming from "Copy/Paste Levels", this system is very robust.
The only user input variable that is not multiple choice is the "levels" box. I have taken steps to fool proof this box, by (input processing) removing spaces, removing commas at the start or end, and replacing semicolons with commas. You can see in the cover chart that the inputs for the first level have a lot of spaces and a comma at the end, yet it does not effect the output.
If there is no ticker entered in the "Ticker" box, the levels will be drawn on your current chart.
Enjoy!
Market GloryV1 -Introducing the new Market Glory indicator! In this indicator you will find:
- Dynamic Trends: a beta feature that takes into account both the maximum high and lowest low values anywhere between 5 to 200 bars back to determine the respective resistance and support levels at all times, with a trailing guidance middle bar that can serve as a meter for direction and takes into account only the close values of the defined 5-200 lookback bars! ( ***Strictly based on the 1 minute timeframe. )
- Engulfing bars: a beta feature that allows you to seek out potential reversal bars, based on the dema tema clouds and the respective bar's open and close!!
- Cycle bars: a Market Sniper classic feature, enabling you to catch momentum, consolidation, and continuation via hollow candles! This is achieved by detecting whether the open and close values stem from within the dema tema cloud's boundaries!
- Levels: also a Market Sniper classic, which lets you see support and resistance levels based on previous daily, weekly, and monthly opening and closing values! Also takes into account current closing price action, which will update the levels after being broken!! Furthermore, takes into account fibonacci steps (0.236, 0.382, and 0.5) per timeframe to determine where the nearest level will draw out. **The Calibration feature enables you to look ahead for potential upcoming resistances, with maximum precision.
- EMA crossings: A legacy feature in almost any popular indicator, as a means to correspond with the dema tema cycles for better entries and exits!!
- Multi-timeframe popup labels: By hovering (or long pressing in mobile) over the support and resistance level labels, you can see each dedicated timeframe's current cycle and crossing, to assess whether the stock is following a particular direction! (based solely on real-time close value)
- Lastly...
--- Fully customizable options in coloring and values, including ready-to-go defaults with tooltips to guide you to the Glory you deserve!!!

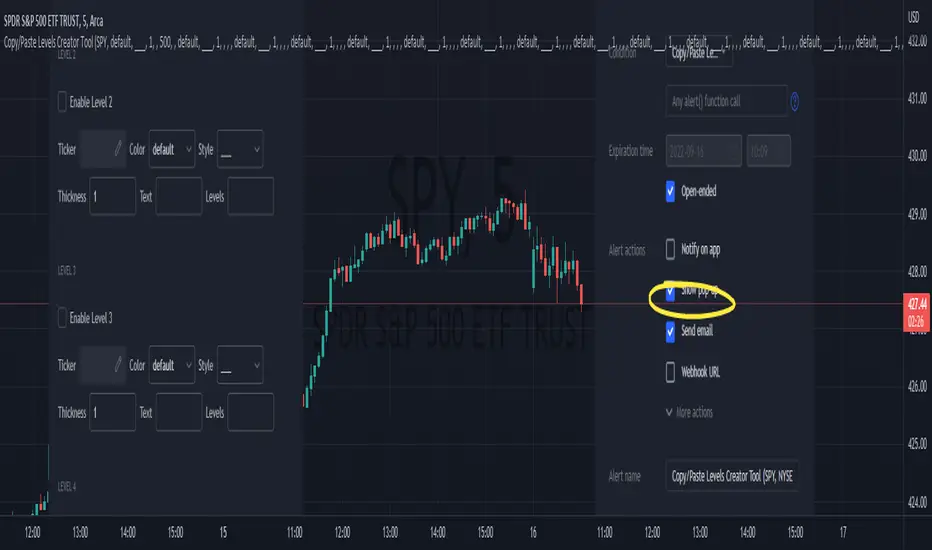
Copy/Paste Levels Creator ToolThis indicator is for making levels to enter into the Copy/Paste Levels Indicator, This description will serve as a guide on how to use this tool to export levels for sharing!
Copy/Paste Levels Indicator:
Once you add this indicator to your chart it will pop up with a confirmation box for quick access to adding levels, You can see a snapshot of the settings UI on the left in the chart in this post.
If you want to just add the indicator to your chart press "apply" and you will be able to add levels by going into the settings for the indicator. Otherwise, Just fill out the settings and only check on the boxes you need (minimum 1).
All values are default, and the only boxes that need to be filled out are the Ticker and Lvls.
In the lvls box, insert your levels separated by commas(,) it is preferred that you do not have any spaces in the lvls box, however in the code, I have a piece to remove spaces from this box.
Now The Important Part!
As you may notice, this indicator does not display anything. Its main function is to export formatted text to be entered into the Copy/Paste Levels Indicator.
The way we do this is through email alerts .
After inputting levels to Export, Go to a live chart and set an alert for this indicator, check the box for "Email Alerts".
This will send the alert message to your email when it fires.
After the alert fires,
Check your email, you will have a message containing the formatted levels, ready to be copy and pasted into the other indicator!
How does the alert fire?
I have the alert function set to fire on every calculation of the indicator because of this,
This indicator will alert immediately , on any LIVE chart.
Note: After the alert fires, it is probably a good idea to immediately delete the alert, or else you will get an alert on ever candle with the same information you have already exported.
What if its after market and the chart is not ticking?
When making levels on off hours, remember to set the alert (for this indicator) on a live chart such as BTC.
Remember: The chart you are on does not have to be the one you are making levels for. This indicator is simple an interface.
Enjoy!
Copy/Paste LevelsCopy/Paste Levels allows levels to be pasted onto your chart from a properly formatted source.
This tool streamlines the process of adding lines to your chart, and sharing lines from your chart.
More than one ticker at a time!
This indicator will only draw lines on charts it has values for!
This means you can input levels for every ticker you need all at once, one time, and only be displayed the levels for the current chart you are looking at. When you switch tickers, the levels for that ticker will display. (Assuming you have levels entered for that ticker)
The formatting is as follows:
Ticker,Color,Style,Width,Lvl1,Lvl2,Lvl3;
Ticker - Any ticker on Tradingview can be used in the field
Color - Available colors are: Red,Orange,Yellow,Green,Blue,Purple,White,Black,Gray
Style - Available styles are: Solid,Dashed,Dotted
Width - This can be any negative integer, ex.(-1,-2,-3,-4,-5)
Lvls - These can be any positive number (decimals allowed)
Semi-Colons separate sections, each section contains enough information to create at least 1 line.
Each additional level added within the same section will have the same styling parameters as the other levels in the section.
Example:
2 solid lines colored red with a thickness of 2 on QQQ, 1 at $300 and 1 at $400.
QQQ,RED,SOLID,-2,300,400;
IMPORTANT MUST READ!!!
Remember to not include any spaces between commas and the entries in each field!
ex. ; QQQ, red, dotted, -1, 325; <- Wrong
ex. ;QQQ,red,dotted,-1,325;)<- Right
However,
All fields must be filled out, to use default values in the fields, insert a space between the commas.
ex. ;QQQ,red,dotted,,325; <- Wrong
ex. ;QQQ,red,dotted, ,325; <- Right
While spaces can not be included line breaks can!
I recommend for easier typing and viewing to include a line break for each new line (if changing styling or ticker)
Example:
2 solid lines, one red at $300, one green at $400, both default width. Written in a single line AND using multiple lines, both give the same output.
QQQ,red,solid, ,300;QQQ,green,solid, ,400;
or
QQQ,red,solid, ,300;
QQQ,green,solid, ,400;
In this following screenshot you can see more examples of different formatting variations.
The textbox contains exactly what is pasted into the settings input box.
As you can see, capitalization does not matter.
Default Values:
Color = optimal contrast color, If this field is filled in with a space it will display the optimal contrast color of the users background.
Style = solid
Width = -1
More Examples:
Multi-Ticker: drawing 3 lines at $300, all default values, on 3 different tickers
SPY, , , ,300;QQQ, , , ,300;AAPL, , , ,300
or
SPY, , , ,300;
QQQ, , , ,300;
AAPL, , , ,300
Multiple levels: There is no limit* to the number of levels that can be included within 1 section.
* only TV default line limit per indicator (500)
This will be 4 lines all with the same styling at different values on 2 separate tickers.
SPY,BLUE,SOLID,-2,100,200,300,400;QQQ,BLUE,SOLID,-2,100,200,300,400
or
SPY,BLUE,SOLID,-2,100,200,300,400;
QQQ,BLUE,SOLID,-2,100,200,300,400
Semi-colons must separate sections, but are not required at the beginning or end, it makes no difference if they are or are not added.
SPY,BLUE,SOLID,-2,100,200,300,400;
QQQ,BLUE,SOLID,-2,100,200,300,400
==
SPY,BLUE,SOLID,-2,100,200,300,400;
QQQ,BLUE,SOLID,-2,100,200,300,400;
==
;SPY,BLUE,SOLID,-2,100,200,300,400;
QQQ,BLUE,SOLID,-2,100,200,300,400;
All the above output the same results.
Hope this is helpful for people,
Enjoy!

ZigZag with Retracement LevelsThis is a modification to "ZigZag with Fibonacci Levels" by LonesomeTheBlue.
By default, the script finds the ZigZag, draws Fibonacci lines and labels accordinly. ZigZag period can be set.
The modification to the original script provides the following features:
1) Option for user to customize retracement levels, if they don't want to use Fibonacci levels. This allows for different strategy adoptions.
2) Option to show Fibonacci or custom retracement levels based on the latest pivot (including the current bar)
For example:
Enjoy and happy trading~!!

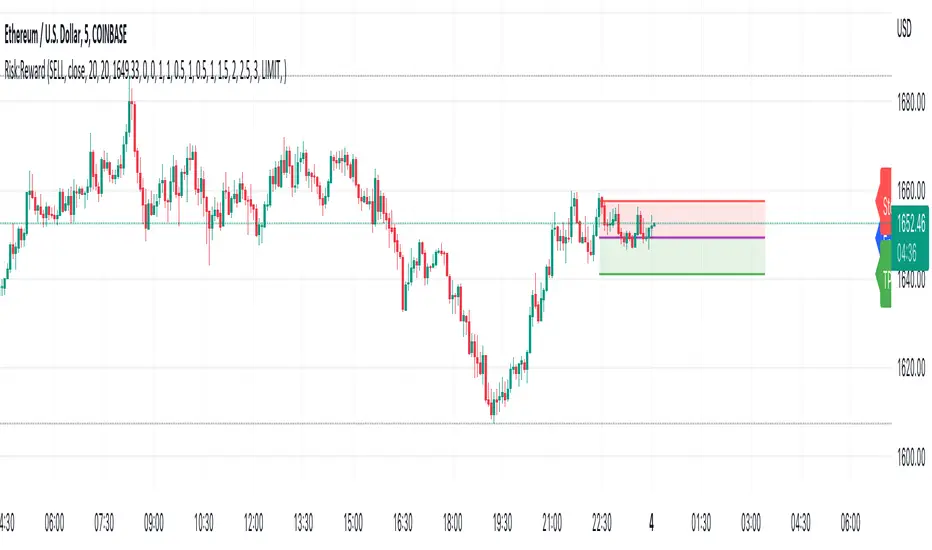
Risk:RewardThis Indicator displays Entry and Exits levels. The display is done under 3 modes:
- Risk/Reward mode (the one by default. It is set to a 1:1 ratio)
- Multiples TP Levels
- Custom Levels
Click to Set entry Price on chart
The displaying is static by default
to make it dynamic disable the "Use custom Entry ?" input.
Disclaimer: Scripts that I post publicly are experimental. They are not financial advices. Always backtest your ideas using your own methodologies.
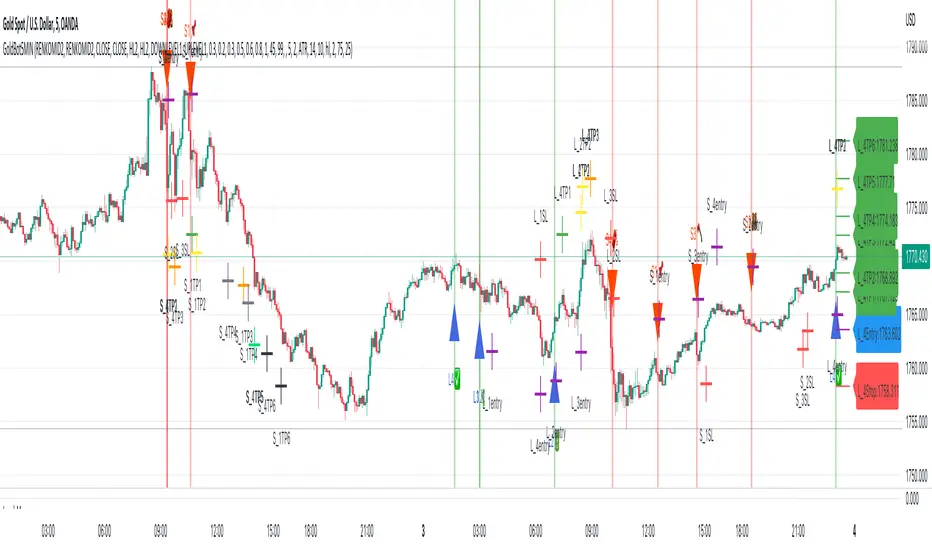
LevelsManagerLibrary "LevelsManager"
TODO: Track up to 6 TakeProfits and 1 StopLoss achievement for one or many of your buy/sell conditions.
manageTrade(bool, bool, bool, string, string, float, float, bool, bool, bool, bool, bool, bool, float, float, float, float, float, float, float)
Track TakeProfits and StopLoss achievement for one or many of your buy/sell conditions. CHECK the commented section: "Function @manageTrade" for Description
Parameters:
bool : useSignal.
bool : b_gameOVer.
bool : b_gameOVer.
string : bName.
string : sName.
float : buyEntrySource.
float : sellEntrySource.
bool : useTp1.
bool : useTp2.
bool : useTp3.
bool : useTp4.
bool : useTp5.
bool : useTp6.
float : tp1x.
float : tp2x.
float : tp3x.
float : tp4x.
float : tp5x.
float : tp6x.
float : slx.
Returns: check commented section: "Function @manageTrade".
showOnlyFirstOccurence(booleanInput)
Single out the occurence of a bool series between to 2 bool series.
Parameters:
booleanInput : to activate or deactivate occurences filtering.
Returns: filterred or not bool series.
Volume Analysis*Sourced code from Volume Flow v3 by oh92 for Bull\Bear volume flow calculations. Thank you so much for your engineering skills!
This indicator integrates the Ma-over-MA crossover strategy in oh92's V3 DepthHouse calculation with a volume-over-MA
calculation to further narrow down "Areas of Interest" levels for a potential re-test zone to the right of the chart.
I added a Moving Average calculation for a multi-level cloud and further broke down more conditions to highlight both
volume flow crossover on the High and Extreme High MA's and also high and extreme high volume spikes on set period average
without bull\bear conditions. Original Bull/Bear Spikes are still viewable although that was the only plot from oh92's script
that was integrated.
Session backgrounds set for research purposes.
Please note: Setting MA Cloud to "None" will remove all plots calculated with the MA Cloud from the chart entirely. Turn off visuals
in the Style tab.
