[MF] Auto Fibonacci LevelsDescription:
Automatically draw Fibonacci Pivot levels based on the previous (day's, week's or month's)
Range ( High-Low ). The HLC3 is used as the default Pivot level.
Unlike the "Auto Fibonacci Levels", this variation does not update
Levels on current day even if the price goes past the R3/S3 levels.
Timeframes: 1D, 1W, 1M
Range = (High - Low) - From previous Day, Week or month.
FIB LEVELS:
- Yellow = Pivot and Pivot Zone (HLC3 by default)
- red = R1,S1 Levels 0.236 * Range
- Green = R2,S2 Levels 0.368 * Range
- Lime = R3,S3 Levels 0.618 * Range
- Blue = R4,S4 Levels 0.786 * Range
- Gray = R5,S5 Levels 1.000 * Range
- Lime = R6,S6 Levels 1.236 * Range
- Red = R7,S7 Levels 1.382 * Range
- Blue = R8,S8 Levels 1.618 * Range
- Green = R9,S9 Levels 2.000 * Range
CLASSIC LEVELS:
- Yellow = Pivot and Pivot Zone (HLC3)
- Green = R1,S1 Levels (Pivot*2 - Low), (Pivot*2 - High)
- Lime = R2,S2 Levels ( Pivot + Range), ( Pivot - Range)
- Lime = R3,S3 Levels (High + 2*( Pivot - Low)), (Low - 2*(High - Pivot ))
- Blue = R4,S4 Levels (High + 3*( Pivot - Low)), (Low - 3*(High - Pivot ))
Refrences:
- Auto Daily Fib Levels R3.0 by JustUncleL
- Auto Fib by TheYangGuizi
- Monthly Dynamic Range Levels (Fibonaci) V0 by RicardoSantos
Modifications:
- Added next FIB Levels. (changes during the current cycle)
- Added FIB 0.236 Levels
- Added Option to change the colors of the Fib Levels
- Changed Default colors to the colors of Tradingview
- Upgraded to Version4 Pinescript
Levels

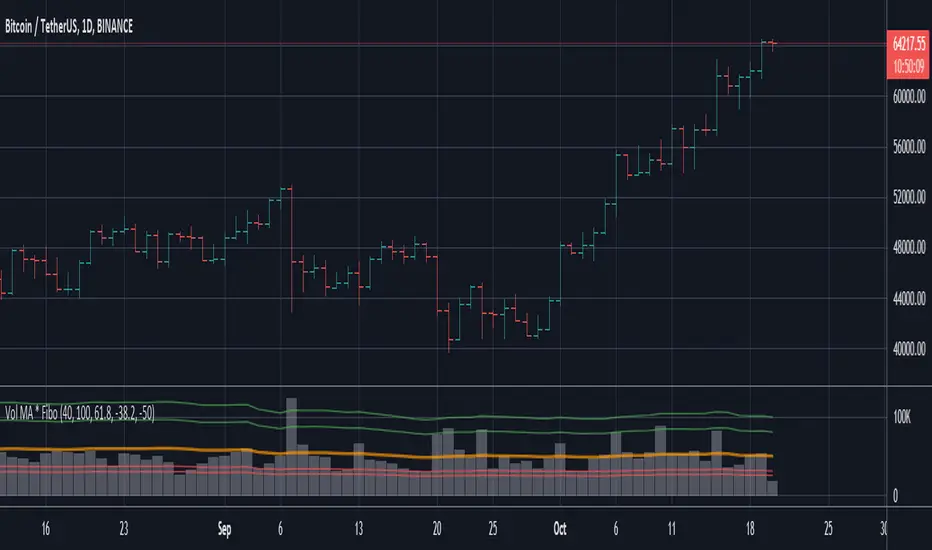
Volume MA * Fibo levelsIn the scrypt above, the SMA of Volume is taken as a basis and the Fibonacci levels are calculated.
This can be useful for analyzing the trend in accordance with changes in volume.
Any feedback is appreciated!
Good luck with your trading!
Market Sessions Open/Close LevelsThis indicator displays the market open and close price levels for the main trading sessions (Sydney, Tokyo, Frankfurt, London and New York). The Daily Line changes color depending on if price is trading above or below the level. Feel free to add or replace levels depending on your trading style and trading times.
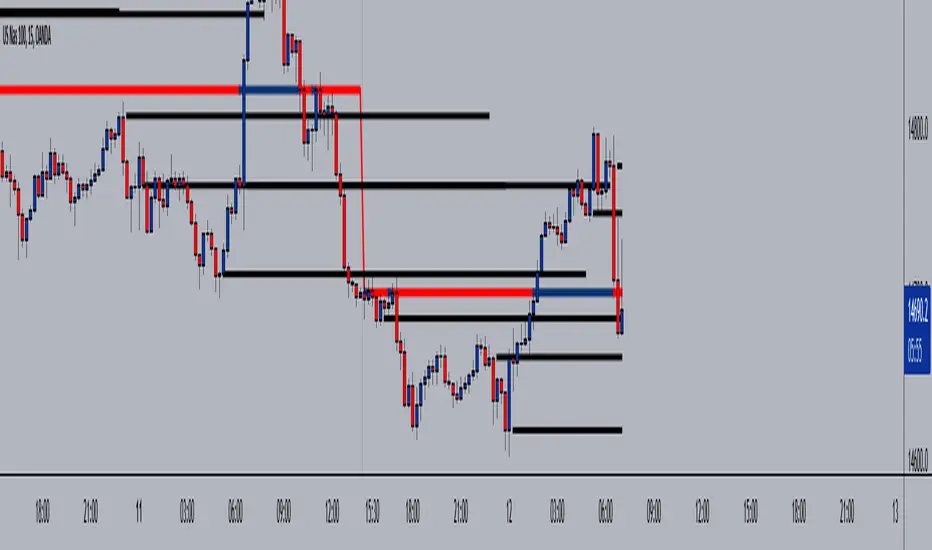
Levels High LowEnglish:
Indicator for quickly identifying support and resistance levels. It is possible to use the parameter of the length of the upper and lower levels. The larger it is, the stronger the levels of the levels. The smaller it is, the less strong the levels are. It is possible to go back and turn off labels and lines. By default, the labels and lines are scale, and the length is 20.
Русский:
Индикатор предназначен для быстрого определения уровней поддержки и сопротивления. Есть возможность изменять параметр длинны верхних уровней и нижних. Чем он больше, тем более сильные уровни отображаются. Чем он меньше, тем менее сильные уровни отображаются. Есть возможность включать и отключать метки и линии. По умолчанию метки и линии отображаются, а длинна равна 20.

High Low Open Mid Ranges & Levels (Multi-Timeframe)This indicator automatically plots the chosen timeframe's high, low, mid point and open. These levels on higher timeframes act as support and resistance levels on lower timeframes, helping find entries, stoploss and profit targets.
Most common timeframes to choose are Daily, 1W, 1M, and 3M. Other timeframes that are good include, 2D, 2W and 2M.
For example, you can see in the snapshot below, we are on the 4hr TF showing those levels from the 2W. This historical 2W zone (open and mid) was (and currently still is) resistance. You can see it also provided a good entry to go short.
This is also useful for intraday scalping. Below, we are on the 15min TF with levels set on the 2D timeframe. You can see how the Open and Mid levels acted as resistance, providing good entries on range trades, with take profit set at the previous 2D low.
There is also a table which tells you all the main TFs high, low, open, and mid levels. They are the most important ones to look out for.
This indicator should not be used in isolation; it is best to pair it up with other TA such as orderblocks, S/D zones, S&R or overlay indicators.

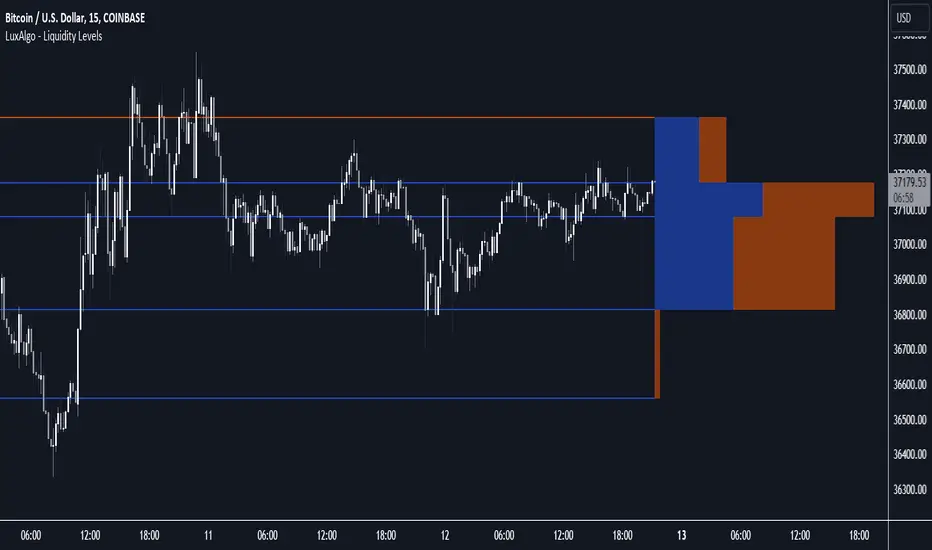
Liquidity Levels [LuxAlgo]The Peak Activity Levels indicator displays support and resistance levels from prices accompanied by significant volume. The indicator includes a histogram returning the frequency of closing prices falling between two parallel levels, each bin shows the number of bullish candles within the levels.
1. Settings
Length: Lookback for the detection of volume peaks.
Number Of Levels: Determines the number of levels to display.
Levels Color Mode: Determines how the levels should be colored. "Relative" will color the levels based on their location relative to the current price. "Random" will apply a random color to each level. "Fixed" will use a single color for each level.
Levels Style: Style of the displayed levels. Styles include solid, dashed, and dotted.
1.1 Histogram
Show Histogram: Determines whether to display the histogram or not.
Histogram Window: Lookback period of the histogram calculation.
Bins Colors: Control the color of the histogram bins.
2. Usage
The indicator can be used to display ready-to-use support and resistance. These are constructed from peaks in volume. When a peak occurs, we take the price where this peak occurred and use it as the value for our level.
If one of the levels was previously tested, we can hypothesize that the level might be used as support/resistance in the future. Additional analysis using volume can be done in order to confirm a potential bounce.
The histogram can return various information to the user. It can show if the price stayed within two levels for a long time and if the price within two levels was mostly made of bullish or bearish candles.
In the chart above, we can see that over the most recent 200 bars (determined by Histogram Window) 68 closing prices fall between levels A and B, with 27 bars being bullish.
Additionally, the width of a bin and its length can sometimes give information about the volatility of a specific price variation. If a bin is very wide but short (a low number of closing prices fallen within the levels) then we can conclude a most of the movement was done on a short amount of time.
Bank Levels - Psychological Levels - Bitcoin, Indices, ForexThis got removed so I'm publishing it again.
What it is:
- This script draws in levels refereed to as bank levels. They are basically psychological/even numbers(40000, 45000, 150, 1850..)
Why doesn't it work on some charts?
- Each pair has a different tick value. You will have to edit the code to make it work on certain pairs. It's pretty simple, take a look.

CFD Ticks LevelsSimple but very effective script that finds areas of support and resistance through ticks exchange. Only works with CFDs
(You must enter in the settings the value corresponding to the CFD, example: US500 = 500, DAX30 = 30, FRANCE40 = 40 etc ...)
As usual, if you have any suggestions or bug reports don't hesitate.
Cheers
Fibonacci Bands[xaurr]This script draws Fibonacci bands according to std deviation using moving avarage with 233 periods, its the well know fibonacci number for following trend.

Awesome ATRB1rd's Awesome ATR:
An objective method of determining an initial Take Profit and Stop Loss, based on true market volatility and not arbitrary price levels. This indicator gives the user a powerful range of input variation with myriad permutations of smoothing and look back lengths, to build an objective value from which to measure profit and stop levels. This indicator also has a build-in alert function to keep you up to date with latest price developments regarding the ATR levels.
This indicator also automatically calculates a recommended position size based on our position sizing methodology. Simply input your capital amount and desired risk level. This indicator will display your optimum position size in USD or in Coin.
Purpose:
To give clear objective stop losses and take profit levels based off price volatility rather than arbitrary price levels, percentage points, ticks, pips, etc.

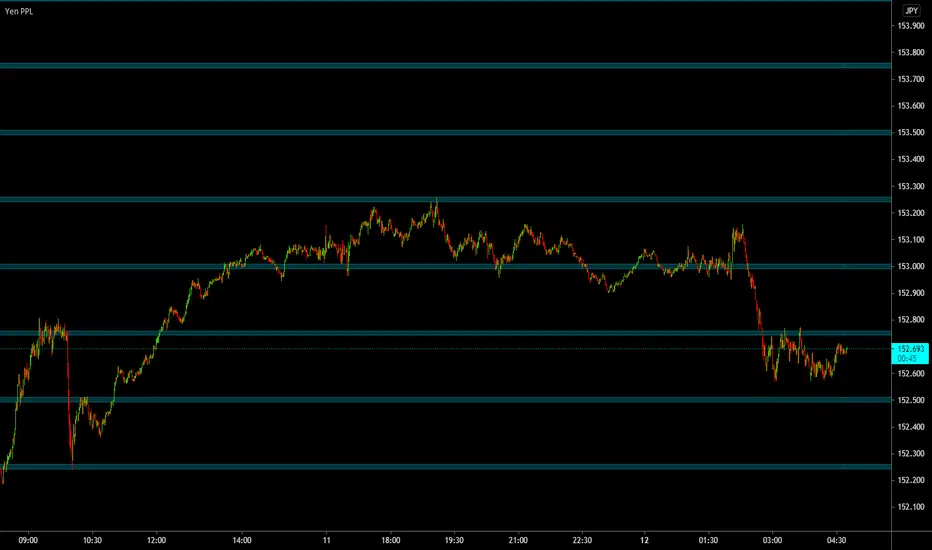
Yen PPLUse this Indicator to plot Psychological Price Levels on Yen Pairs, Set an alert to notify you when Price Action breaks a Psychological Price Level
This Indicator plots a 700 pip range.
When you first apply the Indicator a "Confirm Inputs" box will appear. Set the "Initial Value" box to a Flat .00 price about 350 pips below current Price Action.
This will set Current Price Action in about the middle of the range.
The PPL 1,2 and 3 "top" and "bot" settings represent the tops and bottoms of your Psychological Price Levels and allow you to adjust their location and width.
They are currently set to "Quarter Point Theory" and 2 pips wide.
You will probably want to leave PPL4 alone as it represents your Flat .00 numbers unless you want to adjust its width.
The Brightness and color can also be adjusted in "Bgcolor"
Set your alerts and enjoy.
Comments, Suggestions and Feedback are appreciated, Thanks for checking out the Indicator.
Stronger Classical Support/Resistance + Round LevelsI wrote some Support/Resistance scripts before this. In this new script, I implemented the logic of the code from the scratch, so it's very different from my previous S/R indicators and I think it's more advanced, accurate and efficient.
As the result it could do the followings for now:
- Draw more strong classical resistance/support levels by checking previous direction changes of the chart as far as Pine technically allows
- Colorize the levels based on the counted points of retracement/pullback (The darker the color is, the stronger the level is.)
- Show the number of reactions to each level
- Change the color of each level based on its main role as support, resistance or both
- Draw close round levels to current price for Forex pairs
I suggest all users of my previous S/R indicators to try this one.
Feel free to send me any issue or opinion!

Chart Champions CC Pocket 0.65 -0.666 Fib levels or commonly know as the CC pocket
Marks Strong Support/Ressitance, Use with conflunce.
Lookback Length is adjustable
Let me know any suggestions or ideas which could help improve

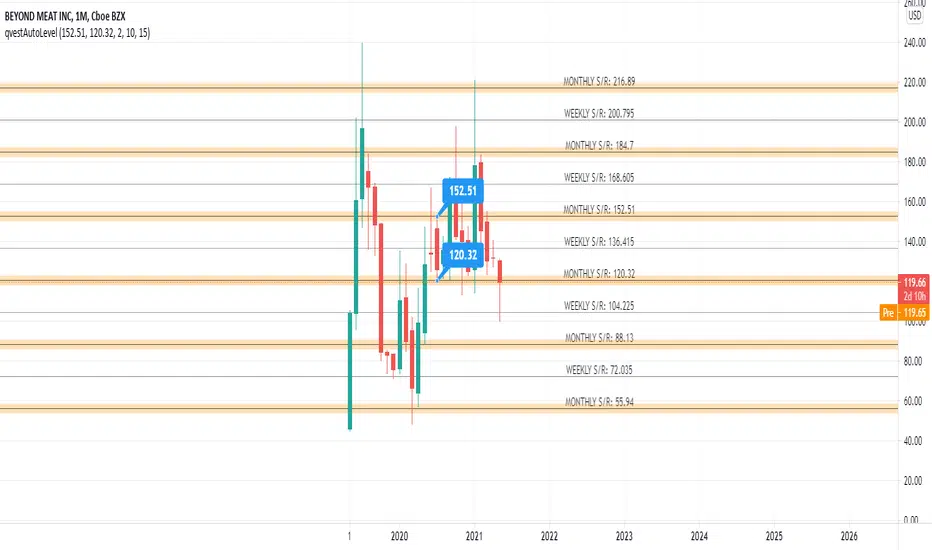
Quantumvest - Auto LevelsAuthor: Arthur Wayne
Description: This script automatically plots levels according to Primetime Trading Academy guidelines.
Directions:
On the monthly chart, you should select two significant monthly support/resistance levels and input them into the script. It is recommended to mark these levels with the price label tool.
The script will then automatically plot 2 monthly 'wings' or additional monthly support/resistance levels above and below the original monthly high and low that are the same distance apart. Located half way in between the monthly levels, there will be weekly support/resistance levels. None of the values will go below 0. These levels should then be used on lower time-frames for technical analysis.
There is the option to customize the number of monthly wings, the width of the box surrounds the monthly s/r levels, the x-position of the level labels, as well as the colors for everything.
The biggest drawback is that levels will not save in between charts. This is a limitation of Pine Script and how TradingView does not offer the ability to create custom drawing tools, only indicators and strategies. This is why it is recommended to use the price label tool to keep track in between charts for different assets. Regardless, this script should make the process of drawing levels manually far more efficient than it was before.
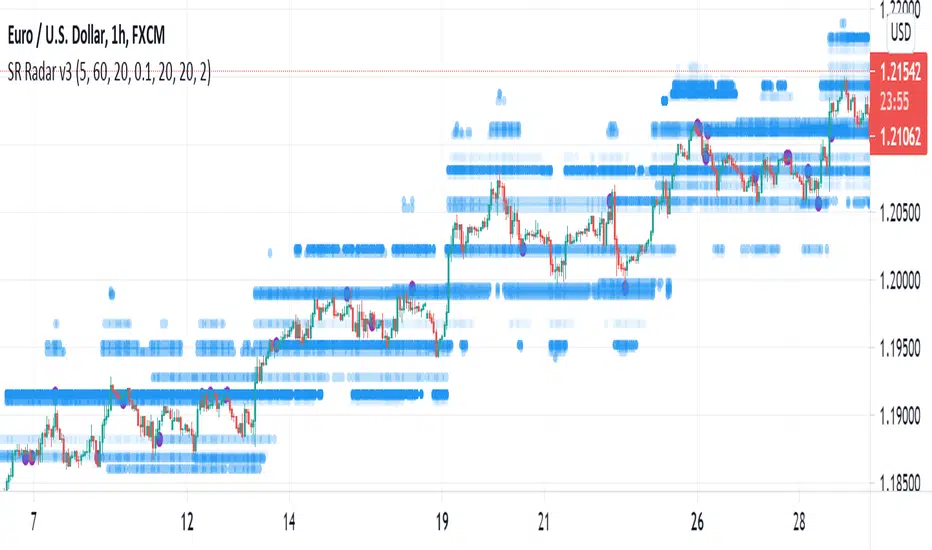
TestedFX SR RADAR v3 (Support & Resistance Radar)TestedFX SR Radar is unlike any other Support and Resistance indicator I have seen to date. It doesn't just show you recent important pivots. Everyone with eyes can see those levels lol. You need an edge on the market. You need to know the levels AHEAD OF TIME. Trading is about having MORE and BETTER information than everyone else. Notice how the levels start BEFORE price touches those levels!!
How does TestedFX SR Radar do this?? Glad you asked.
Just like real radar, it searches within 5 ATR of the current price for strong pivots thousands of bars previous major pivots. But that is just the start. Then when a level is respected with a wick rejection a upvote is cast. When the level is busted a downvote is cast. The shading levels are based on the levels POWER as scored by the market voting on it. (Notice the purple dots at then end of the wicks that hit the level) Using this novel technique high probability pivot points are calculated IN ADVANCE so you know the important levels ahead of time.
Darker levels and multiple lines grouped together show strong S/R levels.
You can use this in combination with your favorite strategy. However, it was built to go with one of our private indicators. Typically good practice on TV is to include all functionality in one indicator. We tried to do that with this indicator but we couldn't because it uses too much CPU power. As it is if you change the SR Radar settings you will get "Script takes too long to execute" type errors. If that happens try hiding and showing the indicator again. If that doesn't work then reset your settings back to standard settings. The upside is that we are releasing this free to our tradingview friends.
I love this community and it is great to be able to give back. I really hope this helps you make better trading decisions. If so please let me know your experiences (good and bad) in the comments.
Sincerly,
Doug Collins
TestedFX
Pullback LevelsPullback Levels is a technical indicator for predicting large price movements by calculating support and resistance levels. It is used to determine the general market trend on different timeframes. Pullback levels are used when prices are built above or below them, indicating the priority direction of movement.
Analysis of support and resistance levels often coincides with the action levels of large players, similar to the analysis of a trend line. When analyzing Pullback levels, the first support and resistance levels are calculated using the width of the trading range and the volume traded during this period. The second support and resistance levels are calculated using the larger trading range width given the highs and lows.
It also provides the ability to flexibly adjust the levels, their visualization, style, calculation methods and the used timeframe. For the convenience of backtesting, all historical levels are saved on the chart. To analyze current price movements and determine pullbacks, all prices are displayed next to the levels.
-------------------------------------------
Pullback levels – технический индикатор для прогнозирования крупных ценовых движений путем расчета уровней поддержки и сопротивления . Используется для определения общего рыночного тренда на различных таймфреймах. Pullback levels используются при построение цены выше или ниже них, указывая на приоритетное направление движения.
Анализ уровней поддержки и сопротивления часто совпадает с уровнями действия крупных игроков, наподобие анализа трендовой линии. При анализе Pullback уровней первые уровни поддержки и сопротивления рассчитываются с использованием ширины торгового диапазона и объёмом проторгованным за этот период. Вторые уровни поддержки и сопротивления рассчитываются с использованием более старшей ширины торгового диапазона учитывая максимумы и минимумы.
Он так же предоставляет возможность гибкой настройки уровней - их визуальной составляющей, стиля, методов расчёта и используемого таймфрейма. Для удобства бэктестинга все исторические уровни сохраняются на графике. Для анализа текущих ценовых движений и определении точек разворота, все цены находятся рядом с уровнями.

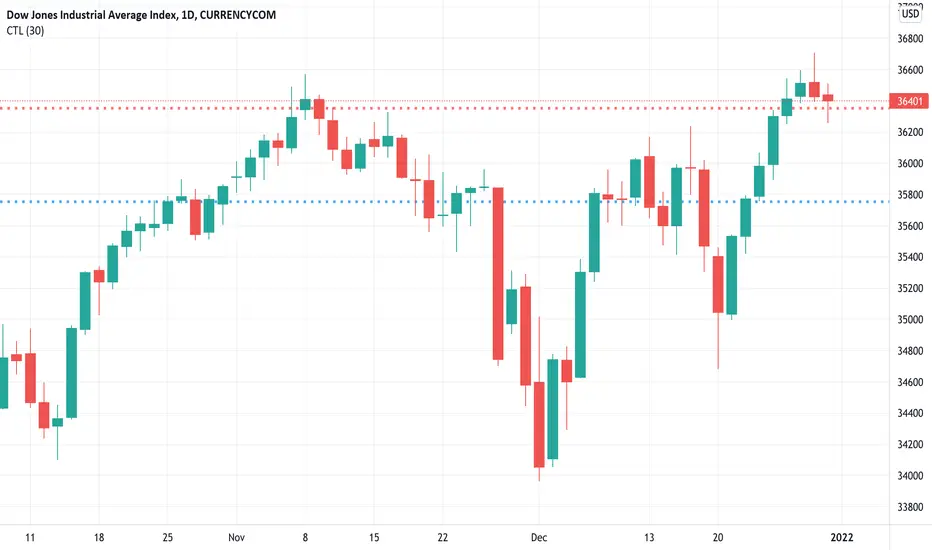
Critical Levels by Time FrameDescription
This indicator will help you present critical levels from a certain time frame.
Purpose and Usage
Many day traders are using the previous day high, close and low, as critical levels in their trading. in order to easily present those levels on your chart, I created this indicator in which you can define which of those you would like to present on your chart.
You may choose the best time frame for your needs, I suggest using the daily time frame which is also the default time frame, but you can use the weekly time frame to present the critical levels from the previous week, or you can choose any other time frame you would like.
Pre-market and after-market prices will not be taken into consideration.
Restrict to current DAY
There is an option to present the critical levels only today.
if you’re looking at a wide range of bars and don’t wanna present the critical levels among the entire chart, you may use this restriction to show a cleaner chart.
Filtering critical levels
To present only one or two critical levels (and not all three of them) you may use the style settings. uncheck any critical level that you’re not interested in.
I hope you enjoy this indicator and find it useful,
if you do, please like the script , and feel free to comment below.
Good luck with your trading.

Important Level for the DayThis script will give 1 important level for the day. It has moving average of vwap as well as ema. User can define the period. An important input for the indicator is previous days range. There is a parameter of divisor in which user can define in how many parts he/she wants to divide the previous day. Recommended values are just 3 or 4 not more than that.

donchain support&resistance levels [LM]Hello Traders,
I would like to introduce you donchain support&resistance levels. The idea is to look for important levels that are identified by donchain line, where donchain usualy spents a lot of time without any move usualy turns out to be good level for bounces.
Also note that when there is a big spread between first line and second line it usually leads to some pullback.
Here you have an example of big spread:
You are also able to show donchain lines and not only horizontals this you can find in settings:
Enjoy!
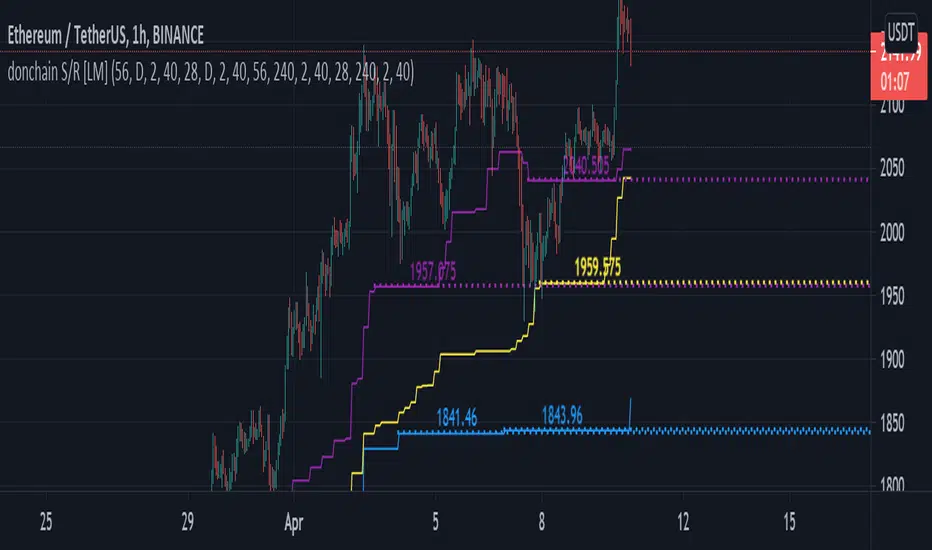
Chart Champions - Part 1 - nPOC - Levels - VWAPsThank you for sparing you time to read my indicator.
This indicator has been created as a suite of 3. This was to ensure that those with only the Free Trading View account could benefit (with their restriction to 3 indicators). Please ensure you install each indicator and read each indicator write up to fully understand what has tried to achieved.
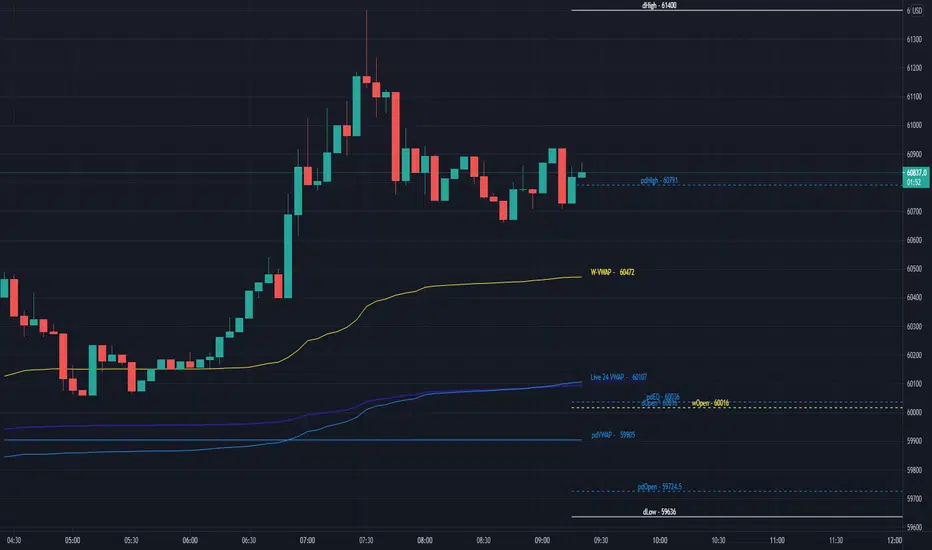
Chart Champions – Part 1 –Lvls nPOC VWAPS
This indicator is broken down into:
• Levels
• VWAPS
• Naked Point of Control
Levels
It displays the levels to the right of the price Axis to enable the user to have a cleaner chart.
The below levels will automatically appear:
dOpen – pdHigh – pdLow – pdEQ – pwEQ
Optional Levels include:
mOpen – pmOpen – pdOpen – dbyOpen – wOpen – pwOpen
VWAPs
Optional VWAPs
Daily (including pdVWAP close) – Weekly – Monthly
Naked Points of Control (nPOC)
To view the nPOC move the chart back in time to pick up the nPOCs.
Chart Champions – Part 2 – CCV IBs POC
This indicator is broken down into:
• Chart Champions Value
• Initial Balance
• Points of Control
Chart Champions Value (CCV)
CCV is based on the 80% rule of the dOpen opening outside of the pdVAH/pdVAL. Please do you own research to fully understand how this trading strategy works (readily avaliable online).
Initial Balance (IB)
IB is based on the first 60 minutes of the market opening. It captures the highest and lowest points within that 60 minutes. Please do you own research to fully understand how this trading strategy works (readily avaliable online).
Points of Control (POCs)
POC are the price levels where the most volume was traded.
Developing POC (dPOC) will constantly move with volume/price action through out the day.
Optional POCs
Previous Day POC (pdPOC) – Day Before Yesterday POC (dbyPOC)
Chart Champions – Part 3 – Sessions - Manual Input
This indicator is broken down into:
• Manual Inputs (daily, weekly, monthly)
• IGOR SessionsTtimes
• Pre + Market Openings
Manual Input
Daily x3
Weekly x 3
Monthly x 3
This allows the trader to put in specific levels.
IGOR Session Times
This is a user specific requirement to highlight cetain times during the day, displayed at the bottom of the chart in the colour strip.
Pre + Market Openings
This allows the user to see when pre market trading has started and with the live maket has started, displayed at the top of the chart in colours.
A huge thank you goes out to:
Stackoverflow users AnyDozer and Bjorn.
TV user ahancock for allow me use of this code.
Disclaimer the lower the timeframe the more information it processes.
[SK] Fibonacci Auto Trend ScouterThe FATS - Fibonacci Auto Trend Scouter automatically draws active trends from 2 different timeframes along with Fibonacci Support and Resistance levels. It also has a Sights feature for each timeframe which points from it's middle towards the current price. The tool is also highly customizable for you to take this indicator over 9000. If you like the tool and it adds value to you - share the love on the like button and visit my profile to check out my other indicators and subscribe, so you're notified of my next scripts and ideas!
Automatic Trend Lines
The indicator takes in 2 timeframes to detect High and Low values from which to draw the trend lines of each timeframe.
As the values change with price movement, the lines are updated. They are color coded for uptrend and downtrend based on the direction of each individual line. Trend lines can be set up to color with only the default value on the configurations panel.
- Toggle on/off Color Coded
- Change Default, Uptrend, Downtrend color
- Change Line Width
- Change Line Style
- Toggle on/off Line Extensions
- Change Extended Line Width
- Change Extended Line Style
- Toggle On/Off labels for 7 data points of each timeframe
Automatic Trend Sights
This is a neat feature that may help you get a better feel for the direction the current movement is heading towards in correlation with the short or medium length timeframe trends. The sight draws a line from the middle vertical point of the trend coordinates towards the current price. They are toggled off by default but can be enabled in the configurations panel.
- Toggle on/off sight on each timeframe
- Change Width
- Change Line Style
Automatic Fibonacci Levels
The tool has a very useful feature to automatically detect the highest and lowest value from the short timeframe to calculate Fibonacci support and resistant levels. To keep the chart area clean, the lines are drawn short by default towards the right side of the price but provide inputs to increase the size of the level lines towards the left and right direction. A triangle label appears to the side of each line which holds the Fibonacci level and price data inside the tooltip, hover over them to activate.
- Toggle on/off color coded
- Change Default, Resistance, Support colors
- Change line size towards the left and right side
- Change line width
- Change Resistance line style
- Change Support line style
- Toggle on/off High and Low source line
- Toggle on/off High and Low source labels

Support and Resistance Levels (v.3)Support and Resistance Levels augmanted and reprocessed
Description:
This is an augmented version of my earlier script that can be found here:
This time it features zigzag and channel lines, signal generation and filtering and performance testing. Signal generation and filtering procedures are used only for performance testing, not for the actual labelling. The labelling is governed by zigzag logic.

Delimited Levels Today SessionThis script takes a delimited string of level values (up to 12) and plots them on the chart as per parameters.
Alerts can be set up for crossing, etc, using the Alerts panel as per usual.
Very handy if you have a spreadsheet or list of values to plot.
For example, say your spreadsheet has a list of these 12 levels to plot:
3800
3811
3822
3837
3851
3862
3877
3887
3902
3913
3928
The values could be copied to notepad / text editor, and the line breaks replaced with a delimiter, such as the ';' character (note: no trailing delimiter), to produce a delimited string:
3800;3811;3822;3837;3851;3862;3877;3887;3902;3913;3928
And then simply copy / paste this delimited string into the "Levels Delimited String" parameter.
Note: This script builds upon earlier script:
Enhancements include:
- Plot only for latest day (weekends factored in)
- Plot only for specified session
- Plot as bands or as lines
