SUPPORT RESISTANCE STRATEGY [5MIN TF]A SUPPORT RESISTANCE BREAKOUT STRATEGY for 5 minute Time-Frame , that has the time condition for Indian Markets
The Timing can be changed to fit other markets, scroll down to "TIME CONDITION" to know more.
The commission is also included in the strategy .
The basic idea is when ,
1) Price crosses above Resistance Level ,indicated by Red Line, is a Long condition.
2) Price crosses below Support Level ,indicated by Green Line , is a Short condition.
3) Candle high crosses above ema1, is a part of the Long condition .
4) Candle low crosses below ema1, is a part of the Short condition .
5) Volume Threshold is an added confirmation for long/short positions.
6) Maximum Risk per trade for the intraday trade can be changed .
7) Default qty size is set to 50 contracts , which can be changed under settings → properties → order size.
8) ATR is used for trailing after entry, as mentioned in the inputs below.
// ═════════════════════════//
// ————————> INPUTS <————————— //
// ═════════════════════════//
→ L_Bars ———————————> Length of Resistance / Support Levels.
→ R_Bars ———————————> Length of Resistance / Support Levels.
→ Volume Break ———————> Volume Breakout from range to confirm Long/Short position.
→ Price Cross Ema —————> Added condition as explained above (3) and (4).
→ ATR LONG —————————> ATR stoploss trail for Long positions.
→ ATR SHORT ————————> ATR stoploss trail for Short positions.
→ RISK ————————————> Maximum Risk per trade intraday.
The strategy was back-tested on TCS ,the input values and the results are mentioned under "BACKTEST RESULTS" below.
// ═════════════════════════ //
// ————————> PROPERTIES<——————— //
// ═════════════════════════ //
Default_qty_size ————> 50 contracts , which can be changed under
Settings
↓
Properties
↓
Order size
// ═══════════════════════════════//
// ————————> TIME CONDITION <————————— //
// ═══════════════════════════════//
The time can be changed in the script , Add it → click on ' { } ' → Pine editor→ making it a copy [right top corner} → Edit the line 27.
The Indian Markets open at 9:15am and closes at 3:30pm.
The 'time_cond' specifies the time at which Entries should happen .
"Close All" function closes all the trades at 3pm , at the open of the next candle.
To change the time to close all trades , Go to Pine Editor → Edit the line 92 .
All open trades get closed at 3pm , because some brokers don't allow you to place fresh intraday orders after 3pm .
// ═══════════════════════════════════════════════ //
// ————————> BACKTEST RESULTS ( 100 CLOSED TRADES )<————————— //
// ═══════════════════════════════════════════════ //
INPUTS can be changed for better Back-Test results.
The strategy applied to NSE:TCS ( 5 min Time-Frame and contract size 50) gives us 60% profitability , as shown below
It was tested for a period a 6 months with a Profit Factor of 1.8 ,net Profit of 30,000 Rs profit .
Sharpe Ratio : 0.49
Sortino Ratio : 1.4
The graph has a Linear Curve with Consistent Profits.
The INPUTS are as follows,
1) L_Bars —————————> 4
2) R_Bars —————————> 4
3) Volume Break ————> 5
4) Price Cross Ema ——> 100
5) ATR LONG ——————> 2.4
6) ATR SHORT —————> 2.6
7) RISK —————————> 2000
8) Default qty size ——> 50
NSE:TCS
Save it to favorites.
Apply it to your charts Now !!
Thank You ☺ NSE:TCS
Trading

Price change scalping short and long strategyPrice change scalping Short and Long strategy uses a rate of change momentum oscillator to calculate the percent change in price between a period of time. Rate of change calculation takes the current price and compares it to a price of "n" periods while the period of time can be defined by a user. The calculated rate of change value is then compared to the upper threshold and the lower threshold values to determine if a position should be opened. If the threshold is crossed and filtering conditions are met a strategy position will be triggered. Entry, take profit, and stop loss prices are calculated and displayed on the chart as well as positions directions. Once the entry price is crossed, a long or short position is created and once the take profit price is crossed, the stop loss price will begin to trail behind the price action using the close of the previous bar. Once the trailing stop price is crossed, the position is closed. If the entry price is not crossed and the price action crosses the stop level, the trade setup is cancelled. The strategy is enhanced by DCA algorithm which allows to average entry price with safety orders. The script also allows to use Martingale coefficient to increase averaging power
Advantages of this script:
Strategy has high net profit of 293% at backtests
Backtests show high accuracy around 71%
High frequency and low duration of trades
Can be used with short-term timeframes ranging from 5 to 60 minutes
Strategy is sustainable to market slumps due to DCA implementation
Can be used for short and long positions (can be adjusted to long only, short only or both)
Can be applied to any market and quote currency
Easy to configure user interface settings
Built in detailed statistic menu
How to use?
1. Apply the strategy to a trading pair your are interested in using 5 to 60 minutes timeframe chart
2. Configure the strategy: change layer values, order size multiple and take profit/stop loss values according to current market cycle stage
3. Set up a TradingView alert to trigger when strategy conditions are met
4. Strategy will send alerts when to enter and when to exit positions which can be applied to your portfolio using external trading platforms
5. Update settings once market conditions are changed using backtests on a monthly period

3Commas dollar cost averaging (DCA) QFL IndicatorAs investors, we often face the dilemma of willing high stock prices when we sell, but not when we buy. There are times when this dilemma causes investors to wait for a dip in prices, thereby potentially missing out on a continual rise. This is how investors get lured away from the markets and become tangled in the slippery slope of market timing, which is not advisable to a long-term investment strategy.
Skyrex developed a complex indicator based on dollar-cost averaging in Quick Fingers Luc's interpretation. It is a combinations of strategies which allows to systematically accumulate assets by investing scaled amounts of money at defined market cycle global support levels. Dollar-cost averaging can reduce the overall impact of price volatility and lower the average cost per asset thus even during market slumps only a small bounce is required to reach take profit.
The indicator script monitors a chart price action and identifies bases as they form. When bases are reached the script provides entry alerts. During price action development an asset value can go lower and in this way the script will perform safety entries alerts at each subsequent accumulation levels. When weighted average entry price reaches target profit the script will perform a take profit action alert.
Bases are identified as pivot lows in a fractal pattern and validated by an adjustable decrease/rise percentage to ensure significancy of identified bases. To qualify a pivot low, the indicator will perform the following validation:
Validate the price rate of change on drops and bounces is above a given threshold amount.
Validate the volume at the low pivot point is above the volume moving average (using a given length).
Validate the volume amount is a given factor of magnitude above is above the volume moving average.
Validate the potential new base is not too close to the previous range by using a given price percent difference threshold amount.
A fractal pattern is a recurring pattern on a price chart that can predict reversals among larger, more chaotic price movements. These basic fractals are composed of five or more bars. The rules for identifying fractals are as follows:
A bearish turning point occurs when there is a pattern with the highest high in the middle and two lower highs on each side.
A bullish turning point occurs when there is a pattern with the lowest low in the middle and two higher lows on each side.
Basic dollar-cost averaging approach is enhances by implementation of adjustable accumulation levels in order to provide opportunity of setting them at defined global support levels and Martingale volume coefficient to increase averaging effect. According to Quick Fingers Luc's principles trading principles we added volume validation of a base because it allows to confirm that the market is resistant to further price decrease.
The indicator supports traditional and cryptocurrency spot, futures , options and marginal trading exchanges. It works accurately with BTC , USD, USDT, ETH and BNB quote currencies. Best to use with 1H timeframe charts and limit orders. The indicator can be and should be configured for each particular asset according to its global support and resistance levels and price action cycles. You can modify levels and risk management settings to receive better performance
The difference between core script and this interpretation is that this strategy is specially designed for 3Commas bots
How to use?
1. Apply indicator to a trading pair your are interested in using 1H timeframe chart
2. Configure the indicator: change layer values, order size multiple and take profit/stop loss values according to current market cycle stage
3. Set up a TradingView custom alert using the indicator settings to trigger on a condition you are interested in
4. The indicator will send alerts when to enter and when to exit positions which can be applied to your portfolio using external trading platforms
5. Update settings once market conditions are changed using backtests on a monthly period

3Commas Dollar cost averaging trading system (DCA)As investors, we often face the dilemma of willing high stock prices when we sell, but not when we buy. There are times when this dilemma causes investors to wait for a dip in prices, thereby potentially missing out on a continual rise. This is how investors get lured away from the markets and become tangled in the slippery slope of market timing, which is not advisable to a long-term investment strategy.
Skyrex developed a complex trading system based on dollar-cost averaging in Quick Fingers Luc's interpretation. It is a combinations of strategies which allows to systematically accumulate assets by investing scaled amounts of money at defined market cycle global support levels. Dollar-cost averaging can reduce the overall impact of price volatility and lower the average cost per asset thus even during market slumps only a small bounce is required to reach take profit.
The strategy script monitors a chart price action and identifies bases as they form. When bases are reached the script provides entry actions. During price action development an asset value can go lower and in this way the script will perform safety entries at each subsequent accumulation levels. When weighted average entry price reaches target profit the script will perform a take profit action.
Bases are identified as pivot lows in a fractal pattern and validated by an adjustable decrease/rise percentage to ensure significancy of identified bases. To qualify a pivot low, the indicator will perform the following validation:
Validate the price rate of change on drops and bounces is above a given threshold amount.
Validate the volume at the low pivot point is above the volume moving average (using a given length).
Validate the volume amount is a given factor of magnitude above is above the volume moving average.
Validate the potential new base is not too close to the previous range by using a given price percent difference threshold amount.
A fractal pattern is a recurring pattern on a price chart that can predict reversals among larger, more chaotic price movements.
These basic fractals are composed of five or more bars. The rules for identifying fractals are as follows:
A bearish turning point occurs when there is a pattern with the highest high in the middle and two lower highs on each side.
A bullish turning point occurs when there is a pattern with the lowest low in the middle and two higher lows on each side.
Basic dollar-cost averaging approach is enhances by implementation of adjustable accumulation levels in order to provide opportunity of setting them at defined global support levels and Martingale volume coefficient to increase averaging effect. According to Quick Fingers Luc's principles trading principles we added volume validation of a base because it allows to confirm that the market is resistant to further price decrease.
The strategy supports traditional and cryptocurrency spot, futures , options and marginal trading exchanges. It works accurately with BTC, USD, USDT, ETH and BNB quote currencies. Best to use with 1H timeframe charts and limit orders. The strategy can be and should be configured for each particular asset according to its global support and resistance levels and price action cycles. You can modify levels and risk management settings to receive better performance
The difference between core script and this interpretation is that this strategy is specially designed for 3Commas bots
How to use?
1. Apply strategy to a trading pair your are interested in using 1H timeframe chart
2. Configure the strategy: change layer values, order size multiple and take profit/stop loss values according to current market cycle stage
3. Set up a TradingView alert to trigger when strategy conditions are met
4. Strategy will send alerts when to enter and when to exit positions which can be applied to your portfolio using external trading platforms
5. Update settings once market conditions are changed using backtests on a monthly period

Dollar cost averaging (DCA) QFL IndicatorAs investors, we often face the dilemma of willing high stock prices when we sell, but not when we buy. There are times when this dilemma causes investors to wait for a dip in prices, thereby potentially missing out on a continual rise. This is how investors get lured away from the markets and become tangled in the slippery slope of market timing, which is not advisable to a long-term investment strategy.
Skyrex developed a complex indicator based on dollar-cost averaging in Quick Fingers Luc's interpretation. It is a combinations of strategies which allows to systematically accumulate assets by investing scaled amounts of money at defined market cycle global support levels. Dollar-cost averaging can reduce the overall impact of price volatility and lower the average cost per asset thus even during market slumps only a small bounce is required to reach take profit.
The indicator script monitors a chart price action and identifies bases as they form. When bases are reached the script provides entry alerts. During price action development an asset value can go lower and in this way the script will perform safety entries alerts at each subsequent accumulation levels. When weighted average entry price reaches target profit the script will perform a take profit action alert.
Bases are identified as pivot lows in a fractal pattern and validated by an adjustable decrease/rise percentage to ensure significancy of identified bases. To qualify a pivot low, the indicator will perform the following validation:
Validate the price rate of change on drops and bounces is above a given threshold amount.
Validate the volume at the low pivot point is above the volume moving average (using a given length).
Validate the volume amount is a given factor of magnitude above is above the volume moving average.
Validate the potential new base is not too close to the previous range by using a given price percent difference threshold amount.
A fractal pattern is a recurring pattern on a price chart that can predict reversals among larger, more chaotic price movements. These basic fractals are composed of five or more bars. The rules for identifying fractals are as follows:
A bearish turning point occurs when there is a pattern with the highest high in the middle and two lower highs on each side.
A bullish turning point occurs when there is a pattern with the lowest low in the middle and two higher lows on each side.
Basic dollar-cost averaging approach is enhances by implementation of adjustable accumulation levels in order to provide opportunity of setting them at defined global support levels and Martingale volume coefficient to increase averaging effect. According to Quick Fingers Luc's principles trading principles we added volume validation of a base because it allows to confirm that the market is resistant to further price decrease.
The indicator supports traditional and cryptocurrency spot, futures, options and marginal trading exchanges. It works accurately with BTC, USD, USDT, ETH and BNB quote currencies. Best to use with 1H timeframe charts and limit orders. The indicator can be and should be configured for each particular asset according to its global support and resistance levels and price action cycles. You can modify levels and risk management settings to receive better performance
Advantages of this indicator:
The indicator has custom alert settings for each strategy action
The indicator can be used with 3Commas, Cryptohopper, Alertatron or Zignaly bots
The indicator is sustainable to market slumps and can be used for long-term trading
The indicator provides a large number of entries which is good for diversification
Can be applied to any market and quote currency
Easy to configure user interface settings
How to use?
1. Apply indicator to a trading pair your are interested in using 1H timeframe chart
2. Configure the indicator: change layer values, order size multiple and take profit/stop loss values according to current market cycle stage
3. Set up a TradingView custom alert using the indicator settings to trigger on a condition you are interested in
4. The indicator will send alerts when to enter and when to exit positions which can be applied to your portfolio using external trading platforms
5. Update settings once market conditions are changed using backtests on a monthly period

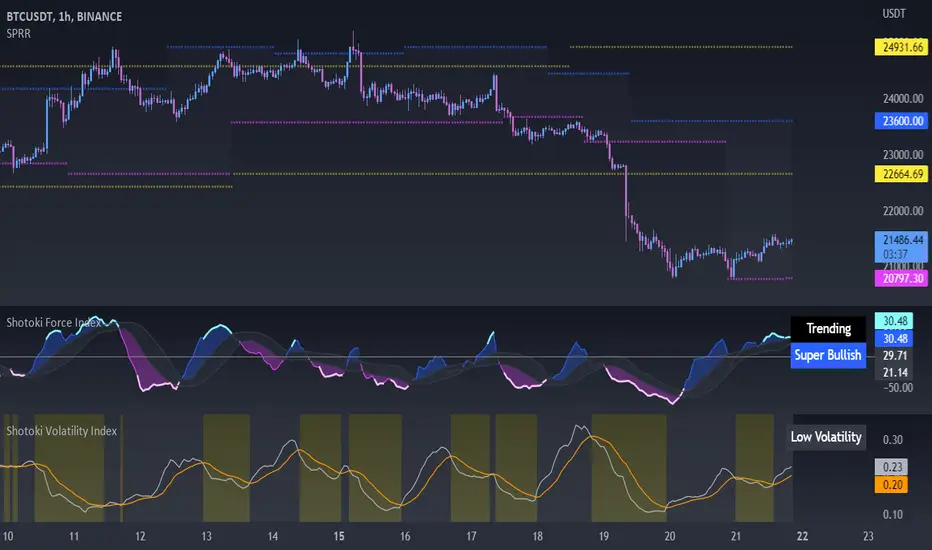
Shotoki Volatility IndexHi, I finally coded a volatility index I'm proud of !
The formula is quite simple : It's the inverse of the maximal volatility that a candle can have
We find 2 lines : the white one, the volatility index ; the delayed index
The yellow area highlight the moment where we have more volatility
the gray one is when the market is quiet, it's not recommended to take decision in these moments
when the index is rising, there are less volatility
when the index is decreasing, the volatility is increasing
Shotoki
Engulfing Candles AlertThis is a Engulfing Candle Indicator with Alerts.
This is not like any other Engulfing candle indicator present on TV. There are some special rules that are being used to identify specific engulfing candles.
Also, the user can choose if they like nice body engulfing or they want to ignore them.
The indicator have the following highlights:
1) Ability to choose the color of the engulfing candle body.
2) Ability to choose a different color for the Liq (liquidity) swap engulfing candle body.
Bullish Engulfing after Liq Swap
Bearish Engulfing after Liq Swap
3) With above 2 options, you can get the desired information without plotting any extra information on the chart.
4) You can put the alerts for getting notified when these patterns forms on the chart.
5) Ability to choose between getting notified or not on the chart if the engulfing candle body is less than 40% of the whole candle size. This is useful in order to identify if the engulfing is really powerful or not.
After selecting the option to ignore such engulfing
6) Ability to choose between getting notified or not on the chart if the engulfed candle body is really small. This is in particular useful for avoiding the engulfing of Doji which in turn might not be that powerful.
After selecting the option to ignore such engulfing
We will keep on making the improvements/Enhancements over the time (Check the changelog for such features)
NOTE: The indicator is of best use if you have a defined & back tested strategy which relies on this type of candlestick pattern.

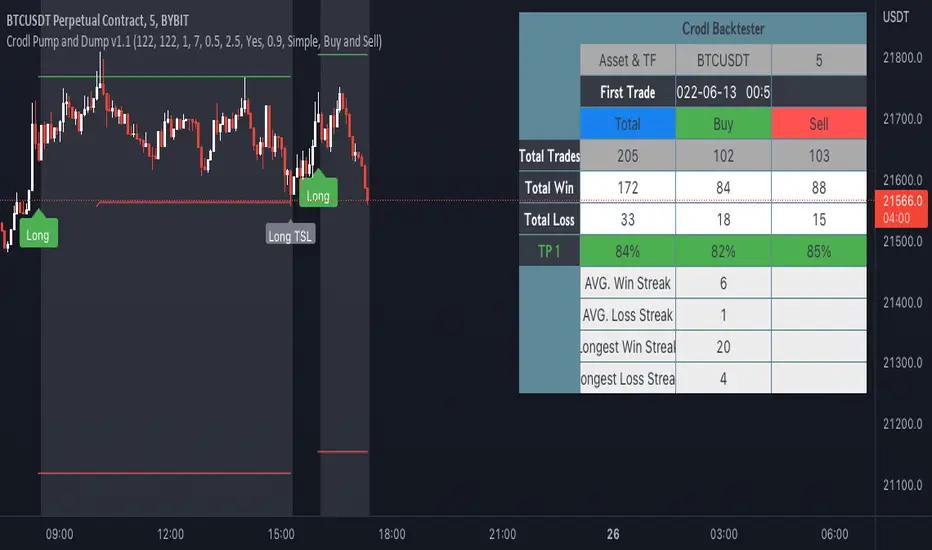
Crodl Pump & DumpThe reason why this indicator is called Pump and Dump is because it is based on volume.
The indicator focuses on volume levels to see if there is an increase in volume before deciding if it is worth entering a Position.
Long example = This will use ATR and price averages to trend Bullish and once the trend favours the upside it will then look at the Volume candles and if a candle is bigger then the average volume and the trend (ATR) is above a certain level it will then Give us a long entry if those conditions are true. We can have more than one long after one another since it will give us a position every-time the conditions are true and after TP(take profit) 1 or a Stop Loss was hit.
Short example = If the trend based on average price is trending downwards and we can see an increase of volume it will wait till we break a certain level breaks when we get the average price from the highs and Lows, then once the trend has met the bearish conditions it will wait for increase in volume and trigger a Sell. The sell will close once TP(take profit) 1 or a Stop Loss is hit.
In the inputs you can adjust the MA (moving average length. This helps to decide if the Trend is bearish or bullish. Higher moving averages will give you less entries and a lower moving average will give you more entries ,since price crosses lower MA's more it will change the trend more often.
Sensitivity is a divider of the MA values is so the higher the Sensitivity the lower the more trades you get since the trend is changing faster.
You will see that there is a backtesting panel on your chart when you look in the inputs there will be a statistics tab which will have 1. Simple 2. Mobile 3. Hide options
1. Simple is designed when you are using a PC or Laptop
2.Can be used when you are using your mobile it will show less data but won't be in your way
3.This will hide the backtesting panel on your screen.
Exit strategy.
there are 3 Types of exits for this indicator.
1 .CrodlExit which is ATR indicator based Exit with a divider.
2 . fIxed SL , this works in % so 1 = 1% market move.
3 .Reverse exits = Longs exit shorts and shorts exit longs.
there are 4 take profit targets and all of them are adjustable.
1= 0.5% by default
2=1% by default
3=1.5% by default
4=2% by default
on the Back tester you will find the following information :
Timeframe of your chart and then the Symbol or pair you are trading.
First trade = when the back tester starts to read data.
Total trade = Total buy and total sell signals and then total trades are buy + sell signals.
total win = total buys hit take profit 1 and total sells that hit take profit 1 and then total buy + total sells that hit take profit 1.
total loss = total buys that hit which ever exit mode you selected in the inputs by default it is crodl exit and total sells that hit which ever exit mode you selected in the inputs by default it is crodl exit and then you will get total buy losses + total sell losses to get total loss.
TP1= the % difference between total trades won and lost for the 1st take profit target and your stop loss method you chose.
TP2= the % difference between total trades won and lost for the 2nd take profit target and your stop loss method you chose.
TP3= the % difference between total trades won and lost for the 3rd take profit target and your stop loss method you chose.
TP4= the % difference between total trades won and lost for the 4th take profit target and your stop loss method you chose.
average win streak give you the average of how many winning trades you had every time before hitting a stop loss.
average loss streak is how many stop loss you hit on average before take profit one has been reached.
longest win streak give you the amount of winning trades you had without hitting a stop lossl that is selected in your inputs.
longest loss streak give you the amount of losing trades you had one after the other before hitting take profit 1.
[KRONOS] DeviationsDescription
This indicator calculates the differences between the current price and the local support or resistance, and normalizes it into a range.
The value basis is calculated from a defined period of time that is then multiplied to get a standard deviations and a max. and min. value subtracted and divided into a final value.
It includes
Extreme zones. This value appears as blue and red lines which deviates from the oversold to overbought range.
Momentum. Lower time frame momentum is represented by a gray histogram as well as a signal line oscillating from a red to blue color.
Strong reversal. Red ( bearish ) and blue ( bullish ) columns will appear on the histogram when our algorithm detects that the strength of momentum is coming to an end indicative of a trend reversal.
Trend confirmation. Red or blue arrows will act as a trend confirmation.
Support and resistance . The zero line will frequently serve as a S/R area.
Divergences. You can use this indicator to detect potential pivot areas.
How to use?
Sell/Short when the histogram shows a red column and the signal line is in or above the overbought area (colored in red).
Buy/Long when the histogram shows a blue column and the signal line is in or below the oversold area (colored in blue).
extra tip: if you entered a trade based on the above conditions, you can partially increase your position each time you see a confirmation arrow.

BINANCE_Minimum_qty_for_tradingWe can not buy just 0.001ETH in Binance on 2022.8.8
Why? Binance have trading role about the minimum qty of coins.
Until now, we can not find the info in TradingView.
I hope Our TradingView give us this updating info easily oneday.
I am not a good English speaker.
Sorry about my short explanation.
reference: www.binance.com

[KRONOS] Gamma StrengthDescription
This indicator's main component is the signal line which represents a very responsive market strength value calculated from real time data and normalized into a range (0 - 0.5 - 1). Indicator is using Stochastic and RSI functions to get raw value filtered through a linear regression, helping users predict imminent market directions. Lastly, this value oscillation is converted into a range to notice overbought and oversold zones at a quick glance.
It includes
Divergence. Indicator plots R for regular divergence and H for hidden with minimal possible delay which can be used to notice irregularity in the market.
Extreme overbought and oversold areas. Colored background extreme areas are showing points where a reversal is approaching.
How to use?
Buy/Long when the indicator line goes out of the blue/oversold area.
Sell/Short when the indicator line goes out of the red/overbought area.
extra tip: you can use the zero line and overbought/oversold zones as either a take profit or an entry area.

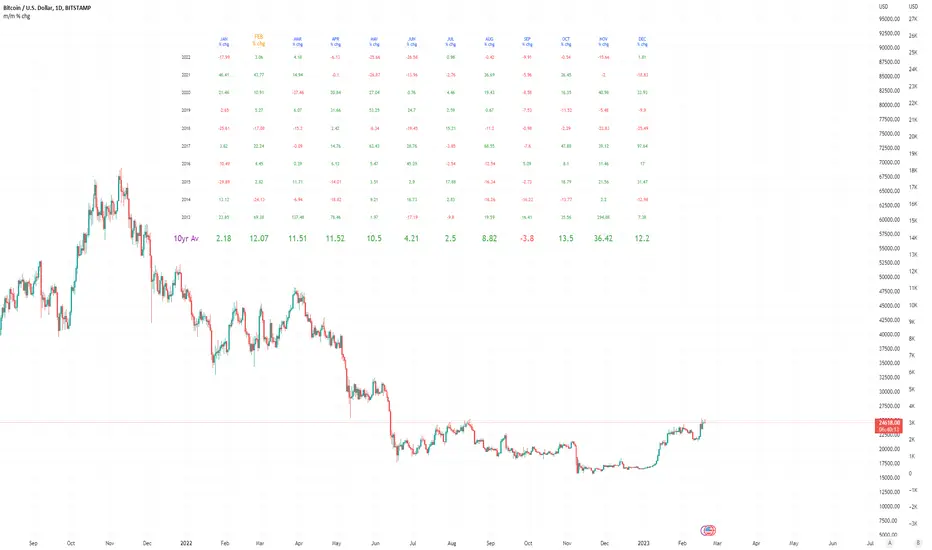
Month/Month Percentage % Change, Historical; Seasonal TendencyTable of monthly % changes in Average Price over the last 10 years (or the 10 yrs prior to input year).
Useful for gauging seasonal tendencies of an asset; backtesting monthly volatility and bullish/bearish tendency.
~~User Inputs~~
Choose measure of average: sma(close), sma(ohlc4), vwap(close), vwma(close).
Show last 10yrs, with 10yr average % change, or to just show single year.
Chose input year; with the indicator auto calculating the prior 10 years.
Choose color for labels and size for labels; choose +Ve value color and -Ve value color.
Set 'Daily bars in month': 21 for Forex/Commodities/Indices; 30 for Crypto.
Set precision: decimal places
~~notes~~
-designed for use on Daily timeframe (tradingview is buggy on monthly timeframe calculations, and less precise on weekly timeframe calculations).
-where Current month of year has not occurred yet, will print 9yr average.
-calculates the average change of displayed month compared to the previous month: i.e. Jan22 value represents whole of Jan22 compared to whole of Dec21.
-table displays on the chart over the input year; so for ES, with 2010 selected; shows values from 2001-2010, displaying across 2010-2011 on the chart.
-plots on seperate right hand side scale, so can be shrunk and dragged vertically.
-thanks to @gabx11 for the suggestion which inspired me to write this
Lune Market Analysis Premium- Version 0.9 -
Lune Algo was developed and built by Lune Trading, utilizing years of their trading expertise. This indicator works on all stocks, cryptos, indices, forex, futures , currencies, ETF's, energy and commodities. All the tools and features you need to assist you on your trading journey. Best of all, Lune Algo is easy to use and many of our tools and strategies have been thoroughly backtested thousands of times to ensure that users have the best experience possible.
Overview
Trade Dashboard—Provides information about the current market conditions, Such as if the market is trending up or down, how much volatility is in the market and even displays information about the current signal.
Trade Statistics—This tool gives you a breakdown of the Statistics of the current selected strategy based on backtests. It tells you the percentage of how often a Take Profit or Stop Loss was hit within a specific time period. Risk and Trade management is very important in trading, and can be the difference between a winning and losing strategy. So we believe that this was mandatory.
Current Features:
Advanced Buy and Sell Signals
Exclusive built-in Strategies
Lune Confidence AI
EK Clouds
Reversal Bands
Vray (Volume Ray)
Divergence Signals
Reversal Signals
Support/Resistance Zones
Built-in Themes
Built-in Risk Management system (take profit/stop loss)
Trade Statistics
Trade Assistance
Trade Dashboard
Advanced Settings
+ More coming soon, Big plans!
Features Breakdown:
Lune Confirmation—Used to help you confirm your trades and trend direction. It uses unique calculations, and its settings can be adjusted to allow traders to adapt the settings to fit their trading style.
Lune Confidence AI—All strategies are equipped with our exclusive built-in Confidence AI. This feature tells you how much confluence there is in a trade. It uses a rating system where signals are given a number from 0 to 5. A rating of 0 indicates that there is not a lot of confluence or confidence in the signal, while a rating of 5 indicates that there is a lot of confidence in the trade. This feature is not perfect and will be improved overtime.
Support/Resistance Zones—Calculates the most important support/resistance levels based on how many times a level has been used as support or resistance. Traders also refer to these as supply and demand zones and key levels.
EK Clouds—Used to further help you confirm trend and was optimized to also be used as support and resistance. This feature is powered by custom moving averages.
Reversal Bands—An optimized and improved version of the infamous Bollinger Bands. When price action takes place within the Reversal Bands it usually indicates that the current symbol is overextended and a reversal is possible.
Vray—Also Known as "Volume Ray", Assists you in better visualizing volume. This helps you find key levels and areas of support that you wouldn't be able to see otherwise. It helps you trade like the institutions.
This indicator's signals DO NOT REPAINT.
If you are using this script you acknowledge past performance is not necessarily indicative of future results and there are many more factors that go into being a profitable trader.

RSI - S&P Sector ETFsThe script displays RSI of each S&P SPDR Sector ETF
XLB - Materials
XLC - Communications
XLE - Energy
XLF - Financials
XLI - Industrials
XLK - Technology
XLP - Consumer Staples
XLRE - Real Estate
XLU - Utilities
XLV - Healthcare
XLY - Consumer Discretionary
It is meant to identify changes in sector rotation, compare oversold/overbought signals of each sector, and/or any price momentum trading strategy applicable to a trader.

Short Swing Bearish MACD Cross (By Coinrule)This strategy is oriented towards shorting during downside moves, whilst ensuring the asset is trading in a higher timeframe downtrend, and exiting after further downside.
This script can work well on coins you are planning to hodl for long-term and works especially well whilst using an automated bot that can execute your trades for you. It allows you to hedge your investment by allocating a % of your coins to trade with, whilst not risking your entire holding. This mitigates unrealised losses from hodling as it provides additional cash from the profits made. You can then choose to hodl this cash, or use it to reinvest when the market reaches attractive buying levels. Alternatively, you can use this when trading contracts on futures markets where there is no need to already own the underlying asset prior to shorting it.
ENTRY
This script utilises the MACD indicator accompanied by the Exponential Moving Average (EMA) 450 to enter trades. The MACD is a trend following momentum indicator and provides identification of short-term trend direction. In this variation it utilises the 11-period as the fast and 26-period as the slow length EMAs, with signal smoothing set at 9.
The EMA 450 is used as additional confirmation to prevent the script from shorting when price is above this long-term moving average. Once price is above the EMA 450 the script will not open any shorts - preventing the rule from attempting to short uptrends. Due to this, this strategy is ideal for setting and forgetting.
The script will enter trades based on two conditions:
1) When the MACD signals a bearish cross. This occurs when the EMA 11 crosses below the EMA 26 within the MACD signalling the start of a potential downtrend.
2) Price has closed below the EMA 450. Price closing below this long-term EMA signals that the asset is in a sustained downtrend. Price breaking above this could indicate a bullish strength in which shorting would not be profitable.
EXIT
This script utilises a set take-profit and stop-loss from the entry of the trade. The take profit is set at 8% and the stop loss of 4%, providing a risk reward ratio of 2. This indicates the script will be profitable if it has a win ratio greater than 33%.
Take-Profit Exit: -8% price decrease from entry price.
OR
Stop-Loss Exit: +4% price increase from entry price.
Based on backtesting results across a selection of assets, the 45-minute and 1-hour timeframes are the best for this strategy.
The strategy assumes each order is using 30% of the available coins to make the results more realistic and to simulate you only ran this strategy on 30% of your holdings. A trading fee of 0.1% is also taken into account and is aligned to the base fee applied on Binance.
The backtesting data was recorded from December 1st 2021, just as the market was beginning its downtrend. We therefore recommend analysing the market conditions prior to utilising this strategy as it operates best on weak coins during downtrends and bearish conditions, however the EMA 450 condition should mitigate entries during bullish market conditions.

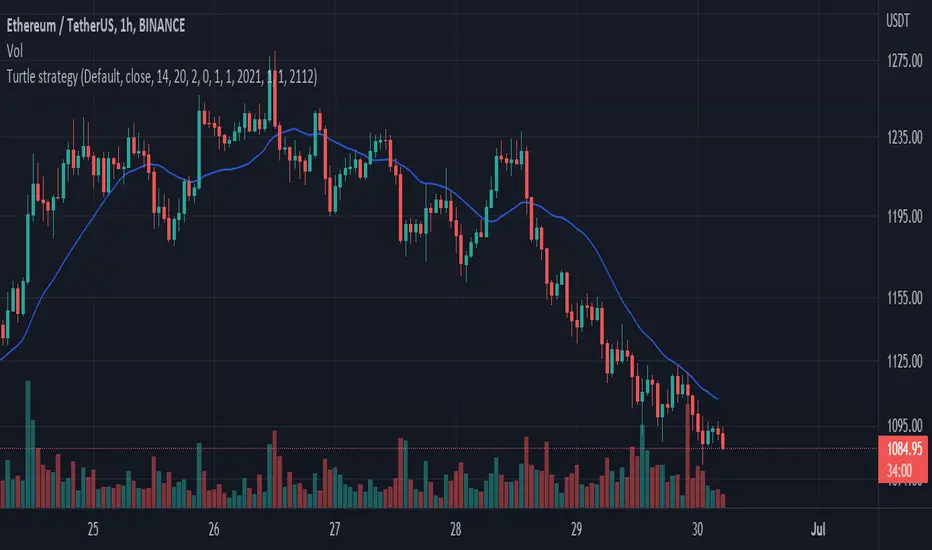
Crypto_Troll_Turtle_StrategyTurtle Strategy for high marketcap cryptocurrencies
I'm glad to launch my strategy which is based on
moving averages / bollinger bands / RSI and volume
It's basically made for scalping with an interesting return over the last two years and a perspectively low drawdown
if you're interested in the strategy and you want to use it for futures trading you can contact me for a money & risk management rules that you can use and prevent you from a huge loss !! it's for free don't worry xD you can find my contact in the author's instructions' label
The optimal timeframe to use is 1H
I'll be trying to launch telegram signals for this strategy as soon as possible for the following pairs: BTCUSDT ETHUSDT BNBUSDT timeframe: 1H
I'm open to all reviews ! thanks !
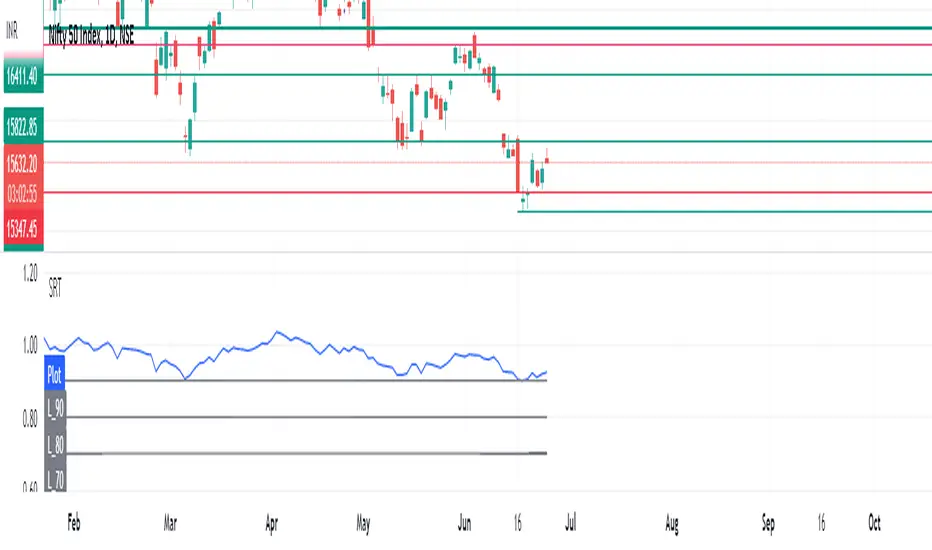
SRT Indicator script based on Knowledge sharing by NKIn a year, there are 248/ 252 trading days .
Half of this is 124. Even 125/ 126 can be taken.
For Ex: We get SRT value by dividing the Nifty Spot with 124 SMA value applied on Nifty in a Day Chart.
This value Travels between 0.6 ( Bottom) to 1.38/1.4/1.45/1.5 ( Top).
Ideal Entry in stock will be at 0.6, which is very rare. You tend to buy at 0.7/0.8/0.9/1.10.
Exit from stock will be at 1.5.
However, generally, we get a value of 0.8/0.9 and we should start investing 20 % at a time. For every 0.1 declines, we should add 20 % to the stock portfolio.
Start Booking Profit if the SRT value is above 1.35 & book 50 % of the portfolio when SRT value is 1.45.
For Traders, as when SRT value comes to 0.8/ 0.9. Buy when HM comes in a buy in Monthly Time Frame.
SRT moves between 0.6 to 1.5 and which is a very reliable parameter for Investing.
Best time to invest in NIFTY is when SRT is between 0.6 to 0.9, NIFTY returned 2X, 3X or even more in less than a year.
Make sure Hilega Milega on Monthly Time frame is BUY before investing at these levels
Invest in batches, 30% of your capital when SRT is 0.9 and repeat every 0.1 downside
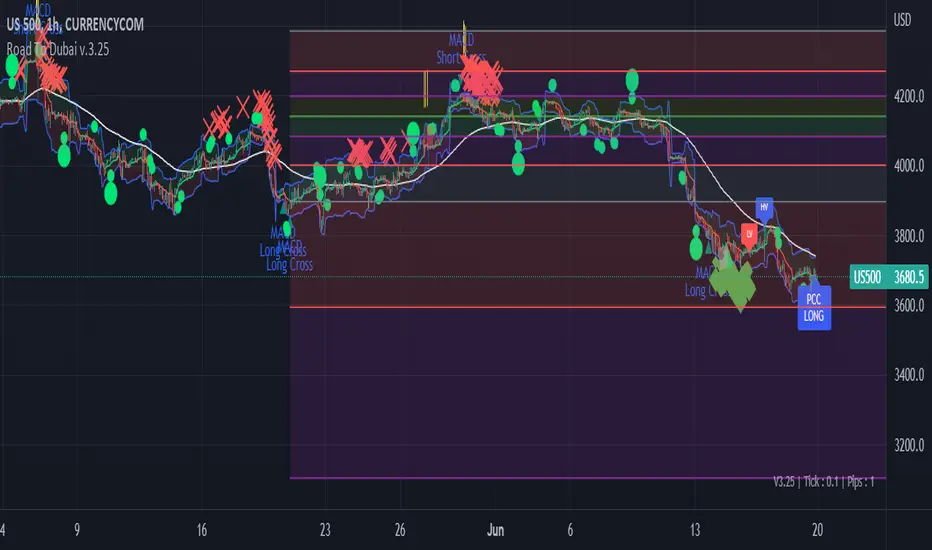
Road To DubaiROAD TO DUBAI
Useful for daily trading over all type of asset, from Stock to Crypto, Forex and Commodities. It works best with 5min to 1hr graphs, if you are a intraday trader.
This is not a simple mashup of indicators, because you can add them as your own.
This script is more like a tool to understand price action based on indicators position . Thanks to cross call based on MACD , RSI with EMA applied and few index realtime mapping, this tool will let you reduce time effort for graph analysis .
As extra feature it will let you to try different strategies , all fully customizable.
I've tried my best to keep it readble, and easy to use. The best way to learn to use it, is to disable all features from configuration and try one by one.
CONFIGURATION TIPS : Click "Settings Gear" in the Upper Right Corner and disable "Indicator Arguments"
HOW TO PROPER SETUP
Road to Dubai 3 is semiautomatic on finding best Long and Short areas, and plot on the chart.
From configuration menu you can set a Backtrace period and sensibility for RSI EMA10, RSI EMA80 and MACD on your Timeframe, 5min, 30min, 60min.
Usually when configured, those parameters works fine on almost every asset.
You only need to start understanding signals.
STANDARD FEATURES
VWAP : Green/Red line. It will reset everyday at 00.00.
EMA80 : White Line
BLUELINES : Positive and negative overextend value from VWap . This is based on a range of bar and it will extend on the opposite side the lower or higher candle. Useful for understading where price can arrive, expecially if a spike will appear.
Those indicators are quite useful for understading trends, price positions and maximum price range.
RSI EMA10 OVERBOUGHT / OVERSOLD
Yellow arrow marks where RSI arrived at his Top or Bottom. If on different timeframes (5min, 30min and 60min) something similar happen area is filled with Red or Green.
This is base on EMA10 applied to RSI (I usually refer at it as Yellow Line on my indicator HighFreq Trader)
To find good values please try High Freq Trader 1.3
RSI EMA80 CALL
Red Cross or Green Square advice for a really potential inversion of trend. When a Silver bar appear, this means the same call was triggered on different Timeframe in the sametime.
This is based on EMA80 applied to RSI (I usually refer at it as Blue Line on my indicator HighFreq Trader).
To find good values please try High Freq Trader 1.3
MACD CALL
Based on MACD with standard settings. When triggered, a lime Triangle appears. Differents size based on timeframe (5min smaller, 60min bigger). If the same call is triggered on the same place a Lime Bar appear on the opposite side of trend (this is a graphical contents, bacause with all enabled, standard use, can be difficult to read signals).
In Menu Settings you will be able to set your best parameter for your asset.
MACD FIBONACCI EXTRA FEATURE
If you want you can enable a Fibonacci draw based on MACD . This works at his best (on my opinion) with 30min MACD
EXAMPLE
NATURAL GAS
In this chart 30min you can see all calls triggered for a Short. Yellow RSI Arrow, Red Cross, Macd Triangle and Colored Red, Lime and Silver Bars are all calling for Short.
In this way you can see in notime if this can be a perfect moment for take position
VIX VXN DXY CALLS
If VIX , VXN is triggered a small Green Dot will appear. If both are in the same time a bigger Dot appear. Very useful to find trend inversion.
If DXY is triggered a Red Dot will appear (only on Daily Chart ). Very Useful to understand trend inversion on whole market.
VOLUMES REMINDERS
Find if there was an High Volume traded (HV) or Low Volume Traded (LV) in the near past. Useful to understand if some tricky situation could happen (like a sudden sell, an accumulation or distribution)
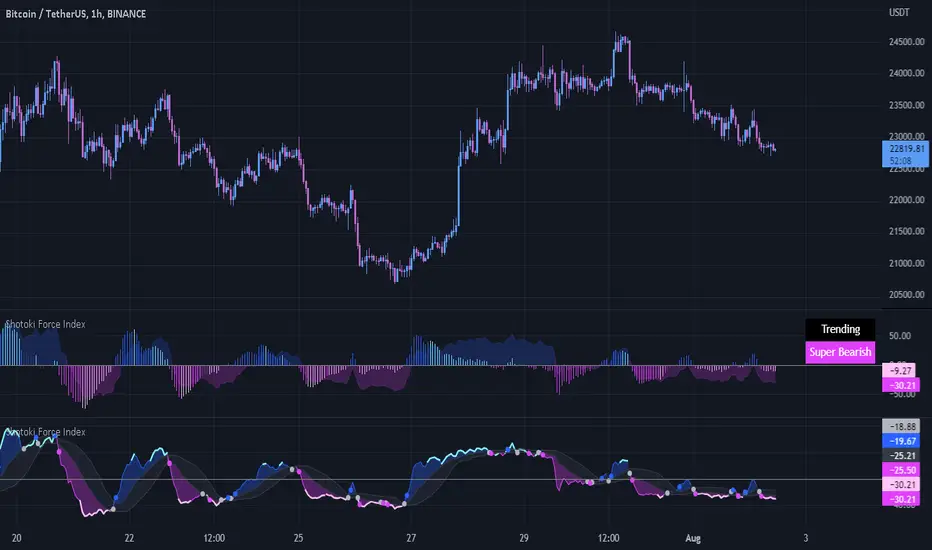
Shotoki Force IndexHi,
I publish my private indicator.
The colored line is called SFI
When it turns blue, it's bullish (enter with a dot)
When it turns purple, it's bearish (enter with dot)
The SFI is "followed" by he bollinger bands.
I use the RV²I as factor
Do not use it allow to trade
I added a RSI option to see when to exit early
Shotoki
Thank's Muxxy for the idea (BB bands)
Motion LineThis script plots the Motion Line, a concept explained in Glenn Neely's River Trading Technology, on the go.
Due to the limitations on Pine Script at the time of writing this script, plotting Motion Line on Violent Outside-bars does not follow the main procedure...
For example on this occasion, the snapshot below displays how exactly the Motion Line should be drawn when a Violent Outside-bar condition is met:
But this is how the script handles it:
The first connection point to the Violent Outside-bar is ignored and the line is continued from second point of connection. In such situations a different color is applied on the Motion Line.

Bjorgum Double Tap█ OVERVIEW
Double Tap is a pattern recognition script aimed at detecting Double Tops and Double Bottoms. Double Tap can be applied to the broker emulator to observe historical results, run as a trading bot for live trade alerts in real time with entry signals, take profit, and stop orders, or to simply detect patterns.
█ CONCEPTS
How Is A Pattern Defined?
Doubles are technical formations that are both reversal patterns and breakout patterns. These formations typically have a distinctive “M” or a “W” shape with price action breaking beyond the neckline formed by the center of the pattern. They can be recognized when a pivot fails to break when tested for a second time and the retracement that follows breaks beyond the key level opposite. This can trap entrants that were playing in the direction of the prior trend. Entries are made on the breakout with a target projected beyond the neckline equal to the height of the pattern.
Pattern Recognition
Patterns are recognized through the use of zig-zag; a method of filtering price action by connecting swing highs and lows in an alternating fashion to establish trend, support and resistance, or derive shapes from price action. The script looks for the highest or lowest point in a given number of bars and updates a list with the values as they form. If the levels are exceeded, the values are updated. If the direction changes and a new significant point is made, a new point is added to the list and the process starts again. Meanwhile, we scan the list of values looking for the distinctive shape to form as previously described.
█ STRATEGY RESULTS
Back Testing
Historical back testing is the most common method to test a strategy due in part to the general ease of gathering quick results. The underlying theory is that any strategy that worked well in the past is likely to work well in the future, and conversely, any strategy that performed poorly in the past is likely to perform poorly in the future. It is easy to poke holes in this theory, however, as for one to accept it as gospel, one would have to assume that future results will match what has come to pass. The randomness of markets may see to it otherwise, so it is important to scrutinize results. Some commonly used methods are to compare to other markets or benchmarks, perform statistical analysis on the results over many iterations and on differing datasets, walk-forward testing, out-of-sample analysis, or a variety of other techniques. There are many ways to interpret the results, so it is important to do research and gain knowledge in the field prior to taking meaningful conclusions from them.
👉 In short, it would be naive to place trust in one good backtest and expect positive results to continue. For this reason, results have been omitted from this publication.
Repainting
Repainting is simply the difference in behaviour of a strategy in real time vs the results calculated on the historical dataset. The strategy, by default, will wait for confirmed signals and is thus designed to not repaint. Waiting for bar close for entires aligns results in the real time data feed to those calculated on historical bars, which contain far less data. By doing this we align the behaviour of the strategy on the 2 data types, which brings significance to the calculated results. To override this behaviour and introduce repainting one can select "Recalculate on every tick" from the properties tab. It is important to note that by doing this alerts may not align with results seen in the strategy tester when the chart is reloaded, and thus to do so is to forgo backtesting and restricts a strategy to forward testing only.
👉 It is possible to use this script as an indicator as opposed to a full strategy by disabling "Use Strategy" in the "Inputs" tab. Basic alerts for detection will be sent when patterns are detected as opposed to complex order syntax. For alerts mid-bar enable "Recalculate on every tick" , and for confirmed signals ensure it is disabled.
█ EXIT ORDERS
Limit and Stop Orders
By default, the strategy will place a stop loss at the invalidation point of the pattern. This point is beyond the pattern high in the case of Double Tops, or beneath the pattern low in the case of Double Bottoms. The target or take profit point is an equal-legs measurement, or 100% of the pattern height in the direction of the pattern bias. Both the stop and the limit level can be adjusted from the user menu as a percentage of the pattern height.
Trailing Stops
Optional from the menu is the implementation of an ATR based trailing stop. The trailing stop is designed to begin when the target projection is reached. From there, the script looks back a user-defined number of bars for the highest or lowest point +/- the ATR value. For tighter stops the user can look back a lesser number of bars, or decrease the ATR multiple. When using either Alertatron or Trading Connector, each change in the trail value will trigger an alert to update the stop order on the exchange to reflect the new trail price. This reduces latency and slippage that can occur when relying on alerts only as real exchange orders fill faster and remain in place in the event of a disruption in communication between your strategy and the exchange, which ensures a higher level of safety.
👉 It is important to note that in the case the trailing stop is enabled, limit orders are excluded from the exit criteria. Rather, the point in time that the limit value is exceeded is the point that the trail begins. As such, this method will exit by stop loss only.
█ ALERTS
Five Built-in 3rd Party Destinations
The following are five options for delivering alerts from Double Tap to live trade execution via third party API solutions or chat bots to share your trades on social media. These destinations can be selected from the input menu and alert syntax will automatically configure in alerts appropriately to manage trades.
Custom JSON
JSON, or JavaScript Object Notation, is a readable format for structuring data. It is used primarily to transmit data between a server and a web application. In regards to this script, this may be a custom intermediary web application designed to catch alerts and interface with an exchange API. The JSON message is a trade map for an application to read equipped with where its been, where its going, targets, stops, quantity; a full diagnostic of the current state and its previous state. A web application could be configured to follow the messages sent in this format and conduct trades in sync with alerts running on the TV server.
Below is an example of a rendered JSON alert:
{
"passphrase": "1234",
"time": "2022-05-01T17:50:05Z",
"ticker": "ETHUSDTPERP",
"plot": {
"stop_price": 2600.15,
"limit_price": 3100.45
},
"strategy": {
"position_size": 0.1,
"order_action": "buy",
"market_position": "long",
"market_position_size": 0,
"prev_market_position": "flat",
"prev_market_position_size": 0
}
}
Trading Connector
Trading Connector is a third party fully autonomous Chrome extension designed to catch alert webhooks from TradingView and interface with MT4/MT5 to execute live trades from your machine. Alerts to Trading Connector are simple; just select the destination from the input drop down menu, set your ticker in the "TC Ticker" box in the "Alert Strings" section and enter your URL in the alert window when configuring your alert.
Alertatron
Alertatron is an automated algo platform for cryptocurrency trading that is designed to automate your trading strategies. Although the platform is currently restricted to crypto, it offers a versatile interface with high flexibility syntax for complex market orders and conditions. To direct alerts to Alertatron, select the platform from the 3rd party drop down, configure your API key in the ”Alertatron Key” box and add your URL in the alert message box when making alerts.
3 Commas
3 Commas is an easy and quick to use click-and-go third party crypto API solution. Alerts are simple without overly complex syntax. Messages are simply pasted into alerts and executed as alerts are triggered. There are 4 boxes at the bottom of the "Inputs" tab where the appropriate messages to be placed. These messages can be copied from 3 Commas after the bots are set up and pasted directly into the settings menu. Remember to select 3 Commas as a destination from the third party drop down and place the appropriate URL in the alert message window.
Discord
Some may wish to share their trades with their friends in a Discord chat via webhook chat bot. Messages are configured to notify of the pattern type with targets and stop values. A bot can be configured through the integration menu in a Discord chat to which you have appropriate access. Select Discord from the 3rd party drop down menu and place your chat bot URL in the alert message window when configuring alerts.
👉 For further information regarding alert setup, refer to the platform specific instructions given by the chosen third party provider.
█ IMPORTANT NOTES
Setting Alerts
For alert messages to be properly delivered on order fills it is necessary to place the following placeholder in the alert message box when creating an alert.
{{strategy.order.alert_message}}
This placeholder will auto-populate the alert message with the appropriate syntax that is designated for the 3rd party selected in the user menu.
Order Sizing and Commissions
The values that are sent in alert messages are populated from live metrics calculated by the strategy. This means that the actual values in the "Properties" tab are used and must be set by the user. The initial capital, order size, commission, etc. are all used in the calculations, so it is important to set these prior to executing live trades. Be sure to set the commission to the values used by the exchange as well.
👉 It is important to understand that the calculations on the account size take place from the beginning of the price history of the strategy. This means that if historical results have inflated or depleted the account size from the beginning of trade history until now, the values sent in alerts will reflect the calculated size based on the inputs in the "Properties" tab. To start fresh, the user must set the date in the "Inputs" tab to the current date as to remove trades from the trade history. Failure to follow this instruction can result in an unexpected order size being sent in the alert.
█ FOR PINECODERS
• With the recent introduction of matrices in Pine, the script utilizes a matrix to track pivot points with the bars they occurred on, while tracking if that pivot has been traded against to prevent duplicate detections after a trade is exited.
• Alert messages are populated with placeholders ; capability that previously was only possible in alertcondition() , but has recently been extended to `strategy.*()` functions for use in the `alert_message` argument. This allows delivery of live trade values to populate in strategy alert messages.
• New arguments have been added to strategy.exit() , which allow differentiated messages to be sent based on whether the exit occurred at the stop or the limit. The new arguments used in this script are `alert_profit` and `alert_loss` to send messages to Discord

Short Selling EMA Cross (By Coinrule)BINANCE:AVAXUSDT
This short selling script works best in periods of downtrends and general bearish market conditions, with the ultimate goal to sell as the the price decreases further and buy back before a rebound.
This script can work well on coins you are planning to hodl for long-term and works especially well whilst using an automated bot that can execute your trades for you. It allows you to hedge your investment by allocating a % of your coins to trade with, whilst not risking your entire holding. This mitigates unrealised losses from hodling as it provides additional cash from the profits made. You can then choose to to hodl this cash, or use it to reinvest when the market reaches attractive buying levels.
Entry
The exponential moving average ( EMA ) 20 and EMA 50 have been used for the variables determining the entry to the short. EMAs can operate better than simple moving averages due to the additional weighting placed on the most recent data points, whereas simple moving averages weight all the data the same. This means that price is tracked more closely and the most recent volatile moves can be captured and exploited more efficiently using EMAs.
Our backtesting data revealed that the most profitable timeframe was the 30-minute timeframe, this also enabled a good frequency of trades and high profitability.
A fast (shorter term) exponential moving average , in this strategy the EMA 20, crossing under a slow (longer term) moving average, in this example the EMA 50, signals the price of an asset has started to trend to the downside, as the most recent data signals price is declining compared to earlier data. The entry acts on this principle and executes when the EMA 20 crosses under the EMA 50.
Enter Short: EMA 20 crosses under EMA 50.
Exit
This script utilises a take profit and stop loss for the exit. The take profit is set at -8% and the stop loss is set at +16% from the entry price. This would normally be a poor trade due to the risk:reward equalling 0.5. However, when looking at the backtesting data, the high profitability of the strategy (93.33%) leads to increased confidence and showcases the high probability of success according to historical data.
The take profit (-8%) and the stop loss (+16%) of the strategy are widely placed to ensure the move is captured without being stopped out due to relief rallies. The stop loss also plays a role of mitigating losses and minimising risk of being stuck in a short position once there has been a fundamental trend reversal and the market has become bullish .
Exit Short: -8% price decrease from entry price.
OR
Exit Short: +16% price increase from entry price.
Tip: Research what coins have consistent and large token unlocks / highly inflationary tokenomics, and target these during bear markets to short as they will most likely have substantial selling pressure that outweighs demand - leading to declining prices.
The strategy assumes each order is using 30% of the available coins to make the results more realistic and to simulate you only ran this strategy on 30% of your holdings. A trading fee of 0.1% is also taken into account and is aligned to the base fee applied on Binance.
The backtesting data was recorded from December 1st 2021, just as the market was beginning its downtrend. We therefore recommend analysing the market conditions prior to utilising this strategy as it operates best on weak coins during downtrends and bearish conditions.

The Impossible TraderTHE IMPOSSIBLE TRADER
A simple, but effective High Freq Strategy script based on MACD or RSI trend, with extra customizable Alert Messages for Bots.
WHAT IT DOES
This script (works best at lower TimeFrames) just follow the trend of MACD or RSI on your asset.
Why it should work? Because in an upper trend, there are more chance of green candles than reds. And in dump trend there are more chance of red candles than greens.
While trend is positive, it will try to open Long orders as fast as possible at market price.
While trend is negative, it will try to open Short orders as fast as possible at market price.
HOW TO SETUP YOUR PREFERENCES
Capital : Insert a % of Margin you want to use for your positions (usually 30% is quite good)
Leverage : Choose leverage based on your plans
Trail Tick @ : This value (in Tick) tell the script "when" the "Trail Stop" order must be activated (from the Entry price)
Offset Tick @ : This is the price (in Tick) from the Trail Stop Price activated. Basically it is a Stop Loss that follow the price at a fixed distance.
SL Tick @ : Set a Stop Loss at amount Tick distance from the Entry Price. (Let's call it a Safety Stop Loss for bad decisions...)
TP Tick @ : Set a Take Profit at amount Tick distance from the Entry Price. Sometimes is better to exit in full Gain than keep positions.
Strategy : You can choose a Only Long, Only Short or Long+Short sametime strategy.
with MACD or RSI : You can try the strategy applied on MACD or applied on customizable RSI EMA
EMA : If you choosed RSI EMA, you can set any value for your testing (usually 80-120 works very nice)
Exit order after bars : Some Exchanges / Brokers apply fixed cost, and a strategy too fast could not be productive. This set will let you to delay the Exit Order on already Opened positions.
Keep Stop Loss active : If you are planning a delay for Exit Orders, sometime could be useful to keep activated Stop Loss.
Strategy Preset : Some preset I've found interesting, with good results.
BackTest Days : If there are too many results and script doesn't work, you can choose a closer range to show results.
EXTRA FEATURES
On Screen Display : OSD will show you some realtime stats about your strategy, like Asset Tick, Trading Period Range, Drawdown, Gains and not closed trade.
Alert Message : You can enter custom Long Entry/Exit and Short Entry/Exit message for your Bots (like AutoView, WunderBit, etc...). When alert is triggered, you can send custom message with {{strategy.order.comment}} in the text field
AutoView Alert Message : If you are user of AutoView, you can generate your calls. Those are tested only on Oanda with index like Sp500, US100, Us30.
TIPS ON USE
Some asset on TradingView require an higher initial capital. Go to this Script Settings -> Properties and rise Initial Capital.
Be aware of commissions and spread when evalutating a strategy. Go to this Script Settings -> Properties and set Commission and Slippage
Trail Stop and Ticks could be difficult to understand, but very profitable. Please take your time and study how it works.
Consider Tick like the minimum movement your asset can do. Ticks occurs "intra-bar", so some of your positions could be closed almost instantly.
Consider Trail Stop like a Stop Loss that keep always the same distance from your positions, but never came back . If you are in gain, say of 10 Ticks, and your Trail have 5 Ticks, this means for sure a close at minimum 5 Ticks from Entry Price.
On Screen Display will show you Ticks for your asset. This will help you on strategy settings, because not all asset responds on the same way.
ONLY LONG EXAMPLE
ONLY SHORT EXAMPLE
