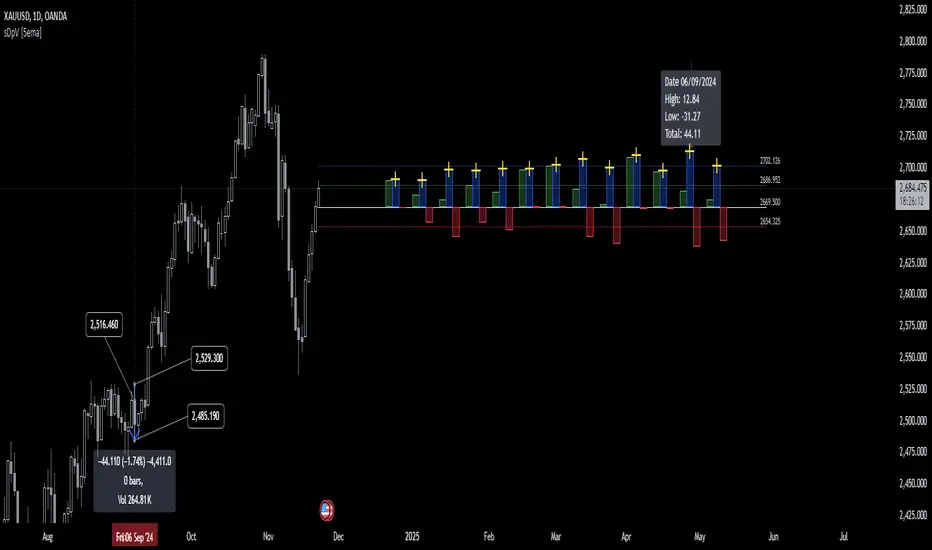
Same Day Price Volatility [5ema]Indicator visualizes the price volatility of the current day alongside historical volatility patterns of the same weekday across previous weeks. It highlights high, low, and total volatility ranges with interactive boxes, labels, and average lines for easy analysis.
=====
A. How to Calculate?
*Current Day Volatility:
High Volatility: High − Open
Low Volatility: Low − Open
Total Volatility: High − Low
*Historical Volatility:
The script scans historical data for the same weekday over the past number weeks (default: 12 weeks).
It calculates the high, low, and total volatility for each historical same day.
Average Lines:
Averages for high, low, and total volatility are calculated from historical values and plotted as dotted lines.
=====
B. How to Set Up?
Inputs:
Weeks Back (nb): Number of past weeks to include in historical calculations (default: 12).
Position (pos): Horizontal offset for displaying boxes and labels (default: 50).
Colors: Customize box colors for high, low, and total volatility ranges.
=====
C. How to Use?
Analyze Current Day Volatility:
The script displays boxes for today's high, low, and total volatility relative to the opening price.
Labels provide detailed tooltips for easy interpretation.
Compare Historical Patterns:
Historical volatility boxes for the same weekday are plotted for up to number weeks.
Labels display the exact date and volatility values for each historical day.
Utilize Average Volatility Lines:
Use the average lines to compare today's performance against historical averages for high, low, and total volatility.
Customizing Visualization:
Adjust the pos input to reposition the boxes and labels if overlapping with price data.
Modify the colors to suit your preferred visual style.
=====
This indicator is for reference only, you need your own method and strategy.
If you have any questions, please let me know in the comments.
Историческая волатильность
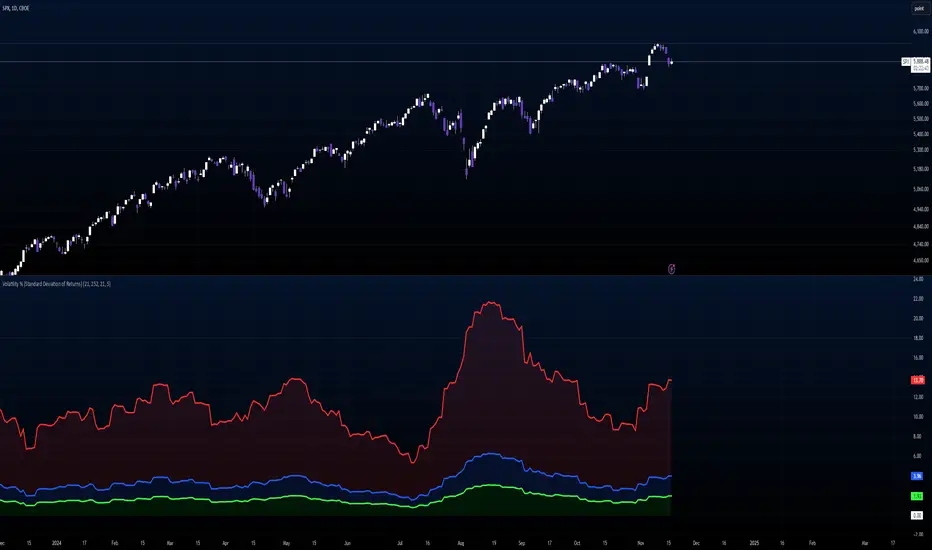
Volatility % (Standard Deviation of Returns)This script takes closing prices of candles to measure the Standard Deviation (σ) which is then used to calculate the volatility by taking the stdev of the last 30 candles and multiplying it by the root of the trading days in a year, month and week. It then multiplies that number by 100 to show a percentage.
Default settings are annual volatility (252 candles, red), monthly volatility (30 candles, blue) and weekly volatility (5 candles, green) if you use daily candles. It is open source so you can increase the number of candles with which the stdev is calculated, and change the number of the root that multiplies the stdev.
Z Value AlertZ Value Alert analyzes daily price movements by evaluating fluctuations relative to historical volatility. It calculates the daily percentage change in the closing price, the average of this change over 252 days, and the standard deviation. Using these values, a Z-Score is calculated, indicating how much the current price change deviates from the historical range of fluctuations.
The user can set a threshold in standard deviations (Z-Score). When the absolute Z-Score exceeds this threshold, a significant movement is detected, indicating increased volatility. The Z-Score is visualized as a histogram, and an alert can be triggered when a significant movement occurs.
The number of trading days used to calculate historical volatility is adjustable, allowing the Sigma Move Alert to be tailored to various trading strategies and analysis periods.
Additionally, a dropdown option for the calculation method is available in the input menu, allowing the user to select between:
Normal: Calculates the percentage change in closing prices without using the logarithm.
Logarithmic: Uses the natural logarithm of daily returns. This method is particularly suitable for longer timeframes and scientific analyses, as logarithmic returns are additive.
These comprehensive features allow for precise customization of the Sigma Move Alert to individual needs and specific market conditions.

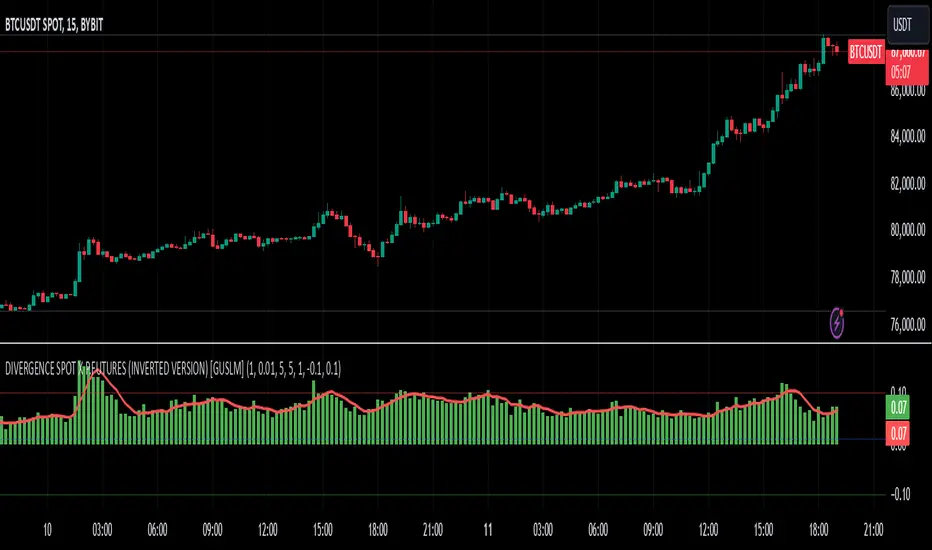
DIVERGENCE SPOT X P.FUTURES (INVERTED VERSION) [GUSLM]Many asked me to change the positive position x negative(of "DIVERGENCE SPOT X P.FUTURES"). being maybe no intuitive for some coins and situations....
So, Now on this version you are going to have UP moves for Upwards from derivatives ( p. Futures with Higher prices than Spot prices), and Dowwards for Negative Futures derivatives. ( it will match the future funding rates probably)
The "pushs" now are in the oposite direction.
Look at the DIVERGENCE SPOT X P.FUTURES script for a better view about it.
For instance:
This version is better for normal coin and market - where the derivatives go in the direction of the price and the coin will have a positive FR(funding) when going up, and maybe sometimes negatives when going down.
The First non inverted version: is better for manipulated coins, where you have pushs and pulls, to try to build a negative funding while hold longs positions. it will go up with negative FR. - Shorters paying the longs and being liquidated in the way..
But you can chose one and adaptd to use only one fot both situations, only need to take a look on the market and define whats going on with the books and prices moves.
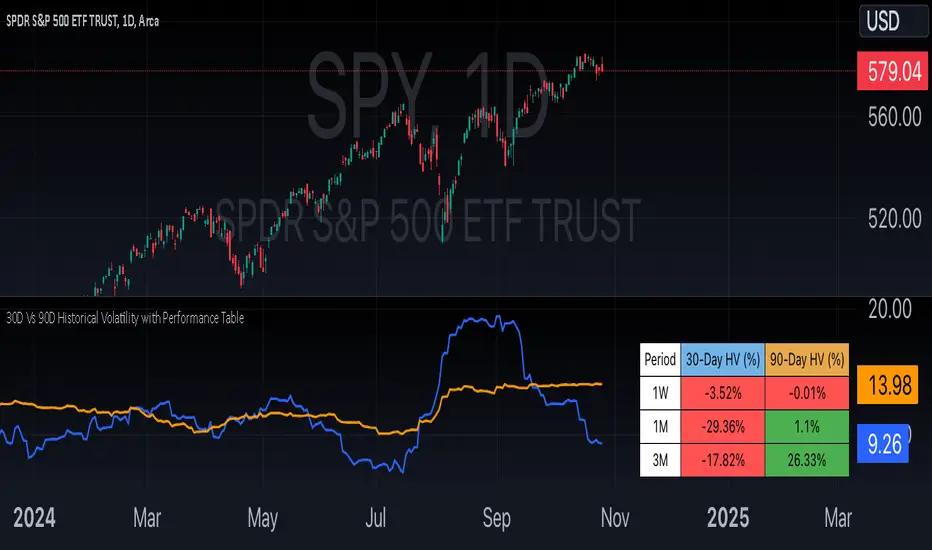
30D Vs 90D Historical VolatilityVolatility equals risk for an underlying asset's price meaning bullish volatility is bearish for prices while bearish volatility is bullish. This compares 30-Day Historical Volatility to 90-Day Historical Volatility.
When the 30-Day crosses under the 90-day, this is typically when asset prices enter a bullish trend.
Conversely, When the 30-Day crosses above the 90-Day, this is when asset prices enter a bearish trend.
Peaks in volatility are bullish divergences while troughs are bearish divergences.
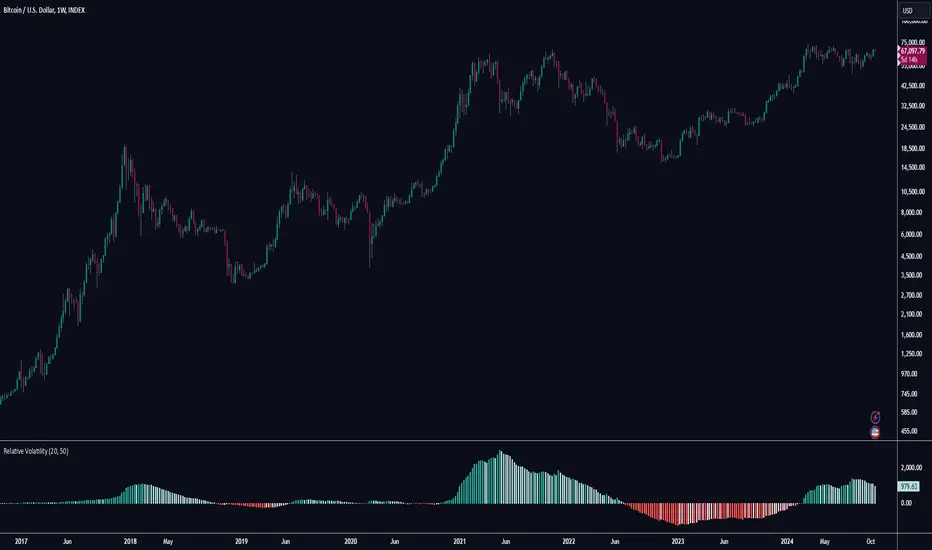
Relative VolatilityRelative Volatility is a technical indicator designed to assess changes in market volatility by comparing fast and slow Average True Range (ATR) values. It operates by subtracting a slower ATR (e.g., 50-period ATR) from a faster ATR (e.g., 20-period ATR) and visualizing the result as a histogram. This enables traders to determine whether volatility is increasing or decreasing over time.
This indicator can help traders recognize volatility trends, which can inform decisions related to trade entries, exits, and risk management.
Interpreting Volatility Changes
Increasing Volatility: When the histogram is above zero, it indicates that the fast ATR is greater than the slow ATR, signifying an increase in short-term volatility compared to the long-term average. This may suggest heightened market activity and potential trading opportunities.
Decreasing Volatility: When the histogram is below zero, it shows that the fast ATR is less than the slow ATR, indicating a decrease in short-term volatility relative to the long-term average. This may suggest consolidating markets or reduced trading activity.
Relative Volatility assists traders in monitoring and analyzing changes in market volatility, providing insights that can enhance trading strategies and decision-making processes.
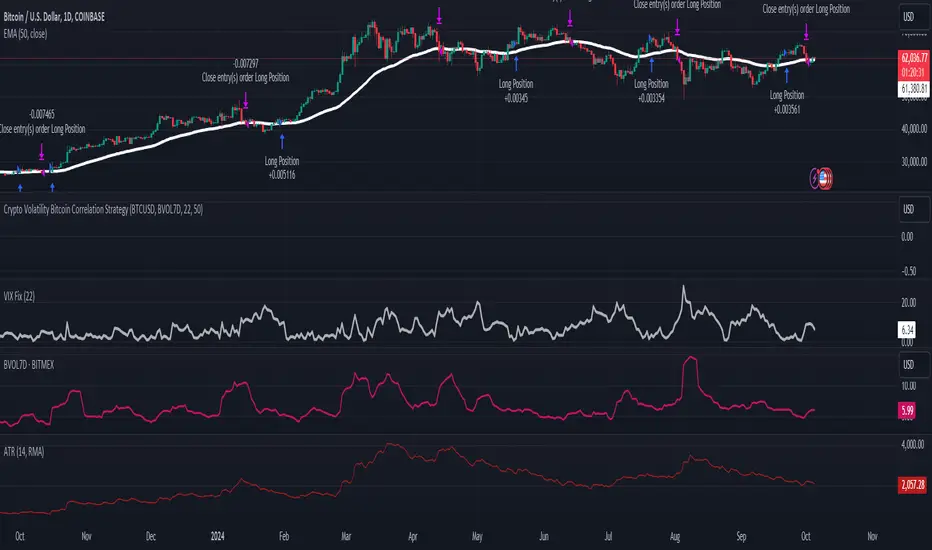
Crypto Volatility Bitcoin Correlation Strategy Description:
The Crypto Volatility Bitcoin Correlation Strategy is designed to leverage market volatility specifically in Bitcoin (BTC) using a combination of volatility indicators and trend-following techniques. This strategy utilizes the VIXFix (a volatility indicator adapted for crypto markets) and the BVOL7D (Bitcoin 7-Day Volatility Index from BitMEX) to identify periods of high volatility, while confirming trends with the Exponential Moving Average (EMA). These components work together to offer a comprehensive system that traders can use to enter positions when volatility and trends are aligned in their favor.
Key Features:
VIXFix (Volatility Index for Crypto Markets): This indicator measures the highest price of Bitcoin over a set period and compares it with the current low price to gauge market volatility. A rise in VIXFix indicates increasing market volatility, signaling that large price movements could occur.
BVOL7D (Bitcoin 7-Day Volatility Index): This volatility index, provided by BitMEX, measures the volatility of Bitcoin over the past 7 days. It helps traders monitor the recent volatility trend in the market, particularly useful when making short-term trading decisions.
Exponential Moving Average (EMA): The 50-period EMA acts as a trend indicator. When the price is above the EMA, it suggests the market is in an uptrend, and when the price is below the EMA, it suggests a downtrend.
How It Works:
Long Entry: A long position is triggered when both the VIXFix and BVOL7D indicators are rising, signaling increased volatility, and the price is above the 50-period EMA, confirming that the market is trending upward.
Exit: The strategy exits the position when the price crosses below the 50-period EMA, which signals a potential weakening of the uptrend and a decrease in volatility.
This strategy ensures that traders only enter positions when the volatility aligns with a clear trend, minimizing the risk of entering trades during periods of market uncertainty.
Testing and Timeframe:
This strategy has been tested on Bitcoin using the daily timeframe, which provides a longer-term perspective on market trends and volatility. However, users can adjust the timeframe according to their trading preferences. It is crucial to note that this strategy does not include comprehensive risk management, aside from the exit condition when the price crosses below the EMA. Users are strongly advised to implement their own risk management techniques, such as setting appropriate stop-loss levels, to safeguard their positions during high volatility periods.
Utility:
The Crypto Volatility Bitcoin Correlation Strategy is particularly well-suited for traders who aim to capitalize on the high volatility often seen in the Bitcoin market. By combining volatility measurements (VIXFix and BVOL7D) with a trend-following mechanism (EMA), this strategy helps identify optimal moments for entering and exiting trades. This approach ensures that traders participate in potentially profitable market moves while minimizing exposure during times of uncertainty.
Use Cases:
Volatility-Based Entries: Traders looking to take advantage of market volatility spikes will find this strategy useful for timing entry points during market swings.
Trend Confirmation: By using the EMA as a confirmation tool, traders can avoid entering trades that go against the trend, which can result in significant losses during volatile market conditions.
Risk Management: While the strategy exits when price falls below the EMA, it is important to recognize that this is not a full risk management system. Traders should use caution and integrate additional risk measures, such as stop-losses and position sizing, to better manage potential losses.
How to Use:
Step 1: Monitor the VIXFix and BVOL7D indicators. When both are rising and the Bitcoin price is above the EMA, the strategy will trigger a long entry, indicating that the market is experiencing increased volatility with a confirmed uptrend.
Step 2: Exit the position when the price drops below the 50-period EMA, signaling that the trend may be reversing or weakening, reducing the likelihood of continued upward price movement.
This strategy is open-source and is intended to help traders navigate volatile market conditions, particularly in Bitcoin, using proven indicators for volatility and trend confirmation.
Risk Disclaimer:
This strategy has been tested on the daily timeframe of Bitcoin, but users should be aware that it does not include built-in risk management except for the below-EMA exit condition. Users should be extremely cautious when using this strategy and are encouraged to implement their own risk management, such as using stop-losses, position sizing, and setting appropriate limits. Trading involves significant risk, and this strategy does not guarantee profits or prevent losses. Past performance is not indicative of future results. Always test any strategy in a demo environment before applying it to live markets.
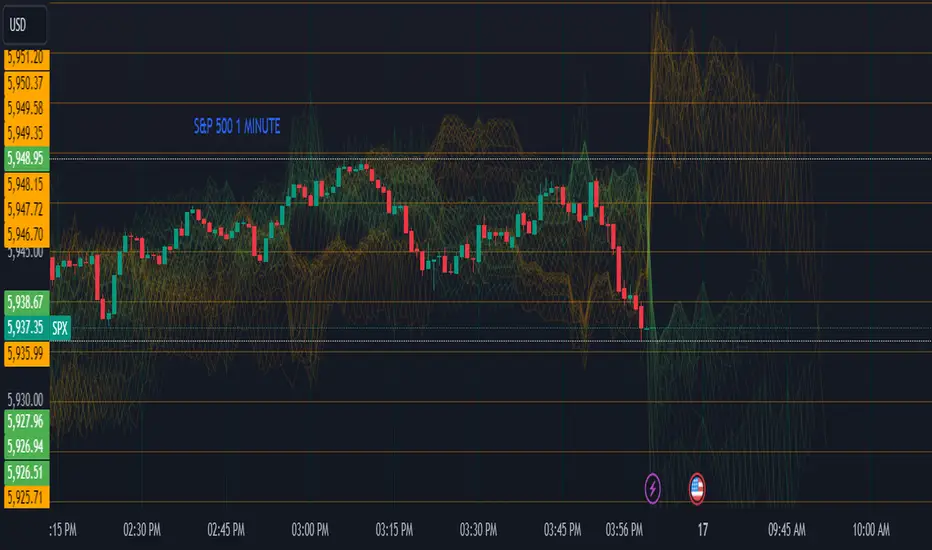
Probability GoldThis is a leading indicator designed for the 1 minute chart, and while it works on any time frame, I haven't tested it's practicality outside of the 1 minute chart. This uses historical data and applies statistical analysis to key metrics of momentum. The data is filtered by "time of day" as well as "day of week", but be mindful that the "day of week" option reduces your total amount of data points, and will not work well on new stocks. This indicator also uses binary/gaussian distribution concepts to create channels and pockets which act as seemingly magnetic forces. This is all speculative. Do not use this indicator on its own. This is intended to do nothing more than to show you whether if, on average, the historical data under the same time and rate of change conditions, goes for or against your trade. Use it in conjunction with your most trusted and classic indicators. This can act as a small nudge, letting you now the chances of what you have already established in your mind. This is HIGHLY experimental, made by an amateur, and also very pretty. So, enjoy!
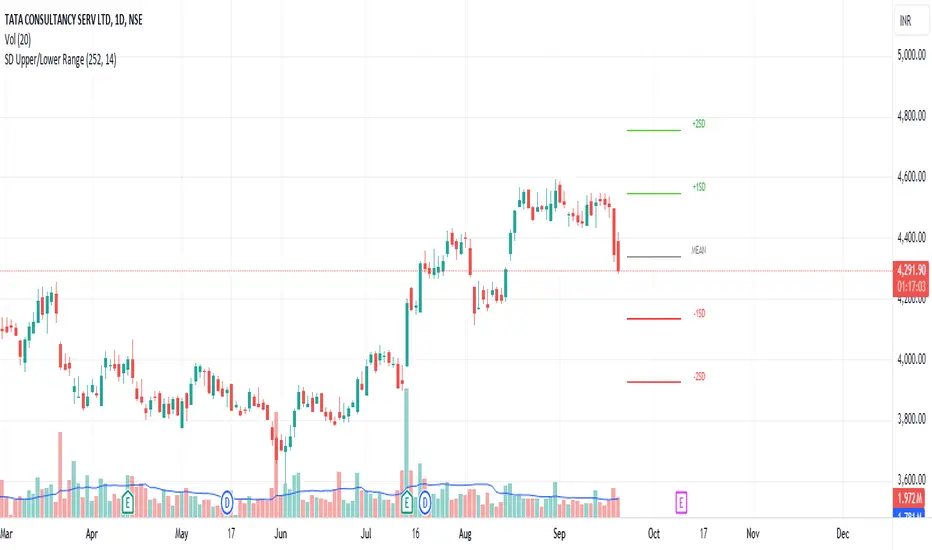
Standard Deviation based Upper Lower RangeThis script makes use of historical data for finding the standard deviation on daily returns. Based on the mean and standard deviation, the upper and lower range for the stock is shown upto 2x standard deviation. These bounds can be treated as volatility range for the next n trading sessions. This volatility is based on historical data. Users can change the lookback historical period, and can also set the time period (days) for upcoming trading sessions.
This indicator can be useful in determining stoploss and target levels along with the traditional support/resistance levels. It can also be useful in option trading where one needs to determine a range beyond which it is safe to sell an option.
A range of 1 SD has around 65% to 68% probability that it will not be breached. A range of 2 SD has around 95% probability that it will not be breached.
The indicator is based on Normal distribution theory. In future editions, I envision to also calculate the skewness and kurtosis so that we can determine if a stock is properly following Normal Distribution theory. That may further favor the calculated range.
Multi-Step Vegas SuperTrend - strategy [presentTrading]Long time no see! I am back : ) Please allow me to gain some warm-up.
█ Introduction and How it is Different
The "Vegas SuperTrend Strategy" is an enhanced trading strategy that leverages both the Vegas Channel and SuperTrend indicators to generate buy and sell signals.
What sets this strategy apart from others is its dynamic adjustment to market volatility and its multi-step take profit mechanism. Unlike traditional single-step profit-taking approaches, this strategy allows traders to systematically scale out of positions at predefined profit levels, thereby optimizing their risk-reward ratio and maximizing potential gains.
BTCUSD 6hr performance
█ Strategy, How it Works: Detailed Explanation
The Vegas SuperTrend Strategy combines the strengths of the Vegas Channel and SuperTrend indicators to identify market trends and generate trade signals. The following subsections delve into the details of how each component works and how they are integrated.
🔶 Vegas Channel Calculation
The Vegas Channel is based on a simple moving average (SMA) and the standard deviation (STD) of the closing prices over a specified period. The channel is defined by upper and lower bounds that are dynamically adjusted based on market volatility.
Simple Moving Average (SMA):
SMA_vegas = (1/N) * Σ(Close_i) for i = 0 to N-1
where N is the length of the Vegas Window.
Standard Deviation (STD):
STD_vegas = sqrt((1/N) * Σ(Close_i - SMA_vegas)^2) for i = 0 to N-1
Vegas Channel Upper and Lower Bounds:
VegasChannelUpper = SMA_vegas + STD_vegas
VegasChannelLower = SMA_vegas - STD_vegas
The details are here:
🔶 Trend Detection and Trade Signals
The strategy determines the current market trend based on the closing price relative to the SuperTrend bounds:
Market Trend:
MarketTrend = 1 if Close > SuperTrendPrevLower
-1 if Close < SuperTrendPrevUpper
Previous Trend otherwise
Trade signals are generated when there is a shift in the market trend:
Bullish Signal: When the market trend shifts from -1 to 1.
Bearish Signal: When the market trend shifts from 1 to -1.
🔶 Multi-Step Take Profit Mechanism
The strategy incorporates a multi-step take profit mechanism that allows for partial exits at predefined profit levels. This helps in locking in profits gradually and reducing exposure to market reversals.
Take Profit Levels:
The take profit levels are calculated as percentages of the entry price:
TakeProfitLevel_i = EntryPrice * (1 + TakeProfitPercent_i/100) for long positions
TakeProfitLevel_i = EntryPrice * (1 - TakeProfitPercent_i/100) for short positions
Multi-steps take profit local picture:
█ Trade Direction
The trade direction can be customized based on the user's preference:
Long: The strategy only takes long positions.
Short: The strategy only takes short positions.
Both: The strategy can take both long and short positions based on the market trend.
█ Usage
To use the Vegas SuperTrend Strategy, follow these steps:
Configure Input Settings:
- Set the ATR period, Vegas Window length, SuperTrend Multiplier, and Volatility Adjustment Factor.
- Choose the desired trade direction (Long, Short, Both).
- Enable or disable the take profit mechanism and set the take profit percentages and amounts for each step.
█ Default Settings
The default settings of the strategy are designed to provide a balanced approach to trading. Below is an explanation of each setting and its effect on the strategy's performance:
ATR Period (10): This setting determines the length of the ATR used in the SuperTrend calculation. A longer period smoothens the ATR, making the SuperTrend less sensitive to short-term volatility. A shorter period makes the SuperTrend more responsive to recent price movements.
Vegas Window Length (100): This setting defines the period for the Vegas Channel's moving average. A longer window provides a broader view of the market trend, while a shorter window makes the channel more responsive to recent price changes.
SuperTrend Multiplier (5): This base multiplier adjusts the sensitivity of the SuperTrend to the ATR. A higher multiplier makes the SuperTrend less sensitive, reducing the frequency of trade signals. A lower multiplier increases sensitivity, generating more signals.
Volatility Adjustment Factor (5): This factor dynamically adjusts the SuperTrend multiplier based on the width of the Vegas Channel. A higher factor increases the sensitivity of the SuperTrend to changes in market volatility, while a lower factor reduces it.
Take Profit Percentages (3.0%, 6.0%, 12.0%, 21.0%): These settings define the profit levels at which portions of the trade are exited. They help in locking in profits progressively as the trade moves in favor.
Take Profit Amounts (25%, 20%, 10%, 15%): These settings determine the percentage of the position to exit at each take profit level. They are distributed to ensure that significant portions of the trade are closed as the price reaches the set levels, reducing exposure to reversals.
Adjusting these settings can significantly impact the strategy's performance. For instance, increasing the ATR period or the SuperTrend multiplier can reduce the number of trades, potentially improving the win rate but also missing out on some profitable opportunities. Conversely, lowering these values can increase trade frequency, capturing more short-term movements but also increasing the risk of false signals.

Relative Measured Volatility [Seven Campbell]Relative Measured Volatility
Overview:
This indicator measures the current daily volatility of an asset and compares it to the average volatility observed over the past 15 days. It provides a dynamic gauge of how much the market’s volatility is deviating from its recent historical norms.
Key Features:
Dynamic Comparison: The indicator calculates the standard deviation of daily price changes over a user-defined period (default is 14 days) and compares it to a smoothed average of this volatility over the last 15 days. This creates a "moving measuring stick" to highlight periods of unusually high or low volatility.
Customizable Settings:
Lookback Period: Set to 15 days by default, this period defines the historical window used to calculate the average volatility.
Volatility Length: Adjustable length (default is 14) for the standard deviation calculation, allowing you to fine-tune the sensitivity of the volatility measurement.
Smoothing Length: Set to 50 by default, this parameter smooths the volatility data to highlight longer-term trends.
How It Works:
Volatility Calculation: The indicator computes the daily returns using the logarithmic change in closing prices. It then calculates the standard deviation of these returns over the specified volatility length.
Smoothing: The standard deviation values are smoothed using a simple moving average over the smoothing length, providing a clearer view of trends.
Relative Measurement: The current daily volatility is divided by the smoothed volatility, giving a relative value. A value above 1 indicates higher volatility than the average over the past 15 days, while a value below 1 suggests lower volatility.
Visual Representation:
Line Plot: The relative volatility is plotted as a line, allowing you to quickly see changes in volatility relative to the historical average.
Reference Line: A horizontal line at 1 is included for easy reference. Values above this line indicate periods of higher-than-average volatility, and values below suggest lower-than-average volatility.
Use Cases:
Market Sentiment Analysis: Identify periods of high or low volatility to gauge market sentiment.
Trade Timing: Use the indicator to decide on entry and exit points, especially in volatile or calm market conditions.
Risk Management: Monitor volatility to adjust position sizes and stop-loss levels dynamically.
Example Usage:
When the line rises above 1, it signals increasing volatility, which may be a good time to take profit or adjust your stop-loss orders.
When the line drops below 1, it indicates lower volatility, potentially highlighting a stable market period.

Historical Volatility (adjustable time period)Historical Volatility with Adjustable Time Period and Moving Average
This indicator calculates the historical volatility of an asset within a user-defined date range. Volatility is a measure of the dispersion of returns and is commonly used to assess the risk and potential price fluctuations of an asset.
How It Works
User-Defined Date Range: You can specify the start and end dates to focus on a particular period for volatility calculation. This is useful for analyzing specific historical events or trends within a defined timeframe.
Daily Returns Calculation: The script calculates the daily returns as the percentage change between the current close price and the previous close price. This percentage change is essential for determining the asset's volatility.
Volatility Calculation: The historical volatility is computed as the standard deviation of the daily returns over a specified period. The standard deviation is a statistical measure that quantifies the amount of variation or dispersion in a set of values.
Moving Average: An optional feature allows you to plot a moving average of the volatility. You can customize the type (SMA, EMA, WMA, VWMA) and the period of the moving average, helping to smooth out the volatility data and identify trends.
Indicator Settings
Start Date: Select the beginning date of the period for which you want to calculate volatility.
End Date: Select the end date of the period.
Period: Set the number of bars (days) over which to calculate the average volatility.
Show Moving Average: Toggle to display the moving average of the volatility.
Moving Average Period: Define the length of the moving average.
Moving Average Type: Choose the type of moving average: Simple (SMA), Exponential (EMA), Weighted (WMA), or Volume-Weighted (VWMA).
How to Use
Configure Date Range: Set the start and end dates to focus on the specific historical period you are interested in.
Adjust Period for Volatility Calculation: Select the period over which you want to calculate the average volatility. A shorter period will be more sensitive to recent price changes, while a longer period will provide a more smoothed view.
Enable and Configure Moving Average: If desired, enable the moving average and select the type and period that best fits your analysis style.
Example Use Cases
Market Analysis: Identify periods of high or low volatility to assess market conditions.
Risk Management: Use historical volatility to evaluate the risk associated with a particular asset.
Event Impact: Analyze how specific events within the selected date range affected the asset's volatility.
By providing these functionalities, this indicator is a valuable tool for traders looking to understand and analyze the volatility of assets over custom time periods with the flexibility of adding a moving average for trend analysis.

IV Rank Oscillator by dinvestorqShort Title: IVR OscSlg
Description:
The IV Rank Oscillator is a custom indicator designed to measure and visualize the Implied Volatility (IV) Rank using Historical Volatility (HV) as a proxy. This indicator helps traders determine whether the current volatility level is relatively high or low compared to its historical levels over a specified period.
Key Features :
Historical Volatility (HV) Calculation: Computes the historical volatility based on the standard deviation of logarithmic returns over a user-defined period.
IV Rank Calculation: Normalizes the current HV within the range of the highest and lowest HV values over the past 252 periods (approximately one year) to generate the IV Rank.
IV Rank Visualization: Plots the IV Rank, along with reference lines at 50 (midline), 80 (overbought), and 20 (oversold), making it easy to interpret the relative volatility levels.
Historical Volatility Plot: Optionally plots the Historical Volatility for additional reference.
Usage:
IV Rank : Use the IV Rank to assess the relative level of volatility. High IV Rank values (close to 100) indicate that the current volatility is high relative to its historical range, while low IV Rank values (close to 0) indicate low relative volatility.
Reference Lines: The overbought (80) and oversold (20) lines help identify extreme volatility conditions, aiding in trading decisions.
Example Use Case:
A trader can use the IV Rank Oscillator to identify potential entry and exit points based on the volatility conditions. For instance, a high IV Rank may suggest a period of high market uncertainty, which could be a signal for options traders to consider strategies like selling premium. Conversely, a low IV Rank might indicate a more stable market condition.
Parameters:
HV Calculation Length: Adjustable period length for the historical volatility calculation (default: 20 periods).
This indicator is a powerful tool for options traders, volatility analysts, and any market participant looking to gauge market conditions based on historical volatility patterns.

FOMO Alert (Miu)This indicator won't plot anything to the chart.
Please follow steps below to set your alarms based on price range variation:
1) Add indicator to the chart
2) Go to settings
3) Choose timeframe which will be used to calculate bars
4) Choose how many bars which will be used to calculate max and min range
5) Choose max and min range variation (%) to trigger alerts
5) Choose up to 6 different symbols to get alert notification
6) Once all is set go back to the chart and click on 3 dots to set alert in this indicator, rename your alert and confirm
7) You can remove indicator after alert is set and it'll keep working as expected
What does this indicator do?
This indicator will generate alerts based on following conditions:
- If min and max prices reach the range (%) from amount of bars on timeframe set for any symbol checked it will trigger an alert.
- If next set of bars reaches higher range than before it will trigger an alert with new data
- If next set of bars doesn't reach higher range than before it will not trigger alerts, even if they are above the range set (this is to prevent the alert to keep triggering with high frequency)
Once condition is met it will send an alert with the following information:
- Symbol name (e.g: BTC, ETH, LTC)
- Range achieved (e.g: 3,03%)
- Current symbol price and current bar direction (e.g: 63,477.1 ▲)
This script will request lowest and highest prices through request.security() built-in function from all different symbols within the range set. It also requests symbols' price (close) and amount of digits (mintick) for each symbol to send alerts with correct value.
This script was developed with main purpose to send alerts when there are strong price movements and I decided to share with community so anyone can set different parameters for different purposes.
Feel free to give feedbacks on comments section below.
Enjoy!
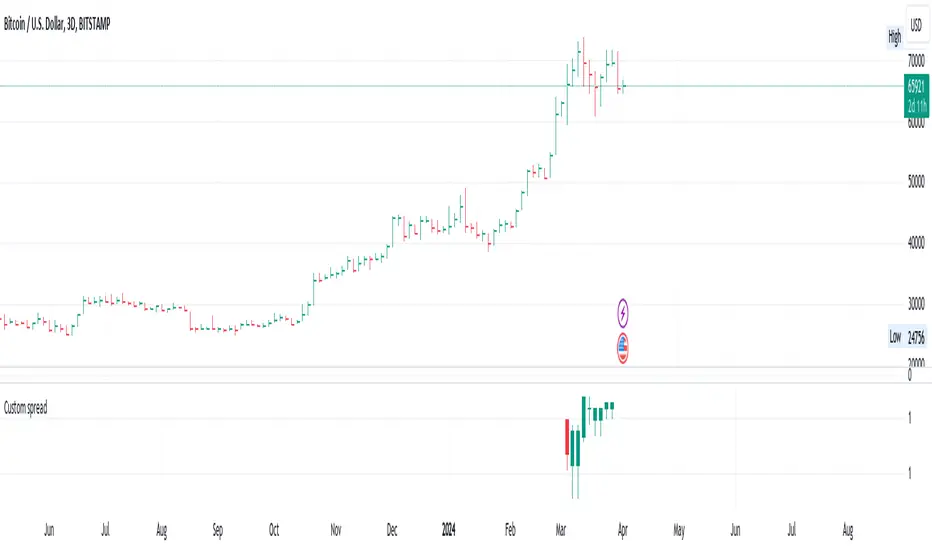
Custom spreadThis indictor allows you to plot the spread over an arbitrary period, which can be especially useful for futures and other instruments.
Inputs:
Expression : symbols for calculation and arithmetic operation
Period: from to period and timeframe
The output will show bars for the given period
Particularly useful for comparing two selected contracts on two futures
Realized volatility differentialAbout
This is a simple indicator that takes into account two types of realized volatility: Close-Close and High-Low (the latter is more useful for intraday trading).
The output of the indicator is two values / plots:
an average of High-Low volatility minus Close-Close volatility (10day period is used as a default)
the current value of the indicator
When the current value is:
lower / below the average, then it means that High-Low volatility should increase.
higher / above then obviously the opposite is true.
How to use it
It might be used as a timing tool for mean reversion strategies = when your primary strategy says a market is in mean reversion mode, you could use it as a signal for opening a position.
For example: let's say a security is in uptrend and approaching an important level (important to you).
If the current value is:
above the average, a short position can be opened, as High-Low volatility should decrease;
below the average, a trend should continue.
Intended securities
Futures contracts

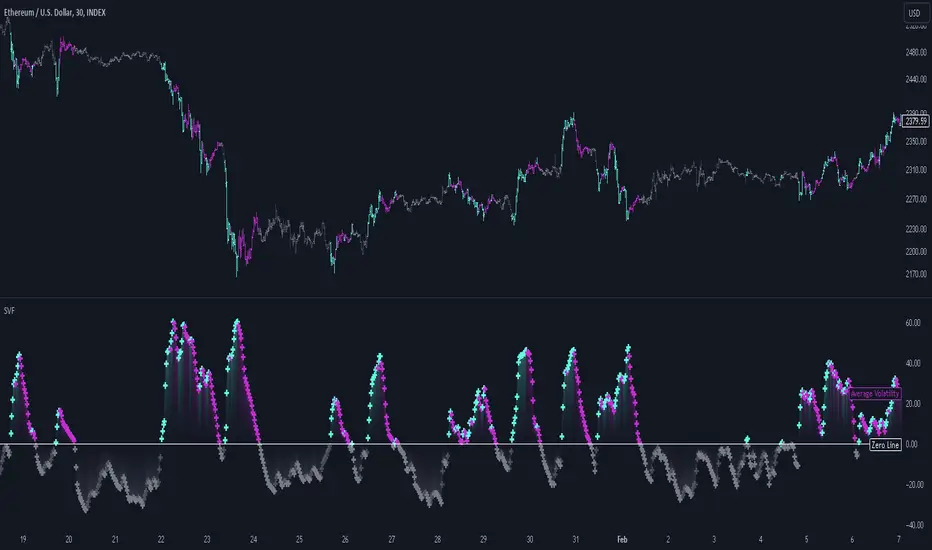
Scalper's Volatility Filter [QuantraSystems]Scalpers Volatility Filter
Introduction
The 𝒮𝒸𝒶𝓁𝓅𝑒𝓇'𝓈 𝒱𝑜𝓁𝒶𝓉𝒾𝓁𝒾𝓉𝓎 𝐹𝒾𝓁𝓉𝑒𝓇 (𝒮𝒱𝐹) is a sophisticated technical indicator, designed to increase the profitability of lower timeframe trading.
Due to the inherent decrease in the signal-to-noise ratio when trading on lower timeframes, it is critical to develop analysis methods to inform traders of the optimal market periods to trade - and more importantly, when you shouldn’t trade.
The 𝒮𝒱𝐹 uses a blend of volatility and momentum measurements, to signal the dominant market condition - trending or ranging.
Legend
The 𝒮𝒱𝐹 consists of a signal line that moves above and below a central zero line, serving as the indication of market regime.
When the signal line is positioned above zero, it indicates a period of elevated volatility. These periods are more profitable for trading, as an asset will experience larger price swings, and by design, trend-following indicators will give less false signals.
Conversely, when the signal line moves below zero, a low volatility or mean-reverting market regime dominates.
This distinction is critical for traders in order to align strategies with the prevailing market behaviors - leveraging trends in volatile markets and exercising caution or implementing mean-reversion systems in periods of lower volatility.
Case Study
Here we can see the indicator's unique edge in action.
Out of the four potential long entries seen on the chart - displayed via bar coloring, two would result in losses.
However, with the power of the 𝒮𝒱𝐹 a trader can effectively filter false signals by only entering momentum-trades when the signal line is above zero.
In this small sample of four trades, the 𝒮𝒱𝐹 increased the win rate from 50% to 100%
Methodology
The methodology behind the 𝒮𝒱𝐹 is based upon three components:
By calculating and contrasting two ATR’s, the immediate market momentum relative to the broader, established trend is calculated. The original method for this can be credited to the user @xinolia
A modified and smoothed ADX indicator is calculated to further assess the strength and sustainability of trends.
The ‘Linear Regression Dispersion’ measures price deviations from a fitted regression line, adding further confluence to the signals representation of market conditions.
Together, these components synthesize a robust, balanced view of market conditions, enabling traders to help align strategies with the prevailing market environment, in order to potentially increase expected value and win rates.
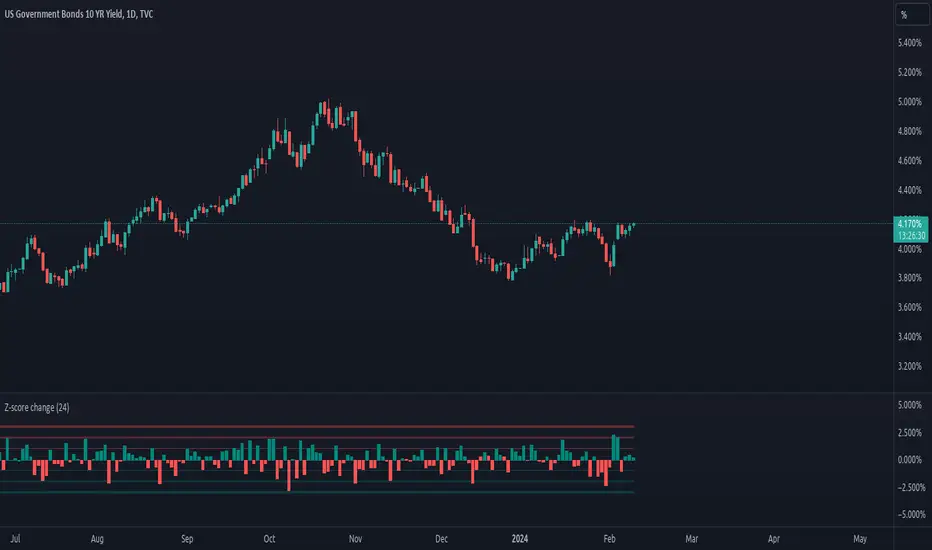
Z-score changeAs a wise man once said that:
1. beginners think in $ change
2. intermediates think in % change
3. pros think in Z change
Here is the "Z-score change" indicator that calculates up/down moves normalized by standard deviation (volatility) displayed as bar chart with 1,2 and 3 stdev levels.
GARCH Volatility Estimation - The Quant ScienceThe GARCH (Generalized Autoregressive Conditional Heteroskedasticity) model is a statistical model used to forecast the volatility of a financial asset. This model takes into account the fluctuations in volatility over time, recognizing that volatility can vary in a heteroskedastic (i.e., non-constant variance) manner and can be influenced by past events.
The general formula of the GARCH model is:
σ²(t) = ω + α * ε²(t-1) + β * σ²(t-1)
where:
σ²(t) is the conditional variance at time t (i.e., squared volatility)
ω is the constant term (intercept) representing the baseline level of volatility
α is the coefficient representing the impact of the squared lagged error term on the conditional variance
ε²(t-1) is the squared lagged error term at the previous time period
β is the coefficient representing the impact of the lagged conditional variance on the current conditional variance
In the context of financial forecasting, the GARCH model is used to estimate the future volatility of the asset.
HOW TO USE
This quantitative indicator is capable of estimating the probable future movements of volatility. When the GARCH increases in value, it means that the volatility of the asset will likely increase as well, and vice versa. The indicator displays the relationship of the GARCH (bright red) with the trend of historical volatility (dark red).
USER INTERFACE
Alpha: select the starting value of Alpha (default value is 0.10).
Beta: select the starting value of Beta (default value is 0.80).
Lenght: select the period for calculating values within the model such as EMA (Exponential Moving Average) and Historical Volatility (default set to 20).
Forecasting: select the forecasting period, the number of bars you want to visualize data ahead (default set to 30).
Design: customize the indicator with your preferred color and choose from different types of charts, managing the design settings.

VIX Dashboard [NariCapitalTrading]Overview
This VIX Dashboard is designed to provide traders with a quick visual reference into the current volatility and trend direction of the market as measured by CBOE VIX. It uses statistical measures and indicators including Rate of Change (ROC), Average True Range (ATR), and simple moving averages (SMA) to analyze the VIX.
Components
ATR Period : The ATR Period is used to calculate the Average True Range. The default period set is 24.
Trend Period : This period is used for the Simple Moving Average (SMA) to determine the trend direction. The default is set to 48.
Speed Up/Down Thresholds : These thresholds are used to determine significant increases or decreases in the VIX’s rate of change, signaling potential market volatility spikes or drops. These are customizable in the input section.
VIX Data : The script fetches the closing price of the VIX from a specified source (CBOE:VIX) with a 60-minute interval.
Rate of Change (ROC) : The ROC measures the percentage change in price from one period to the next. The script uses a default period of 20. The period can be customized in the input section.
VIX ATR : This is the Average True Range of the VIX, indicating the daily volatility level.
Trend Direction : Determined by comparing the VIX data with its SMA, indicating if the trend is up, down, or neutral. The trend direction can be customized in the input section.
Dashboard Display : The script creates a table on the chart that dynamically updates with the VIX ROC, ATR, trend direction, and speed.
Calculations
VIX ROC : Calculated as * 100
VIX ATR : ATR is calculated using the 'atrPeriod' and is a measure of volatility.
Trend Direction : Compared against the SMA over 'trendPeriod'.
Trader Interpretation
High ROC Value : Indicates increasing volatility, which could signal a market turn or increased uncertainty.
High ATR Value : Suggests high volatility, often seen in turbulent market conditions.
Trend Direction : Helps in understanding the overall market sentiment and trend.
Speed Indicators : “Mooning” suggests rapid increase in volatility, whereas “Cratering” indicates a rapid decrease.
The interpretation of these indicators should be combined with other market analysis tools for best results.

Bit Rocket - Grid Bot Transactions 1.0DESCRIPTION
A grid bot is an automated trading bot that is designed to execute buy and sell orders based on a pre-defined grid of prices. Grid bots operate within a specified price range, placing trades at set intervals above and below the current market price. The key idea behind a grid bot is to take advantage of price fluctuations and market volatility.
The Grid Bot Transactions Indicator serves as a valuable tool for identifying the most suitable trading pairs and optimizing the grid bot percentage, also known as the grid level configuration. This indicator assists in the selection of pairs that are likely to yield the best results and aids in determining the ideal configuration for grid bot trading.
USAGE
NUMBER OF TRANSACTIONS - will calculate the number of times the price moves up and down by the grid level percentage for a particular trading pair. Each move up and down is counted as a transaction, total transactions are then calculated from the date range set by the user.
RANGE - number represents the swing from the highest price to the lowest price during the date range set by the user, this will assist in determining what grid range could be used when configuring the grid bot.
GRID STEP (%) - This is the distance for each buy and sell set by the user, for example if the grid step % is set at 2% then for each 2% move up or down that occurs will count as one transaction. Try different grid step percentages to see what percentage produces the best results, too high and transactions will lower but profit per sell transaction will be greater, too small results in higher trading fees and lower profit per sell transaction. Using 1.5% - 5% for the grid step will make the most sense.
Armed with this knowledge the user can now compare against other pairs, determine the optimum grid level percentage, which pairs have more transactions, and determine transaction trend.
SETUP
When you first add the indicator to the chart you will see a pop-up reminding you to set the From Date Time for Bit Rocket Grid Bot Transactions 1.0, just click anywhere on the chart to add.
1. Change timeframe to 30m
2. Under Inputs – Grid Settings change the From Date & Time field
3. Under Inputs – Grid Settings change Size of Grid % or leave at default 2.5%
4. If grid and buy and sell symbols are in the way, go to ‘Style’ tab and turn off all the signals and Lines options.

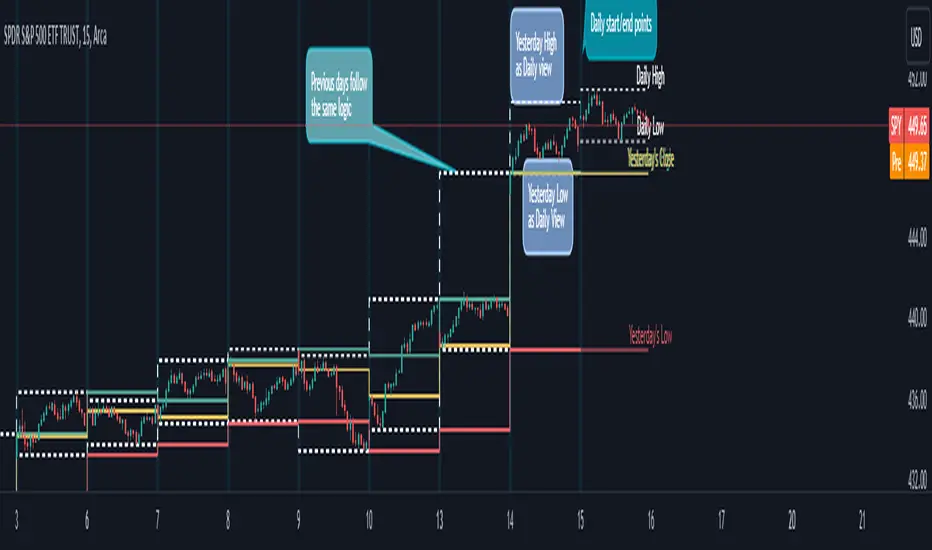
Market Pivot Levels [Past & Live]Market Levels provide a robust view of daily pivot points of markets such as high/low/close with both past and live values shown at the same time using the recently updated system of polylines of pinescript.
The main need for this script arose from not being able to use plots for daily points because plots are inherently once drawn can't be erased and because we can't plot stuff for previous bars after values are determined we can't use them reliably. And while we can use traditional lines, because we would have extremely high amount of lines and we would have to keep removing the previous ones it wouldn't be that effective way for us. So we try to do it with the new method of polylines .
Features of this script:
- Daily High/Low Points
- Yesterday High/Low/Close Points
- Pre-Market High-Low points.
Now let's preview some of the important points of code and see how we achieve this:
With the code below we make sure no matter which chart we are using we are getting the extended hours version of sessions so our calculations are made safely for viewing pre-market conditions.
// Let's get ticker extended no matter what the current chart is
tc = ticker.new(syminfo.prefix, syminfo.ticker, session.extended)
Coding our own function to calculate high's and low's because inbuilt pinescript function cannot take series and we send this function to retrieve our high's and lows.
// On the fly function to calculate daily highlows instead of tv inbuilt because tv's length cannot take series
f_highlow(int last) =>
bardiff = last
float _low = low, float _high = high
for i = bardiff to 0 by 1
if high > _high
_high := high
if low < _low
_low := low
With doing calculations at the bars of day ending points we can retrieve the correct points and values and push them for our polylines array so it can be used in best way possible.
// Daily change points
changeD = timeframe.change("D")
// When new day starts fill polyline arrays with previous day values for polylines to draw on chart
// We also update prevtime values with current ones after we pushed to the arrays
if changeD
f_arrFill(cpArrHigh, cpArrLow, prevArrh, prevArrl, prevArrc, prevMarh, prevMarl)
valHolder.unshift(valueHold.new(_high, _low, _high, _close, _low, time, pr_h, pr_l))
The rest of the code is annotated and commented. You can let me know in comments if you have any questions. Happy trading.
Monthly beta (5Y monthly) with multi-timeframe supportThe PROPER way to calculate beta for a stock using monthly price returns . None of this nonsense using daily returns and sliding windows as done by other scripts...
Works on any timeframe.
This script has been checked against 100s of stocks on Yahoo finance and Zacks research data and matches 100% (some rounding error as this script is kept updated live on unconfirmed monthly bars).
You can check for yourself:
Zacks fundamentals - beta
The script calculates beta using the Variance-Covariance Method as described on Investopedia
How to calculate Beta
