Bitcoin Implied VolatilityThis simple script collects data from FTX:BVOLUSD to plot BTC’s implied volatility as a standalone indicator instead of a chart.
Implied volatility is used to gauge future volatility and often used in options trading.
Историческая волатильность

SPY Expected Move by VIXThis indicator shows 1 and 2 standard deviation price move from the VWAP based on VIX. Implied Volatility (IV) is being used extensively in the Option world to project the Expected Move for the underlying instrument. VIX is used as a proxy for SPY's IV for 30 days.
This indicator is meaningful only for SPY but can be used in any other instrument which has a strong correlation to SPY.

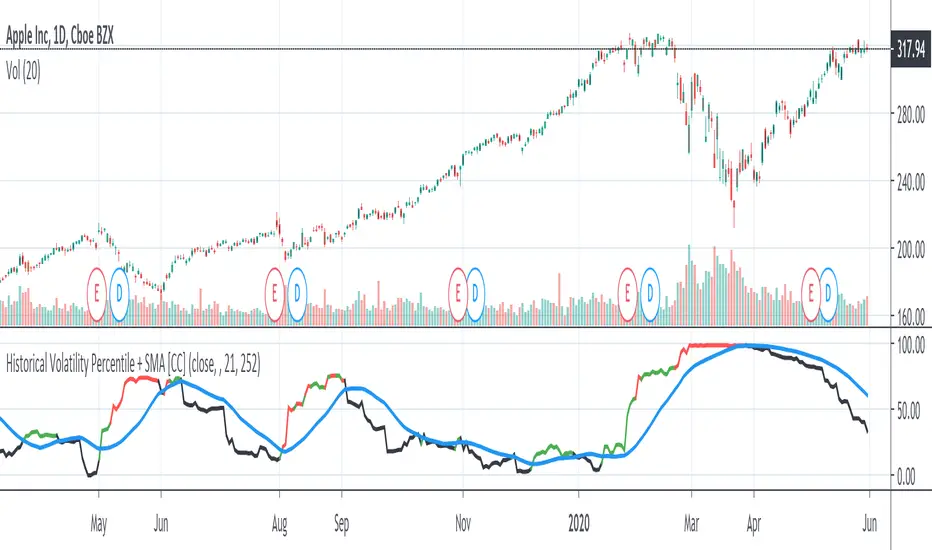
Historical Volatility Percentile + SMAHistorical Volatility Percentile tells you the percentage of the days from the past year (252 trading days) that have lower volatility than the current volatility.
I included a simple moving average as a signal line to show you how volatile the stock is at the moment.
I have included simple colors to let you know when to enter or exit a position.
Buy when price higher than EMA & historical volatility higher than SMA
Sell when price lower than EMA & historical volatility higher than SMA
Please let me know if you would like me to publish any other indicators! I always love to hear from you guys.
Volatility SkewThis indicator measure the historical skew of actual volatility for an individual security. It measure the volatility of up moves versus down moves over the period and gives a ratio. When the indicator is greater than one, it indicators that volatility is greater to the upside, when it is below 1 it indicates that volatility is skewed to the downside.
This is not comparable to the SKEW index, since that measures the implied volatility across option strikes, rather than using historical volatility.


Moving High & Low (2 Time Frames)===========
Moving High & Low (2 Time Frames)
===========
A simple line set indicator displaying the highs and lows of the previous selected timeframe upon a lower timeframe chart (2 line sets available).
e.g. Displaying the Highs & Lows of the last week and/or month on the 1D chart
-----------
Useful for 2 very different approaches to trading markets -
Finding Breakout Points:
For example - When candlestick closes above or below highs from previous week/month it may be a good time to go long as if the trend continues it may well go on for a long time making lots of pips along the way!
Finding SAR points within a range:
For example - When price starts ranging within horizontal line sets that aren't moving either way too much it may be a good idea to place long/short orders at appropriate key levels dictated by these range extremities, anticipating the price to reach these levels and deflect (Stop & Reverse) back the other way.
Either way we would recommend you NOT use this indicator alone, this is very much a confirmation tool or as an aid to find key levels of support/resistance.
Good Luck and Happy Trading!

Moving Average Adaptive FilterThe Moving Avg Adaptive Filter (MAAF) was authored by Perry Kaufman in the Stocks and Commodities Magazine 03/1998
This is a volatility based indicator so when this indicator goes up, sell in the direction of how that stock is going. In other words go short when it is rising and the stock price is below the ema or go long when it is rising and the stock price is above the ema. Lower volatility means it is trading sideways or the current price action is about to reverse.
Send me a message and let me know what other indicators you would like to see!

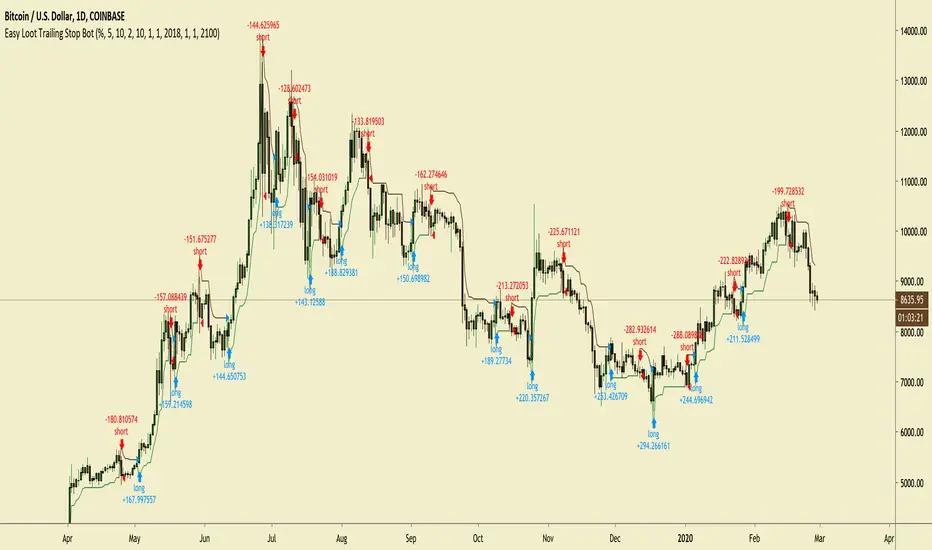
Easy Loot Trailing Stop Bot - (PSAR) StrategyHello World,
Today I am bringing you a Parabolic Stop and Reverse Strategy that uses a 5% trailing stop loss.
Tested the strategy on the 1D timeframe of Bitcoin from the time period starting from 2018 onwards.
As you may know the price in the start of 2018 for Bitcoin was around $11,000 meaning if you bought and HODL'd since then you'd be down a good %, as current price is $8650.
Below is the strategy testing results, up 844% profits in the last two years.
Easy Loot Members Only, contact me if you'd like access to the strategy.
Parabolic Stop and Reverse (PSAR) Strategy
Parabolic SAR is a time and price technical analysis tool primarily used to identify points of potential stops and reverses. In fact, the SAR in Parabolic SAR stands for "Stop and Reverse". The indicator's calculations create a parabola which is located below price during a Bullish Trend and above Price during a Bearish Trend.
Trailing Stop Loss
A trailing stop-loss order is a special type of trade order where the stop-loss price is not set at a single, absolute dollar amount, but instead is set at a certain percentage or a certain dollar amount below the market price.
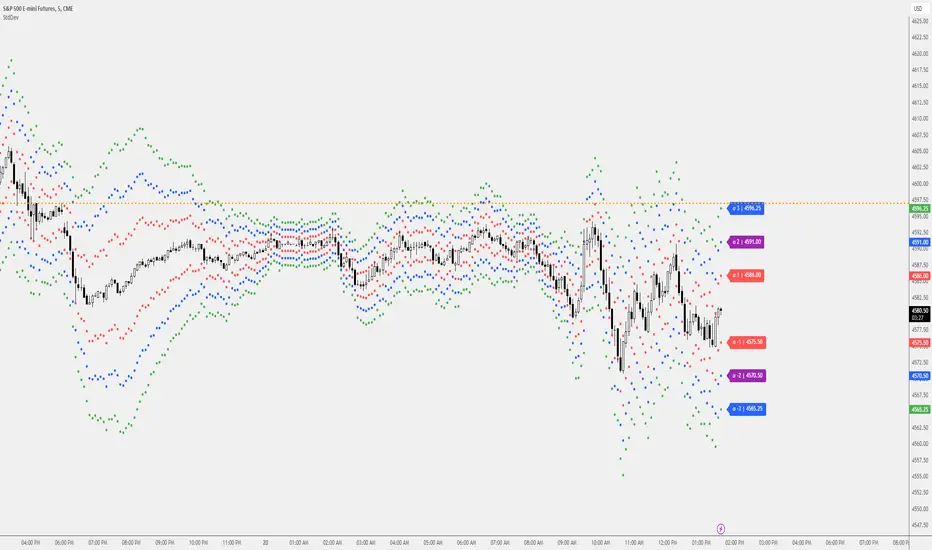
Standard Deviation Measurement ToolIf you like the script please come back and leave me a comment or find me on the interwebs. I get notified you "liked" it... but I have no idea if you actually use it. So, let me know =)
The script uses the open price as the mean and calculates the standard deviation from the open price on a per candle basis
- Goal: -
To establish a mean based on the Open Price and calculate the standard deviation.
The reason for this is if the Open is the mean, then the Standard deviation implies a standardized distance a given candle can be expected to travel
from the open price
- Edge: -
If you know that there is a 68%/95%/99.7% probability that price will NOT move more than
One Standard Deviation/Two Standard Deviations/Three Standard Deviations from the open price respectively
you can set reasonable price targets that relate to those probabilities in a given timeframe.
e.g. if you're on a 1h chart and your target is 3.5% from the open price, but 1 standard deviation of the hourly candle is equal to 0.78%.
You can make assumptions on either:
- The reasonableness of your target
or
- The holding period likely required for the trade.
Also, Standard Deviation is a function of volatility and this tool provides a unique mechanism for measuring volatility as well on a candle by candle basis
- Customization Options-
- Set 3 independent upper and lower standard deviations.
- Each set of standard deviations are on a switch so you can show 1, 2, or 3 sets of standard deviations
- You can set the distribution width
- Though it's not recommended, you can change the mean source.
- There is a switch to show the standard deviation on only the real-time bar or real-time and historical bars.
- How I Think About This Script -
This strategy is predicated the same principle as Bollinger Bands: the reality that 68% of all data points will fall within one standard deviation of the mean, 96% of all data points will fall within two standard deviations, and 98% of al data points will fall within 3 standard deviations. By understanding the standard deviation, you can possibly infer an edge by understanding the probabilistic range price will be bound to the limits of standard deviation rules according to their probabilistic outcomes for the single candle on any given timeframe. Bollinger Bands are designed to provide this information with the mean being a 20-period moving average and this indicator.
This indicator is designed to provide standard deviation information with the mean being based on the distance price travels away from the open of individual candles in the lookback period.
If you use a strategy where you enter on major candle closes, this can be useful to set targets for those entries based on the intended hold period or at least add/remove validity to other target metrics.
Example:
Your target is at the 1.618 Fibonacci level and your confirmation triggers on the 4h candle close (H4 if that's your thing lol). You set up the indicator based on the standard deviation of price movement in 4h candles over the last week.
Let's say the indicator shows that the 1.618 Fibonacci level is 3 standard deviations away.
This being the case this statistically indicates that within the next 4 hours, you have a very low probability of achieving your target (>2%). This doesn't invalidate your target, but it does indicate a low probability of achieving it in the next 4hrs. With this information, you can infer that you are either going to be (a) really lucky (b) in this trade for a lot longer than 4hrs or (c) your target is unrealistic given your intended hold period.
You can develop a more probabilistically favorable hold period calculation by looking at the standard deviation on a higher time frame (e.g. 1d-1w).
Bonus feature: You'll find that the 2 and 3 standard deviations will often "cluster" and these clusters often provide future S/R levels. That's a pretty sweet feature no one things to look for. But, try it. Find a cluster of 2nd and 3rd stdevs that are in somewhat of a horizontal pattern (usually the result of a range) and you'll find that to be a good s/r area. Even better if you use the 3.2 standard deviation, you'll find that is a fantastic breakout signal!
Summary
So, you can use it for target setting, a confluence test, a reasonableness test, or just a measurement tool.
This was the first TV script I ever wrong.. Got taken down. But, I've re-released it because there are other TV scripts that attempt to do this but are completely wrong.
Please be careful about using other people's scripts. Always validate the math of the script before you use it if possible.
Stay safe out there and I hope all your dreams come true.
Advanced ADR - PivotBossThis Script comes straight from PivotBoss Masterclass. Script calculates compression and expansion of prices. ADR is calulated for user defined period and it is compared over 10 period. If the prices goes over 125% of average ADRin the look back period then current price is over expanded and reversal is in the corner. When Prices falls below 65% of average ADR then prices are under compression. Then you should look to position yourself in the direction of the expansion.
Expansion leads to compression. Compression leads to Expansion
HistoGapScript calculates gaps from the previous candle close to the current candle open. The computation is displayed into an histogram.

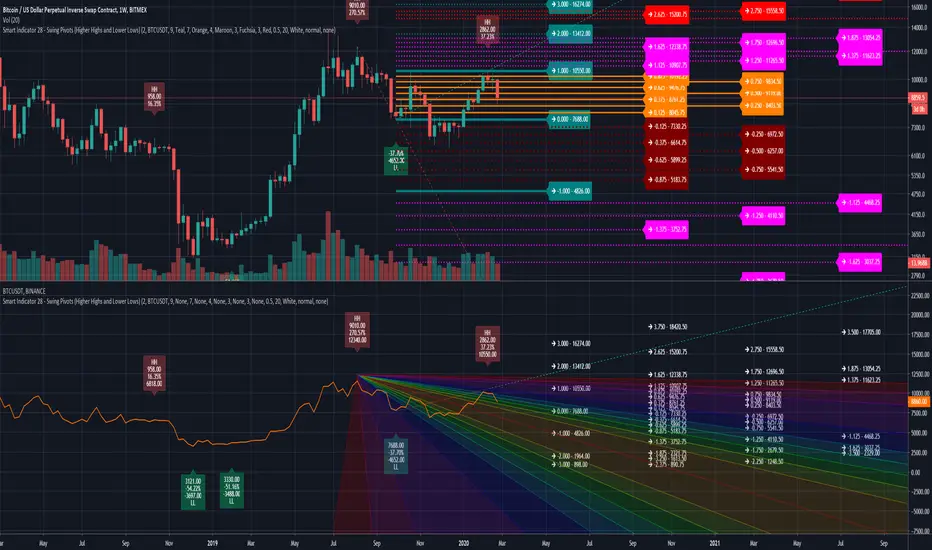
Smart Indicator 28 - Swing Pivots (Higher Highs and Lower Lows)A simple way to find Higher Highs and Lower Lows (HH and LL) whit automatic Fibonacci Lines in the most common levels.
In this indicator the Higher Highs only happens when a high value are rising from each other in the last "Length of Real Pivots" highs and the next same number of highs are falling in every single bar.
The Lower Lows are inverted, LL only appears if a low is falling in every single bar in the last number of length and the lows price of the "n" bars next are rising.
You can use this Indicator in any kind of market.
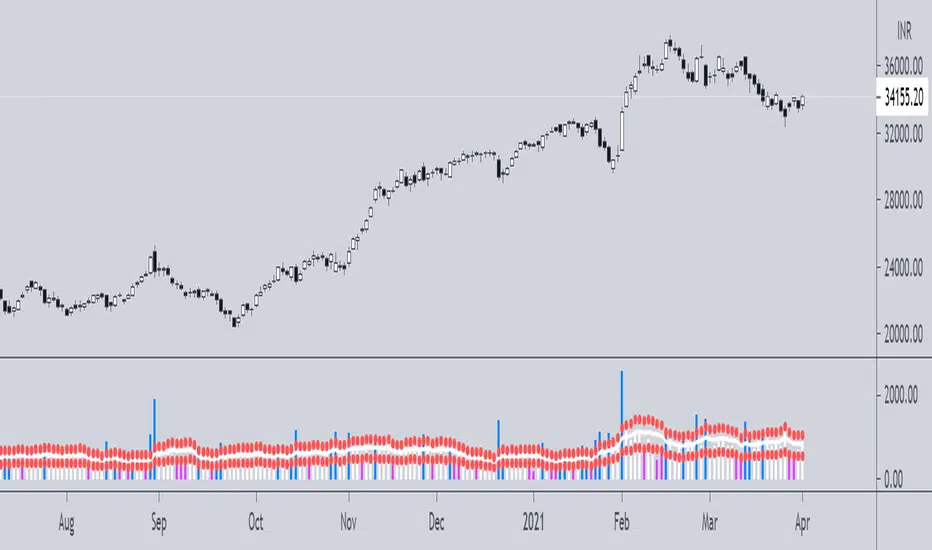
Borjas Tarh Explosive PivotsBorjas Tarh Explosive Pivots
This indicator includes:
1. Historical Volatility Percentile ( HVP ) +SMA+EMA
Core Idea (balipour) :
HVP Code Help (semiotic) : www.tradingview.com
For the Detailed Description read the Core (HVP) Idea indicator by "balipour" above.
2. Bollinger Bands Width ( BBW )
It's an Oscillation of BBW So it's trapped between 0 to 100. (And Lightly Smoothed)
3. Volume Oscillator
The Volume is oscillated so it's trapped between 0 and -30. (And Lightly Smoothed)
Below 10 Means the Volume in the context of the Candle Volume is pretty low.
4. The Shapes
These Shapes are based of all factors above.
D ( Blue ) : HVP is pretty Low. An Explosive Move is Coming.
A ( Yellow ) : An Explosive Move is Building Up.
B ( Orange ) : An Explosive Move is Near.
C ( Purple ) : An Explosive Move Will Happen Very Soon.
There is an Alternative Set:
On = Annual HVP and Default BBW .
Off = Fibonacci HVP and BBW .
© mrhashem
© Borjas Tarh Company

Semi Variance signals - KentDO ModelThe indicator generated by measuring the difference in yield volatility in two directions up and down, is called a Semi-measure of risk. A change in the sign of the difference between two halves of volatility produces a buy and sell signal.
The indicator can customize the number of observations.
The indicator adds reference Pivot Point level points for a larger time frame. Can edit the number of decimals, so suitable for Indices, Curencies, Futures, Crypto, Bonds

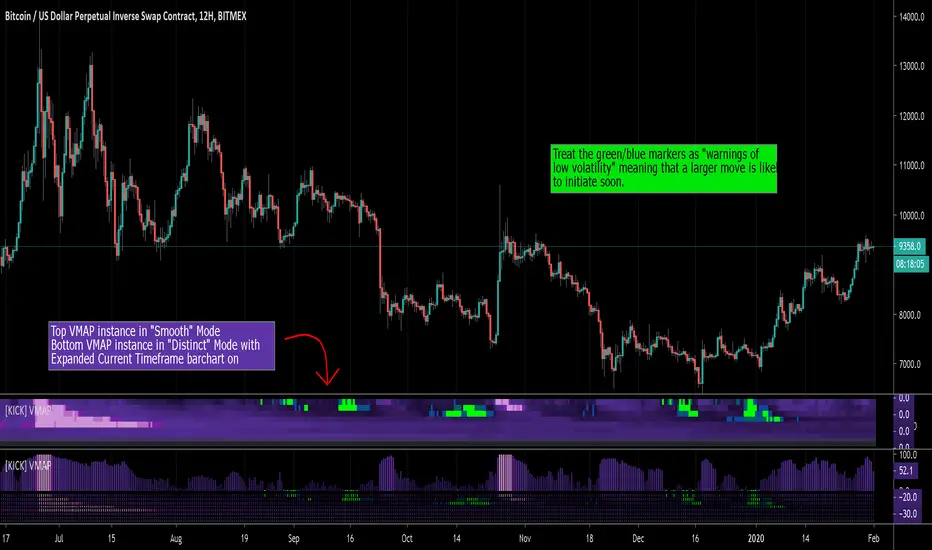
[KICK] Volatility HeatmapWith this indicator you can gauge the price volatility of an instrument across multiple timeframes in a very compact visualization. It allows you to find critically low areas of volatility and predict the likelihood of an imminent move or the conclusion of a move. While you can do this with other indicators, it is often easy to miss low volatility on timeframes that you don't normally survey.
Features:
Measure volatility using either Average True Range Percentile Rank (ATR-PR) or Historical Volatility Percentile (HVP)
Measure volatility from any other source (e.g. Volume, or custom series from another indicator) using HVP
2 Rendering Modes (Smooth and Distinct) as seen in the sample chart above
Ability to show current timeframe Volatility in bar chart above the heatmap
Get alerts when a certain number of timeframe levels (configurable) are showing critically low volatility (implying imminent move)
Get an alert when the current timeframe volatility level emerges from a critically low volatility zone (usually indicating the start of a significant move)
The bands on the map are 1x, 2x, 3x, 5x, 8x, 13x, 21x, and 34x the curent timeframe. The volatility measurements go (from lowest to highest): Lime, Blue, Dark Purple -> Light Purple (gradient), Magenta, Pink. If you see grey blocks/bands, these indicate that the instrument you are using does not have enough historical data to determine the volatility based on your timeframe and reference period. For example, if you are using a reference period of 100 and are on the daily view, to render the bottom-most band (x34) you would need around 3400 days of data (over 9 years).
You can use this indicator in multiple ways. My favorite way personally is to look for areas that have multiple consecutive timeframes showing low volatility warnings and then enter when the highest of those timeframes turns back to purple. Use other methods, analysis, or indicators to determine direction (or just straddle P.A. with market stops). If I am scalping, then I will generally mostly watch the "current timeframe" and get alerts when it emerges from low volatility.
Use the link below to watch a tutorial video, request a trial, or purchase for access.
Volatility Index (Expo)Volatility Index (Expo)
DESCRIPTION
Volatility can be referred to many things, but a commonly accepted definition of volatility is that it’s a measure of the risk or uncertainty in the market. Higher volatility is equal to more risk in the market. A simple way of describing it is that when volatility is high, the value of the market can be spread out over a larger range of values. This means that the price of the market can change dramatically over a short time period in either direction. A lower volatility means that a market's value does not fluctuate dramatically, and tends to be steadier. However, how to calculate and to apply volatility has been widely debated and many different calculations have been used. Volatility Index is a must for a professional trader in today's volatile markets.
This Volatility Index is derived from research within Volatility.
HOW TO USE
1. Use the indicator to detect low- respectively high volatility.
2. Enter the market when the volatility is low, and exit the market when the volatility is high.
3. Use the indicator to identify when the volatility peaks. Can indicate that the market will shift or can be good areas to take profits.
Trend
When the market is in a positive trend, the volatility is low and stable. The opposite happens when the market is in a negative trend, the volatility is high and price moves boldly.
As a rule ,when volatility increases unusually(abnormal) in relation to previous periods something is happening in the market, then wait until the volatility peaks or when the indicator does not make any new highs (the indicator becomes flat), and in conjunction with that the trending price action doesn’t make any new lows or respectively highs. When this happens there is a high probability that the market will take a temporary turn.
Positive volatility refers to when the volatility index increases with green candlesticks this means that the buyers are more aggressive than sellers. (Can indicate a trend change)
Negative volatility refers to when the volatility index increases with red candlesticks this means that the sellers are more aggressive than buyers. (Can indicate a trend change)
INDICATOR IN ACTION
This indicator is best presented live, the graphs below gives a hint of how the Volatility Index works.
The indicator works on any market, security, currency, stock, etc. and on any timeframe.
BTCUSD
EURUSD
WALL STREET
I hope you find this indicator useful , and please comment or contact me if you like the script or have any questions/suggestions for future improvements. Thanks!
I will continue to work on this indicator, so please share your experience and feedback with me so that I can continuously improve it. Thanks to everyone that have contacted me regarding my scripts. Your feedback is valuable for future developments!
ACCESS THE INDICATOR
• Contact me on TradingView or use the links below
-----------------
Disclaimer
Copyright by Zeiierman.
The information contained in my scripts/indicators/ideas does not constitute financial advice or a solicitation to buy or sell any securities of any type. I will not accept liability for any loss or damage, including without limitation any loss of profit, which may arise directly or indirectly from use of or reliance on such information.
All investments involve risk, and the past performance of a security, industry, sector, market, financial product, trading strategy, or individual’s trading does not guarantee future results or returns. Investors are fully responsible for any investment decisions they make. Such decisions should be based solely on an evaluation of their financial circumstances, investment objectives, risk tolerance, and liquidity needs.
My scripts/indicators/ideas are only for educational purposes!

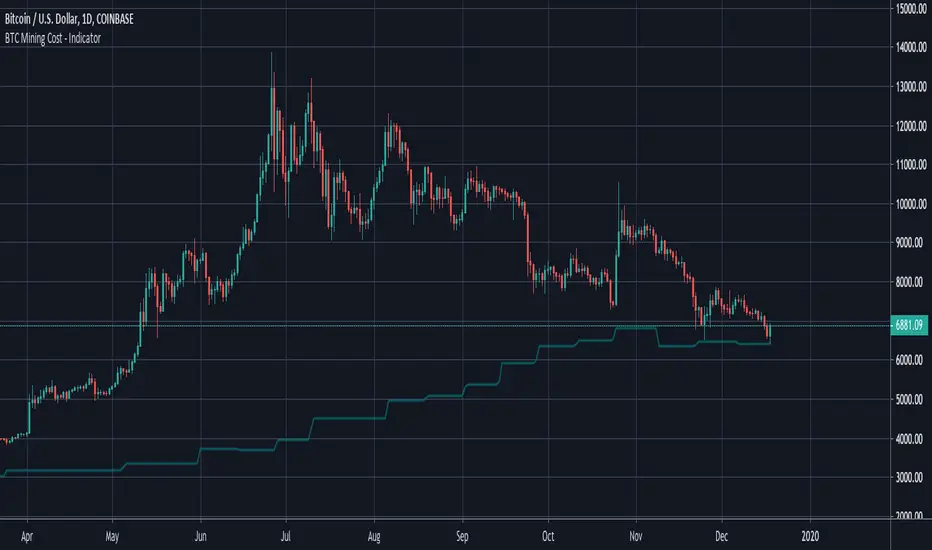
BTC Mining Cost - IndicatorBTC Mining Cost Indicator
- Adjust the Emission Rate after each halving, currently it's 12.5
- Current settings are for the Antminer S17 with an average cost of 12 cents per kWh
As you can see, a bounce usually follows when the price hits the cost of mining 1 BTC .
I would love to hear your feedback, and if you like it please gimme a thumbs up ❤️
Happy Trading!
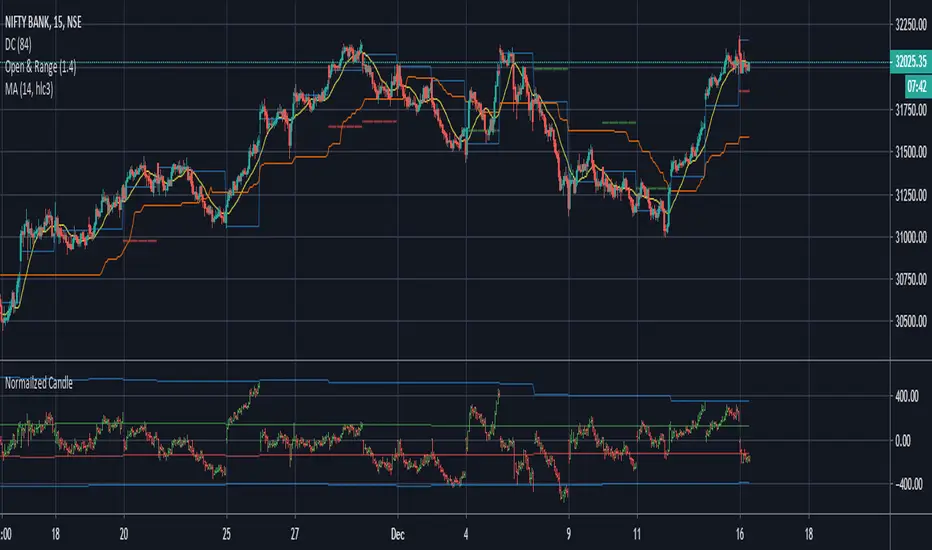
Normailzed CandleThis indicator normalizes Day's candle with Open. Idea is to see the daily movement in the context of the Open of the Day.
Larry Williams talks about Open being the most important price of the day. Hence, this indicator.
The Green line is average Open-to-High for occurrences of Red days. The Red line is average Open-to-Low for occurrences of Green days.
Average are not perfect calculations since occurrences(of Red or Green) will vary within the time-span used for averages.
These can used to gauge likelihood of the intra-day price reversal. If the price exceeds green/red line, there is higher likelihood of the price closing above/below open.
The blue lines are average Open-to-close for Green and Red occurrences.
Be careful on days where consecutive 3rd Highest High or Lowest Low day is made and also on the next day after such day. Prices may turn direction at least for a short while.
The precursor to this script of the Candle Infopanel script. That script was just numbers in panel and this is a graphical representation. I
Some of the calculations from original script are commented here because it would make visuals clutters (and probably the left-out calculation are not critical to making trade decisions!)
Candle Information Panel//This indicator shows Day's candle measurements with past averages. First column shows the candle details for the present day.
//"Open - Low", "High - Open", "Range(=High-low)", "Body(open-close)"
//Averages are calculated for occurences of Green and Red days. Up Averages are for Green days and Down Averages are for Red days.
//Average are not perfect calculations since occurences(of Red or Green) will vary within the timespan used for averages.
//This can used to guage general sense of probability of the price movement.
//e.g. if the Open to Low for a day exceeds UpAv value, then there is higher likelihood of day being Red.
//similarly, trade can be held in expectation of price reaching the DnAv and stop loss can be trailed accordingly.
//Not a perfect system. But something to work on further to increase price action understanding.
//Be careful on days where consecutive 3rd Highest High or Lowest Low day is made and also on the next day after such day. Prices may turn direction at least for a short while.
Complete Credit goes to @pinecoders who gave me the main script on tradingview chat room.

Breakout Notifier LONG NEW with wicksBreakout script with few changes that considers wick to close trades instead of using candle body like in the previous version

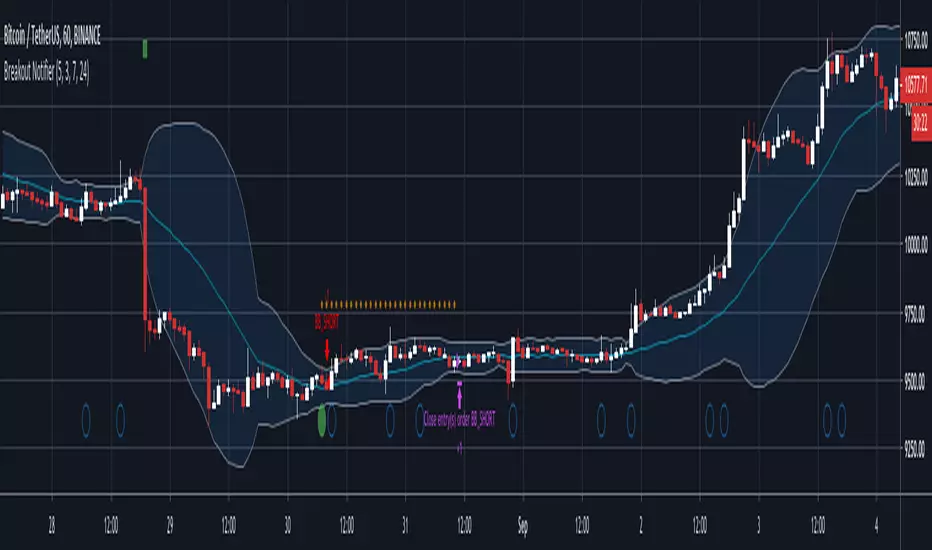
Breakout Notifier SHORT With wicksBreakout notifier with modifed version to close on wicks instead of candle body
ATR (Average True Range) By TimeWhat is ATR By Time?
This premium indicator was inspired by my RVOL By Time indicator . It works on Stocks, Forex, Crypto and most Futures markets. Instead of calculating the ATR by recent price data, it calculates an ATR value for each candle based on that candle’s time of day.
For example, if you set the Lookback setting on this indicator to 14, then instead of calculating the ATR based on the past 14 candles, it will calculate an ATR value based on the past 14 trading sessions for each candle.
This is extremely useful for day traders in particular as it allows you to gauge the average range of candles during certain times of day instead of only by the most recent price action.
It also draws a regular ATR (optional) – so this is essentially an enhanced ATR script that gives you multiple readings on price volatility.
If you are interested, you can purchase access to the script or register for a free trial on my website: ATR By Time Feature Page .
Why Does It Cost Money?
The reason why this is a premium script that requires payment to access is because it took a lot of time, research and development in order to create. The other advantage of charging for it is that it retains exclusivity to only a select few dedicated traders.
By paying the yearly fee you get access to ALL of my premium indicators including lifetime updates and technical support.
If you don’t want to pay for this script then I completely understand and I have plenty of other free indicators and scripts that you might be interested in!
Free Trial
I am a trader myself and so I know how skeptical you might be that this indicator is worth your time and money. That is why I am offering a free trial of this indicator.
All you need to do to initiate your trial is Join My Mailing List/ on my website: zenandtheartoftrading.com
How It Works
This script uses a complex formula to calculate ATR values across distant historical bars.
Depending on the timeframe you select it will skip through historical bars to find previous bars from the same time of day. It collects these values then applies the traditional ATR formula to them.
The ATR value is determined by the maximum result of the following three calculations:
- Current high minus the current low
- The absolute value of the current high minus the previous close
- The absolute value of the current low minus the previous close
- Whichever of these three calculations comes out highest, that is your ATR for the given candle.
Once this value is calculated for historical bars the ATR indicator’s reading is typically determined by a 14-period moving average of these individual ATR values. So the ATR reading you see on your screen is an average of the past 14 ATR values.
This means that as markets expand and contract this volatility reading will adapt to the change in candle price ranges.
The difference with the ATR By Time indicator’s calculation formula is that rather than referencing recent bars it references bars based on their time of day.
For example, if you are on the 1-Hour chart and you check the ATR By Time value at 9:00AM with a Lookback period of 14, then the value you see will be the result of the ATR calculation of every 9:00AM 1-Hour candle over the past 14 trading sessions.
You can also choose to enable the ATR moving average in the settings menu if you wish. This will give you a smoothed ATR reading by averaging the current session’s ATR value with previous sessions.
This versatility gives you a sophisticated reading on price volatility which is particularly helpful for day trade setups based around market opens or market closes when volatility tends to spike.
The regular ATR indicator will not account for this on the lower timeframes, but this indicator will!
Examples
Stocks - Heatmap Scheme with regular ATR
Stocks - Price Scheme - No ATR
Stocks - Traffic Scheme - Session Average Line RMA
Stocks - Trigger Scheme - 10 sessions
Forex - RMA
Forex - No RMA
Forex - Normal ATR Stop
Forex - Session ATR Stop

NavCoin SwapsSimple line chart showing the price of navcoin swaps against three other similarly 'small cap' cryptos that are competing in similar space. PIVX, MTL, and ARK. Double-click the line or click the settings icon to change colors etc.
All are Nav / Othercoin, so a line moving up means othercoin is losing value relative to Nav, and down means of course the other coin is now worth more Nav.
