TradewithPuneet: Pro-BreakoutsThe Pro-Breakouts strategy is designed to get into a LONG position when a stock enters an Uptrend after a breakout. This strategy gives you:
• BUY signals : On a breakout, with strong probability of continuing up-moves.
• No SHORT signals are included in this strategy.
Through this strategy, we aim to ride a big chunk of the Uptrend till it reverses.
The strategy uses certain filters to avoid fake breakouts. Once those filter conditions are met, the stock waits for a breakout of key resistance level. Upon the breakout, the stock gives a BUY signal. Finally, when the stock breaks its key support level, it gives an EXIT signal.
The strategy guides you the price level at which to BUY and EXIT. You can also input your acceptable stop loss and profit booking levels, which are then displayed on the chart. The resistance and support lines (which result in trades) are drawn automatically on the chart.
The strategy is for medium to long-term traders . It works only on Daily timeframes and on closing prices. Hence, during the market hours, if a stock breaks out of its key-resistance level, you will see a BUY signal, but if it closes below it, the signal will disappear.
This strategy is only built for stocks, not for indices or any other financial instrument.
Breakout

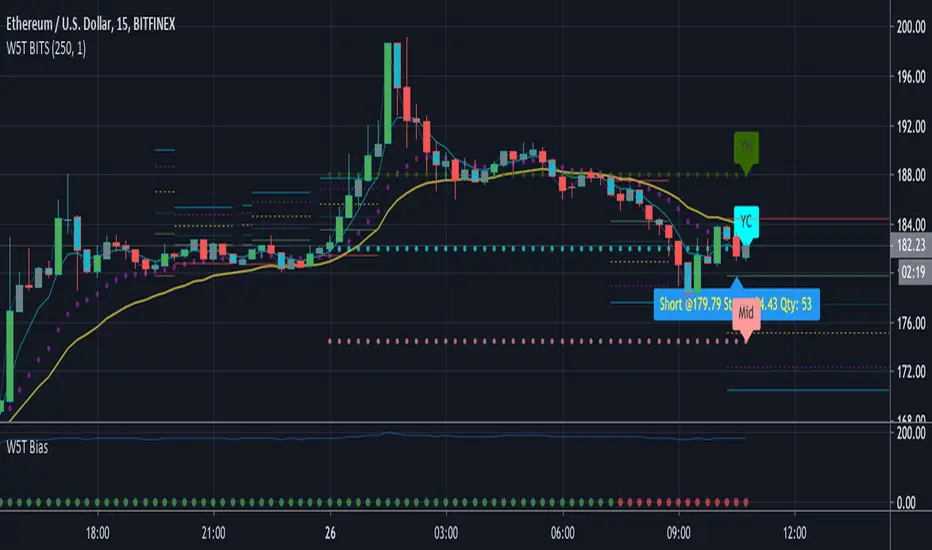
W5T BiasThe Bias indicator is a sub-chart allowing the users of the main B.I.T.S (Breakout Intelligent Trading Signals Indicator) suite. This Bias indicator automatically looks at a higher timeframe and indicates bullish , neutral and bearish Bias. This is respect to our 3 points of control EMA´s.
Check out our signature to learn more!

W5T BITSThe B.I.T.S (Breakout Intelligent Breakout Signals) Trading Suite is for swing and day trading instruments with Volume and price action. So Cryptocurrency, Futures , Stocks and Commodities on all time frames. We are looking at squeezes in price action with increased volume . Then the proximity to our points of control, which are different EMA´s
Developed through in our Cloud
Signal Candles Both Long & Short
Entry & Stop Loss Prices
Automated Bias Indicator
W5T Special Points of Control
Yesterday's HLC levels and labels
Automatic Risk Calculator when trading Stocks
Training Bootcamp
See our signature to learn more!
Market Structure Finder [Dzenis]This indicator is designed to help you visualize the high timeframe market structure breaks and shifts in trend.
It finds local swing highs and lows, and defines the market structure based on them.
Break above the blue line = market structure is bullish, look for long/buy
Break below the red line = market structure is bearish, look for short/sell
I wrote it as a strategy so it can be easily backtested, giving a more complete picture of its effectiveness for catching larger swings.
It works best in trending markets such as Bitcoin.
This specific backtesting strategy and buy/sell signals on the chart are meant for trading the spot markets.
Buy signal triggers the entry with 70% of the trading capital (can be adjusted in the indicator menu and backtested with different percentages).
Sell signal exits the position.
The results assume 0.1% trading fees by default (adjustable in the menu as well).
It does not repaint.
If trading the futures markets it can be used purely as an indicator to help you form a HTF bullish/bearish bias and look for trade setups accordingly.
Although it's not designed for intraday moves, it can be used on lower timeframes as well.
8h timeframe for swing trades.
1h timeframe for intraday setups.
Daily timeframe is still the suggested and main use of this indicator (forming high timeframe bias).
For any questions and inquiries, feel free to DM me.

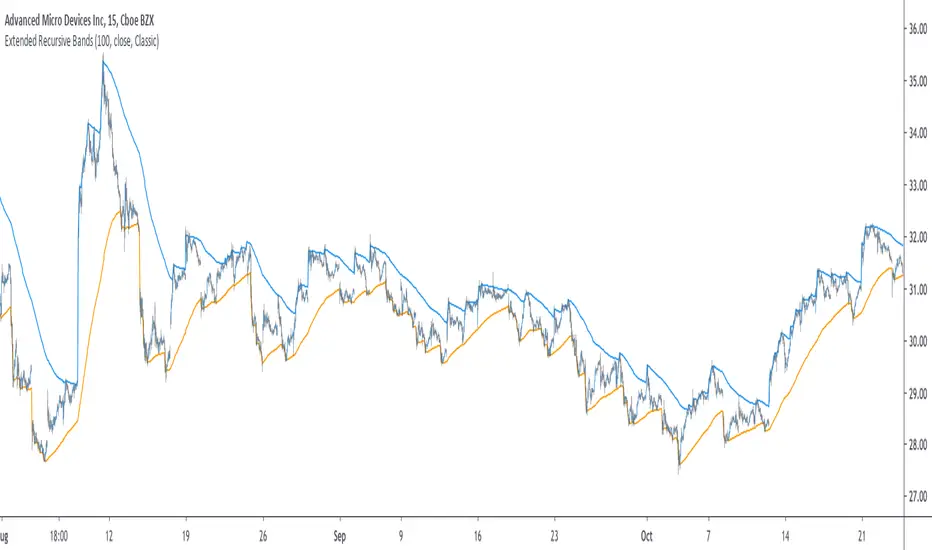
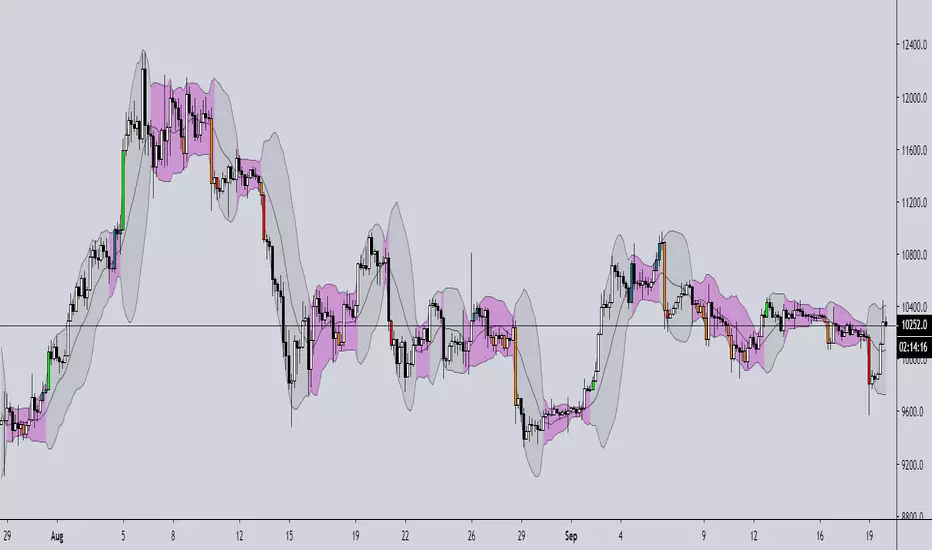
Extended Recursive Bands - Maximum Efficiency With Extra OptionsIntroducing A New Calculation For Efficient Bands Calculation !
Here it is ! The Recursive Bands Indicator, an indicator specially created to be extremely efficient, i think you already know that calculation time is extra important in algorithmic trading, and this is the principal motivation for the creation of the proposed indicator. Originally described in my paper "Pierrefeu, Alex (2019): Recursive Bands - A New Indicator For Technical Analysis" , the indicator framework has been widely used in my previous uploaded indicators, however it would have been a shame to not upload it, however user experience being a major concern for me, i decided to add extra options, which explain the term "extended".
On The Indicator Calculation
You can skip this part if it doesn't interest you. The calculation of the indicator is based on recursion, but i want to explain the mathematical formula described in the paper.
I've seen some users trying to remake it from the calculations, however there was always something weird, and i understand, mathematical notations are always a bit weird, even myself don't always write them correctly/understand them, however this one is relatively simple to understand.
First lets explain each elements of the calculation :
α = smoothing constant, or 2/(length+1)
max/min = maximum and minimum function, max return the greatest input value while min return the lowest one, for example :
max(4,2) = 4 while min(4,2) = 2
the "||" notation mean taking the absolute value, for example : |-1| = abs(-1) = 1
The calculation after the max/min function is called the correction factor, and is the core of the indicator. The last two variables are just here to provide an initial value for upper and lower, basically when we start our calculations we will assign the value of the closing price for upper and lower.
The motivation behind using a smoothing constant in range of (0,1) was to tell the reader that the indicator is easily made adaptive, this is what i did on my adaptive trailing stop indicator by using the efficiency ratio as smoothing variable, the user can use 1/length instead of the provided calculation for alpha.
If you interested on the indicator main logic, it is actually really simple, by using upper = max(price,upper) and lower = min(price,lower) we would get the maximum/minimum price value at time t , therefore upper can only be greater or equal than its precedent value, while lower can only be lower or equal than its precedent value, in order to fix that we subtract/sum upper/lower with a value, this allow the upper band to be lower than its precedent value and lower to be greater than its precedent value, this is the role of the correction factor.
The Indicator
The indicator display one upper and one lower band, every common usages applied to bands indicators such as support/resistance, breakout, trailing stop...etc, can also be applied to this one. length control how reactive the bands are, higher values of length will make the bands cross the price less often.
In order to provide more flexibility for the user i added the option to use various methods for the calculation of the indicator, therefore the indicator can use the average true range, standard deviation, average high-low range, and one totally exclusive method specially designed for this indicator.
Classic Method
This option make the indicator use its classical calculation, this is the most efficient method of all.
Atr Method (atr)
This method use the average true range as correction factor, notice that lower values of length can still produce wide band.
Standard Deviation Method (stdev)
This method use a biased estimate of the standard deviation as correction factor.
The method produce smoother bands that converge more slowly toward the price in comparison with the classic correction factor.
Average High-Low Range Method (ahlr)
This method use the average of the high-low range as correction factor, extremely similar to the average true range.
Rising Falling Volatility (rfv) Method
A new method created for this indicator, this correction factor use the absolute prices changes when price value is greater/lower than any length past values of the price, this allow to have more boxy shaped bands, work best with greater values of length.
The bands can be in contact with this method, a possible fix in the future.
Conclusion
The recursive band indicator is one of my greatest indicators in my opinion (i would love to have yours), as you can see the idea behind it is extremely simple and allow for a super efficient band indicator, which was the original motivation behind it, in order to provide more fun for the users i also added more option for the correction factor, this allow the user to be creative and not get stuck with the original calculation.
Like the trend step indicator family we have almost ended our series on the recursive band framework, 1 more trailing stop will be added in the future, and then we'll have more "boring" stuff until i find something cool again, it shouldn't be long ;)
Thanks for reading !
Super Signal - Bollinger BandsBollinger Bands are price channels, or bands, that are plotted above and below price. The outer Bollinger Bands are based on price volatility, which means that they expand when the price fluctuates and trends strongly, and the Bands contract during sideways consolidations and low momentum trends. By using a combination of several indicators, we try to predict the direction of a large price movement when the Bands are compressed and the market is in a consolidation period.
To use the indicator:
Go long on the green arrows.
Go short on the red arrows.
The blue circles give a clear indication of when a trend has ended.

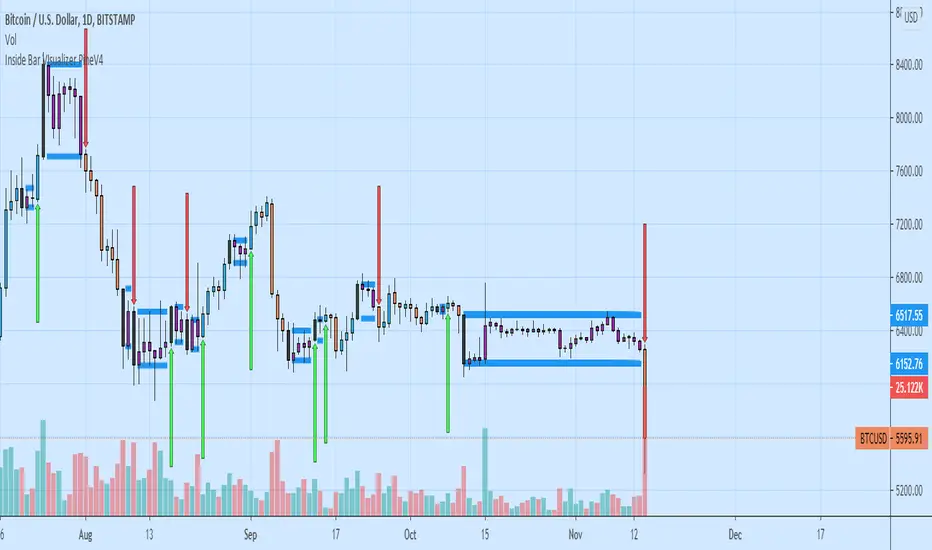
Inside Bar Visualizer PineV4I didn't find a study for Inside bar as I wanted. Therefore I wrote a one with PineV4. This may help you to see inside bars.
It can recalculate and works with either (opens-closes) or (highs-lows)
Cheers! :)
CFT Auto Pivot Trend LinesThis script draws real time trend lines from swing highs and lows which will automatically draw your trend lines for you.
Extremely useful for catching a trend confirmation and triangle break outs.
This is best used with the CFT Auto Support & Resistance Indicator and CFT Buy Sell Signals for additional confirmations.
If you need any help just message me.
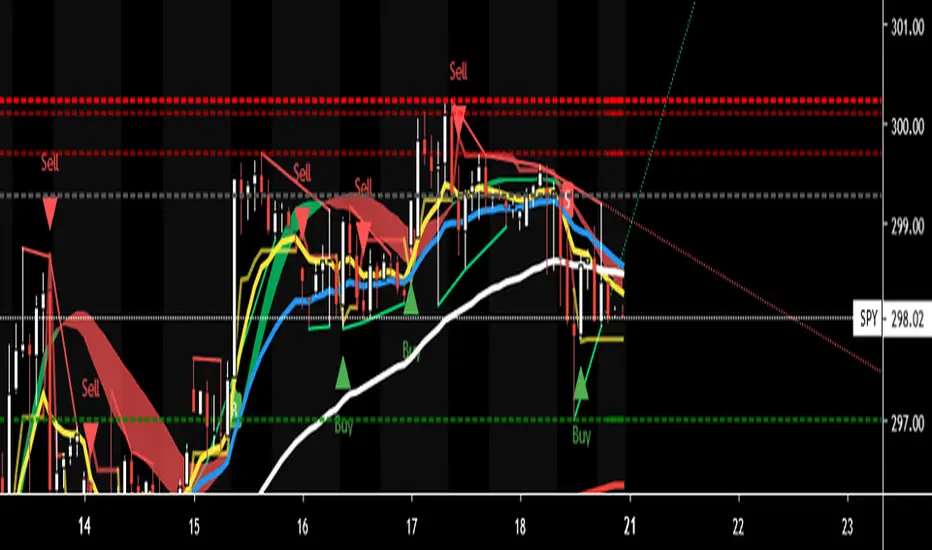
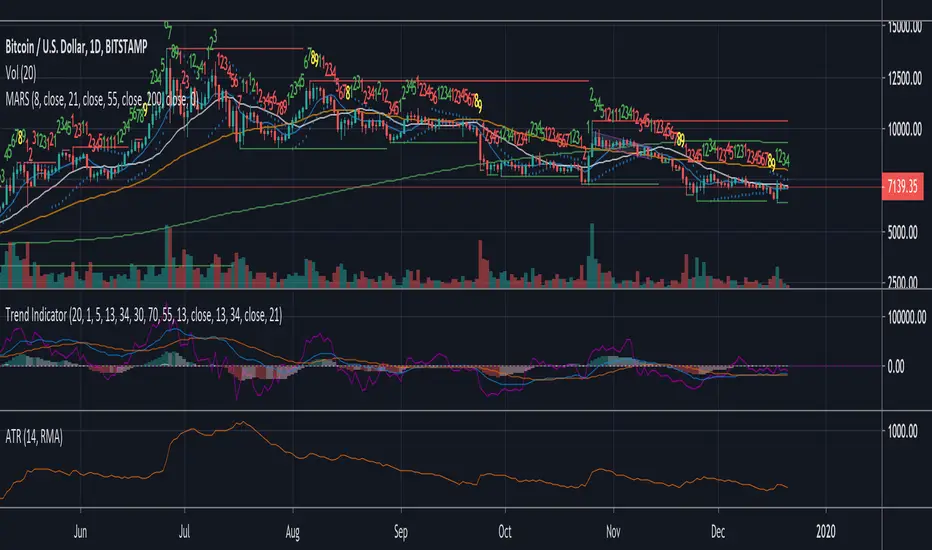
Trend Indicator
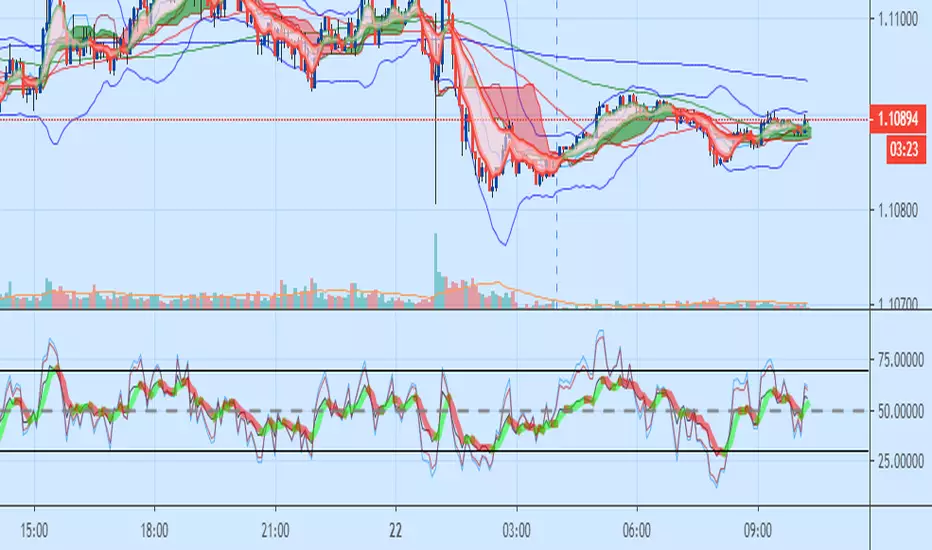
A Simple indicator combining 3 of the most popular Oscillators RSI, MacD and Momentum to help see reversals or the continuation of a trend. Designed with the COINBASE:BTCUSD chart in mind but there's not reason it shouldn't work on any other asset.
The indicator has two main parts:
- The gray area at the top between the purple dotted lines is 3 RSI's in one (5, 13, 34) These have been moved up from the RSI's original position to avoid cluttering the MacD and make the lines easier to read. Just like with the regular RSI the lower dotted line indicates oversold and the top dotted line indicates an overbought condition.
To identify this more easily the background changes to green when the middle (13 period) RSI is oversold and red when it's overbought.
*Note* On some very small timeframes the position may need to be adjusted in order to make them easier to see.
This section of the indicator is designed to give early warning signs of markets reversing by the faster white line with confirmation from the orange and green lines.
- The bottom section of the indicator has two parts. The first is a modified MacD which is slightly longer term than the original. This is to act as confirmation or entry/take profit points on divergence or if either of the lines within the MacD crossover or the histogram goes from one color to the other. The histogram is also helpful for trend-following as it lets you gauge if the momentum is gaining or losing strength.
The last part of the indicator is simply a momentum line to indicate in which direction the momentum is heading. It's designed as a confirmation of the other indicators and shouldn't be used on it's own.
All individual indicators that make up the trend indicator have been tweaked slightly to use numbers from the fibonacci sequence rather than the originals.
This indicator is best used in combination with volume and moving averages.
- Look for reversals on low volume near a moving average or key historical point.
- Look for breakouts on high volume if the oscillators line up.

Moving Averages (21, 55, 200) with Parabolic SAR and Support/ ReA Simple indicator combining 3 of the most popular simple moving averages; (21,55, 200) with a tweaked Parabolic SAR as well as recent support & resistance points.
Developed to help see key areas of interest on COINBASE:BTCUSD quickly without needing to draw many manual trendlines in order to trade breakouts or bounces at key levels. But should be useful for any market.
This indicator is best used in combination with oscillators such as the MacD or RSI and also volume.
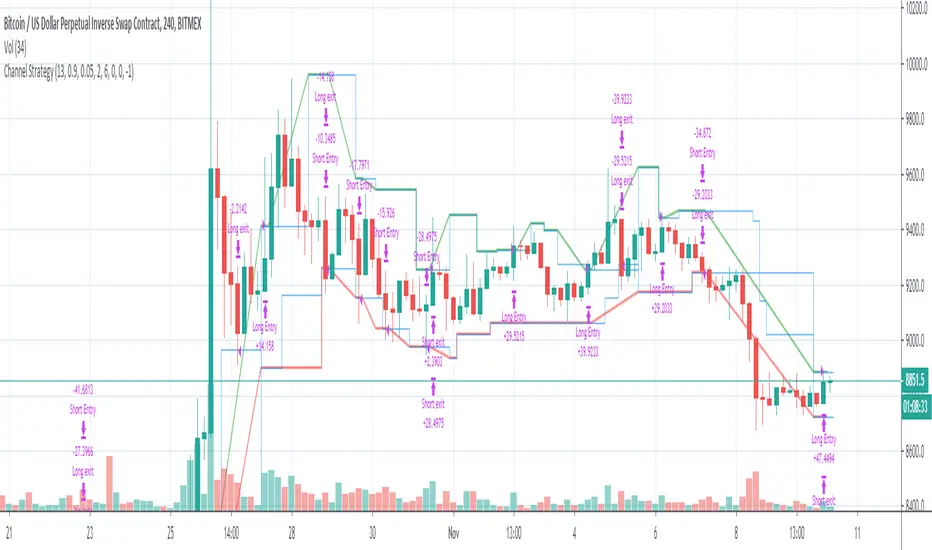
Channel Strategy for CryptoCurrenciesIts a break-out strategy with simple rules and strict money management (every trade risk 1% of the equity)
Entry happens on breakout of significant swing points.
Initial stop loss is on the opposite swingpoint and will be trailed by multiple factors including a maximum distance to the current price.
Works best on BTCUSD on H4. Also good results on higher timeframes.
also cross checked other pairs. works on IOTUSD and EOSUSD . Seems to have some troubles (in default params) with LTC and XRP.
feel free to leave a comment and please tell me if you find a reason why this shouldn't make you rich :D
Breakout Relative Strength IndexIt isn't easy to determine if the price of a stock is about to break out. Here’s one way you can determine the relative strength of a breakout, enabling you to act early and realize higher profits.
This indicator was originally developed by Howard Wang Stocks & Commodities V. 33:09 (60–62)

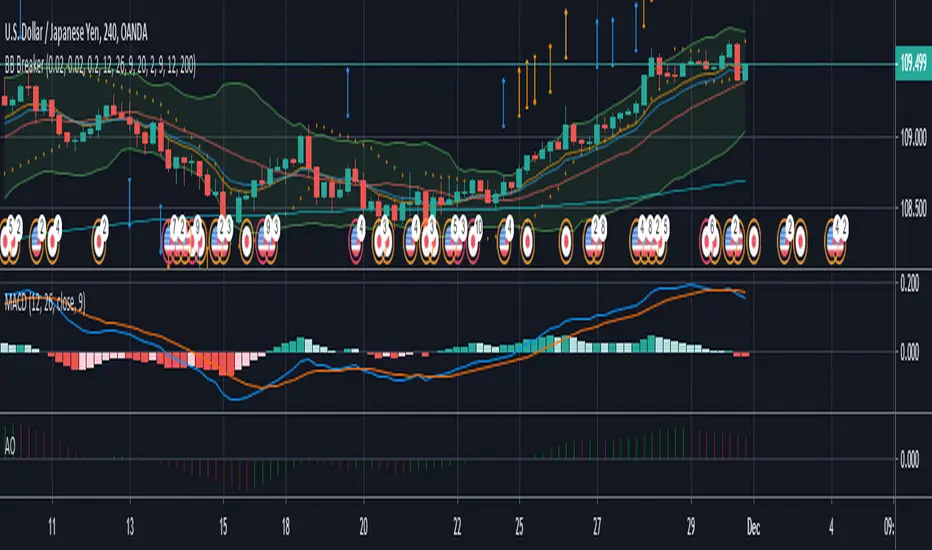
EXZYLE:Pipsanee BB (development)This is the development version of the Exzyle/Pipsanee Bollinger Band Breakout indicator and alerts.
Bollinger Band breakouts are tagged with an arrow showing the direction they are heading.
The alerts trigger only on the first breakout.
This code also includes a MACD Retracement indicator.
Auto Squeeze Breakout BarsThe Auto Squeeze Breakout Bars find bars that are breaking out of a low volatility environment into a high volatility environment.
The Squeeze shading is signaled when the volatility of the asset is very low. Then the Squeeze Breakout Bars are signaled when the asset is breaking out of this low volatility structure.
Warning bars will be signaled when it is approaching a breakout, but the conditions are not fully met at that very time.
The Auto Squeeze Breakout Bar indicator also has a built in stop loss mechanic that can be set to your preferred limit.
Stop losses are highly recommended when using the breakout bars because of possible head fakes. They are rare, but can occur depending on the asset you are trading.
For Access or Questions: Private message us. Thank you.
X Period High/Low/MidToday we have a simple, but endlessly versatile, indicator that plots the X Period High/Low/Mid of your chosen market.
Traditionally the 52 week High/Low is used as a breakout signal. However, by changing to an X period, and adding a midway line, we create a more versatile indicator that can be tailored to various markets.
By default it's set at 250 periods (because I like the 250 period moving average), and I generally trade H4 and Daily time frames. But tweak it to your liking, you just have to modify the length periods by your desired time frame and lookback length. E.g. to create a 52 week indicator on the daily time frame, enter a length of 260 in the indicator (5 days per week * 52 weeks = 260).
For the above reason, I haven't made this indicator MTF, as there's no real need. However, if users find it easier I can look at adding it later.
Also, the mid point between an X period high/low is often a good trend-follower, as well as acting as support/resistance . I encourage you to experiment with different ways of using this indicator. Entire systems (if your risk management is correct) can be built and traded from this one indicator.
Good luck.
DD

Improved CCI with Momentum OscillatorThis indicator is free to all Oasis Trading Group members.
The Improved CCI is a basic CCI with a momentum gauge applied to the zero line. This indicator is used to find breakouts/breakdowns and when they have lost momentum.
A bullish entry would be found when the CCI has broken the 100 line when the Momentum gauge is above zero or when the CCI has crossed above the -100 line when the Momentum gauge is above zero.
A bearish entry would be found when the CCI has broken the -100 line when the Momentum gauge is below zero or when the CCI has crossed below the 100 line when the Momentum gauge is below zero.
For Access or Questions: Private message us. Thank you.

Lancelot RR StrategyDear all,
Free strategy again.
This strategy consists of 2 indicators I think works well with each other as a trend following strategy.
The 2 indicators are Renko chart and Relative Vigor Index.
This is a long-only breakout strategy that aims to capture the majority of the trend.
Works well on BTCUSD XBTUSD, as well as other major liquid Pair.
Please acknowledge my effort by like and follow.
And lastly,
Save Hong Kong, the revolution of our times.

ZigZag Plus [xdecow]A ZigZag Like based on candle close.
A lot of options that can be hide in options.
Triangle/bright - reversal confirmation candle
Circle/dark - higher/lower candle breakout
Square/light - Insidebar

RSI , products of Nha Son Pleikuđây là công cụ bắt đỉnh đáy tốt nhất hiện nay.
mình áp dụng rất hiệu quả.
chia sẽ cho các bạn !!
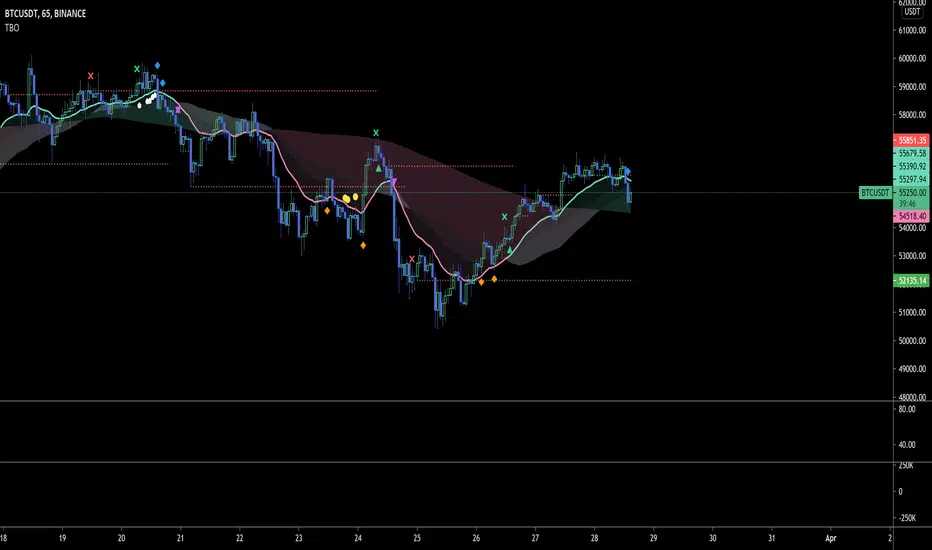
(TBO) Trending Break OutTBO (Trending Break Out) is an indicator designed to help identify trends within the markets. Users are able to see trend continuations and potential trend reversals. Potential breakouts are also shown as trend strength increases or decreases. There are buy signals and short signals included as well. Clouds show underlying support or resistance areas and potential changes in trend strength. Pivots show resistance and support as well.
-Brought to you by Drungle_OG and MooninPapa (YouTubes)
~RMCF~ BORC [with 17 page Annotated PDF with Example Charts]BORC, or Breakout Reversal Confirmation, is a signal based TV Indicator that analyzes multi-period price movements to determine when to enter in oversold and overbought tradeable assets. It works in any time frame and any type of security.
Green triangle means buy
Red Triangle means to get ready for the buy signal
$60 for lifetime access + complimentary PDF with example chart setups
DM @reaganmcf_ on twitter for more information and access

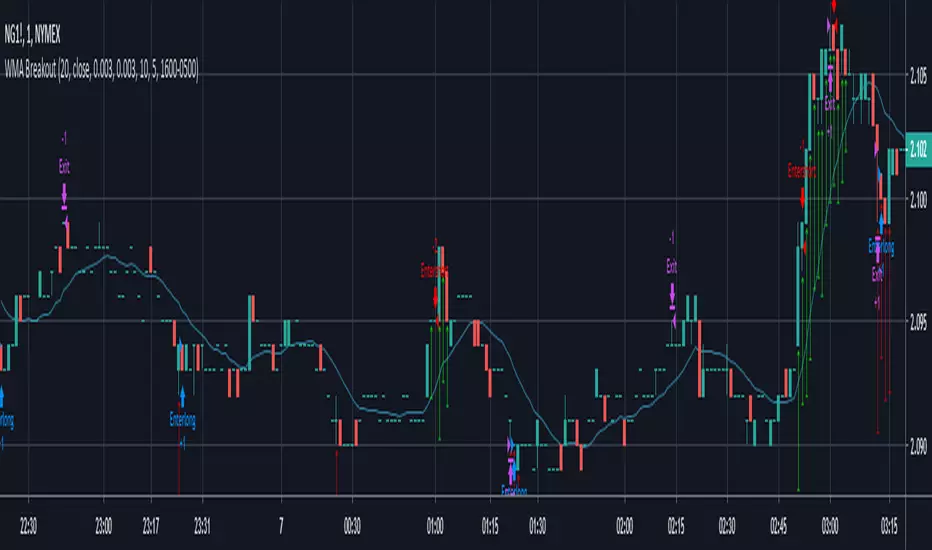
Breakout Reversal Entry on WMA - NG1! Overnight ver 1This script is for learning purposes only
This strategy will plot arrows when price breaks so far above/below WMA. The strategy will enter when the price breaks away from WMA. All entries are reversals. Users can set WMA length and source; also the distance of the price away from WMA to enter. Adjustable bracket orders are placed for exit, with trailing stop or market stop choice. Last, users can set the time of day they want to enter a trade.
My Preference: I am testing this strategy on NG1! over night on 1 minute candle. with .003 on price drop/climb, I get entries almost every night. Also 10 tick stop and 5 tick profit seems backward to most, but with a high win/loss ratio, it performs quite well. Trailing stops generally help out as well.
INPUTS:
Length - The is the WMA length
Source - WMA source (High, Low, Open, Close...)
When Price Drops - This is the distance in ticks when the price drops away from WMA, an arrow is plotted, and reversal entry order is placed
When Price Climbs - Same as price drop, just in the opposite direction
Trailing Stop check box - Check if you want to place a trailing stop so many tick away from entry. Unchecked is Market (hard) stop so many ticks from entry.
Stop - Number of ticks away from entry a the stop or trailing stop is set (for NG 1 tick = $0.001)
Limit Out - Number of ticks away from entry a limit order is placed to take profits
Limit Time of day check box - check to use the time of day to limit what time of day order entry will occur.
Start/Stop Trades (Est Time) - First box is when the strategy will be allowed to start buying and stop is when the strategy will stop being allowed to buy. Sell orders continue until a stop or limit triggers an exit. These times are Eastern time zone
PROPERTIES:
Pyramiding - This feature will allow multiple entries to occur. If set to 1, the strategy should only trade 1 contract at a time. If set to 2, the strategy will enter a second order if entry requirements are met. This allows you to be holding 2 contracts. Basically on a good day, it will multiply your earnings, on a bad day, you'll just lose more. For testing, I keep this on 1.
TIPS:
- If you want to go long only, set "When Price Climbs" to an impossible number, like 10,000. It's not possible for NG to move $10 is a matter of minutes so it will not enter the market with a short order. Also keep in mind you can set different requirements for going long vs going short. If you think there is more pull on the market in a particular direction.
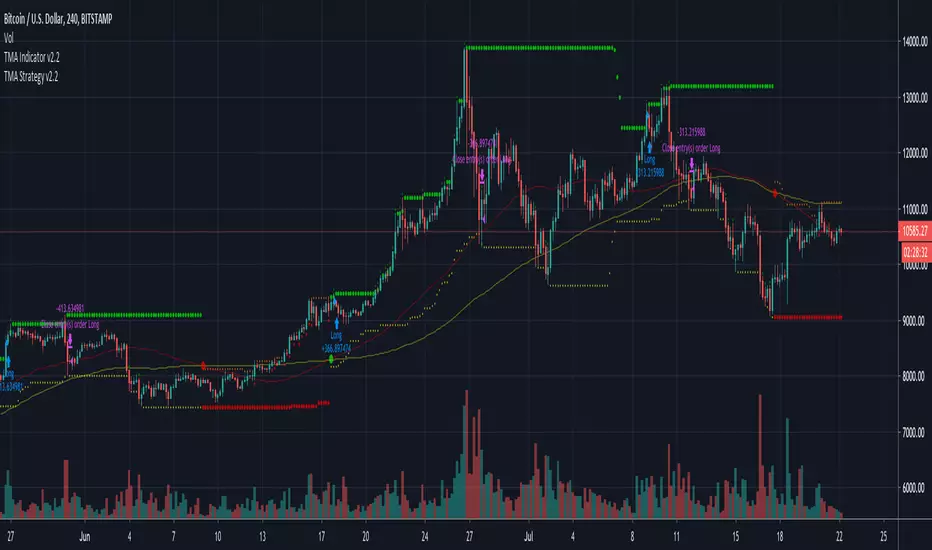
TMA Strategy v2.2This is a backtest of the TMA Indicator v2.2 using default parameters.
Backtest window: Jan 1, 2015 - Jul 21, 2019 (today)
For more information on the indicator and strategy seen here please take a look at this backtest:
For paper trading only. Do not use on real markets. Never make investment decisions based on this indicator alone.