Cross impro test by Canundo Crossover Crossunder Tick valuesThis is a script where I tried to check the following things:
Even thought the tick of an asset is, for example 0.5, there are calculated prices, like SMA's that have even more decimals. Leading to crosses happening that for example happen at the same price. Consequently triggering totally useless in side markets. What happens if SMA values are restricted to the tick resolution? (Option works on it's own or with a combination of the others.)
What happens if I set my own tick value, like 0.8 instead of 0.5, what will be the effect for calculated values that are used for crossings? Will tick sizes improve the success rate? (This option will work only when the first option is active.)
Can success rate, especially for sideway markets be improved when adding a spread between MA's, so that it triggers less in sideway markets? (Option works on it's own or with a combination of the others.)
First of all, I had a hard time to round prices properly when it needs to be dynamic and working for different assets with different amounts of decimal values in the tick. The solution is that abs(floor(syminfo.mintick)) will give you the amount of decimals a tick has. It works for all ticks that are at least lower than 10. I'm not sure how huge ticks are out there. I did not implement this solution at the end since I found another way to test it.
Findings:
The first option, when activated, takes out half the trades and raises the percent profitability by 8% so there is some effect. However, all of the tested options have less advantage than I hoped for but are nevertheless something worthy for sideway markets. The first option just forces the MA's from the example to use the tick resolution.
See these two images. One when the first option is off, the second when it's active.
The lines are the MA's with adjusted values, the crosses are the places of the MA's when left as is.
Here a screenshot of the third option set to the value 2 on the 1 minute XBTUSD chart.
The advantage is that less trades trigger that have a low change in price and so less trading fees will happen.
The disadvantage is that all options can implement some delay for a crossing since the crossing will trigger once a slightly bigger move into the direction was taken.
This test environment was not meant to be profitable but to test the effects.
Maybe someone finds it interesting or wanted to test the same, so here you can save some work.
TICK

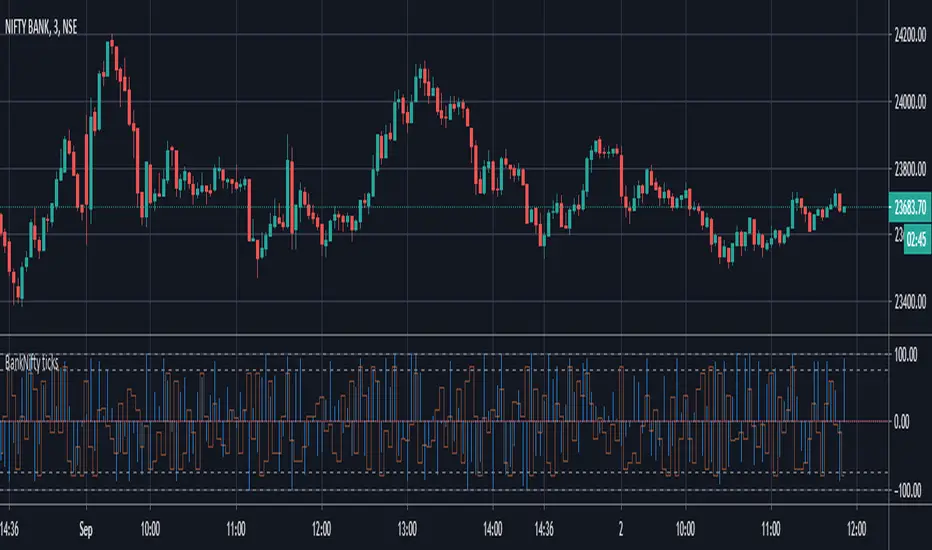
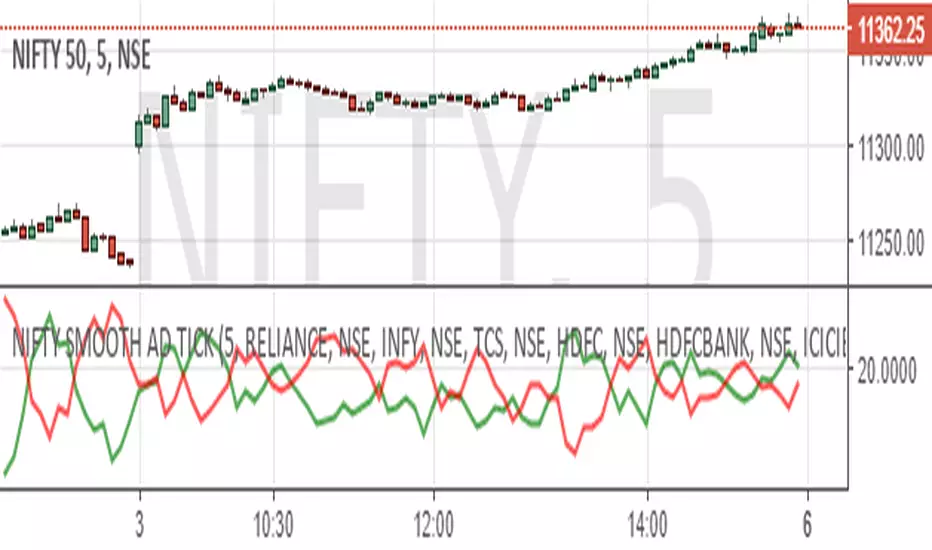
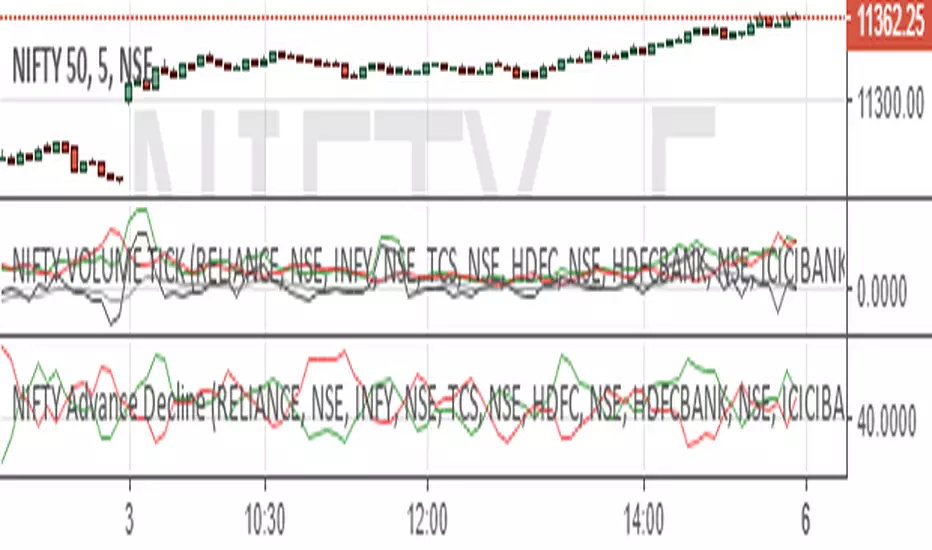
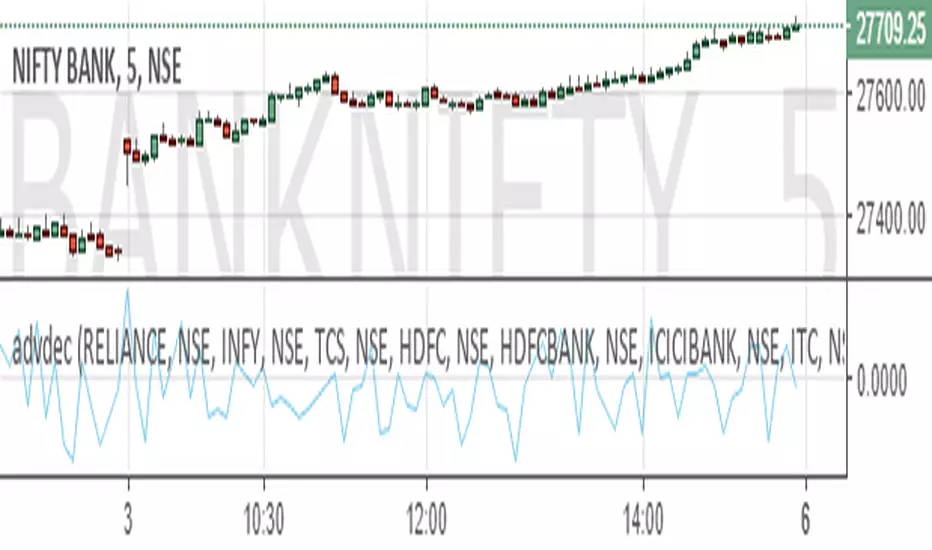
BankNifty ticksThis is an attempt to create a leading indicator for BankNifty movement.
Here I combine Banknifty stocks and indices to create a Tick chart.
A Tick Chart - By definition, a Tick Chart tracks movement of the underlying stocks. A positive move is counted as +1 and negative move is counted as -1. Total for the underlying stocks is shown as tick chart.
BUT - Some stocks like HDFC Bank have much larger influence on the BankNifty index. So I have give weights to the stocks to calculate the index. Movement in other indices like Nifty also has influence of Banknifty next move. Hence I have combined a few indices in the calculation.
How to use this chart:
Reversals: One can look for strong tick movement in reverse direction of current trend - preceded by weak ticks.
Continuation Confirmation: Average tick movement in the positive or negative territory can confirm the positive or negative momentum respectively.
Further Notes:
I have also observed that before some reversals, tick value jumps to extreme. e.g. chart is showing minor uptrend. So we are getting Ticks in positive territory .. and there is a sudden extreme uptick..and then Banknifty turns down.
Nothing is perfect. So, even this indicator doesn't give you exact signals. Please take every indication / signal to strengthen your price action analysis.
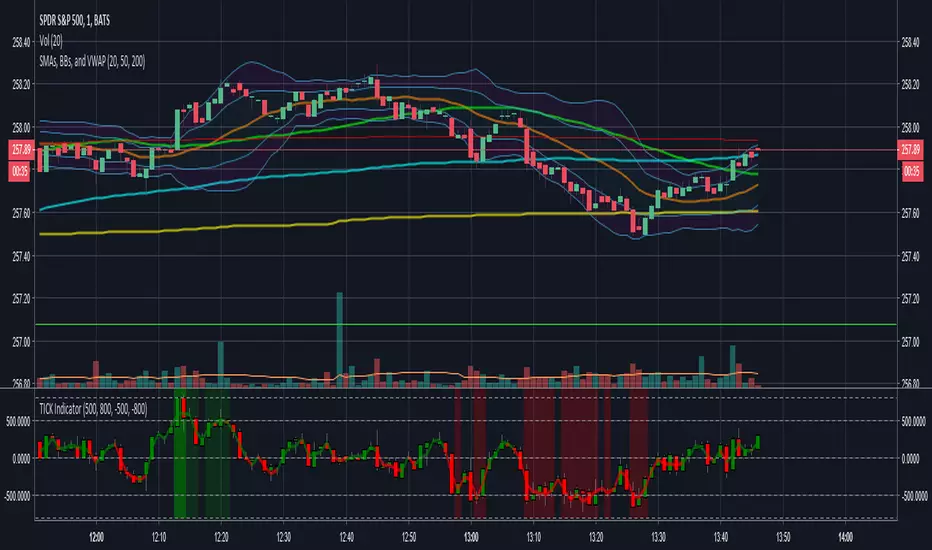
TICK IndicatorThis indicator is meant for primarily day trading. This indicator displays TICK in an easy to follow format and becomes more visible when there is a strong move in either direction

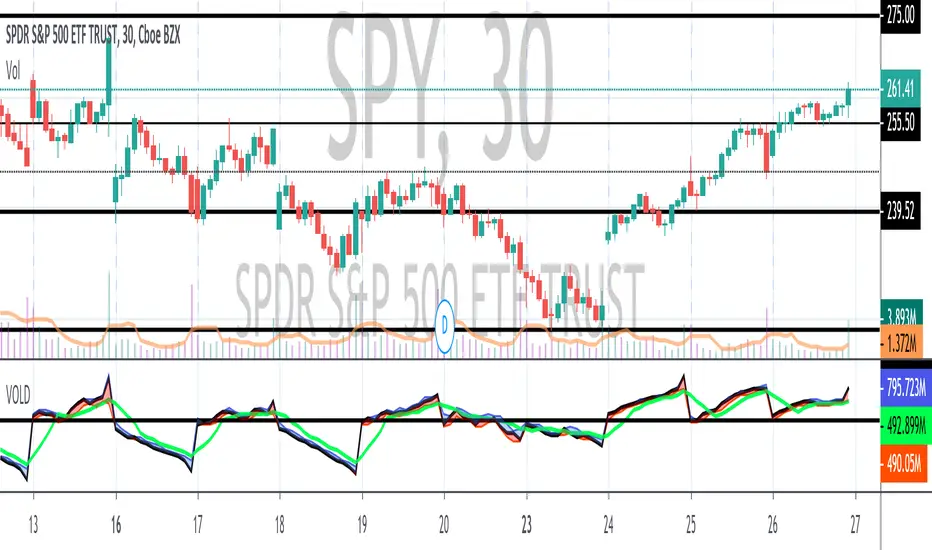
NYSE Volume UP FLOW VS Down FLOW ULTIMATE VOLDNYSE Volume UP FLOW VS Down FLOW ULTIMATE StokedStocks
BASED OFF THE VOLD INDEX
The VOLD (also $VOLD) is the difference between the up volume and down volume on the NYSE. i.e. NYSE $UVOL minus $DVOL; the net up volume.
If you consider that VOLD is the net value between UVOL (up volume) and DVOL (down volume) then you need to understand these two to understand VOLD.
UVOL or DVOL are a total of the volume on all stocks that are up or down in price. Up or down is based on the previous session's closing price. The size of the stock's price change is irrelevant.
If the stock is up only $.01, then its volume is grouped into the UVOL total. If that stock's price then drops by $.02 it will be down $.01 and the day's volume for that stock will now be grouped with the DVOL total.
Note that when a stock moves from being an up stock to a down stock its volume will be removed from the UVOL total and added to the DVOL total. Say the stocks volume is 1 million shares when it moves from up to down. The DVOL will increase by 1 million and the UVOL will decrease by 1 million which means that VOLD will decrease by 2 million.
NYSE Up/Down Volume Ratio is often used as a barometer for stocks trading on all U.S. Exchanges even though it is calculated based on stocks listed on the New York Stock Exchange.
NYSE Up/Down ratio represents the volume of NYSE stocks that are advancing divided by the volume of declining stocks.
The volume of advancing stocks or upside volume is the sum of the volume or the number of shares traded associated with stocks that closed higher.
The downside volume is the total number of shares traded that are associated with stocks that closed lower.
The interpretation of the NYSE Up/Down ratio is rather simple. A value higher than one indicates that there is more volume associated with up stocks than with down stocks and it is usually interpreted as a bullish signal.
Obviously, a bearish signal occurs when the NYSE Up/Down ratio is lower than one, which tells us that there are more volume associated with down stocks than with up stocks.
Check out my other indicators and website stokedstocks.wordpress.com for tons of free stock training books and pictures and settings
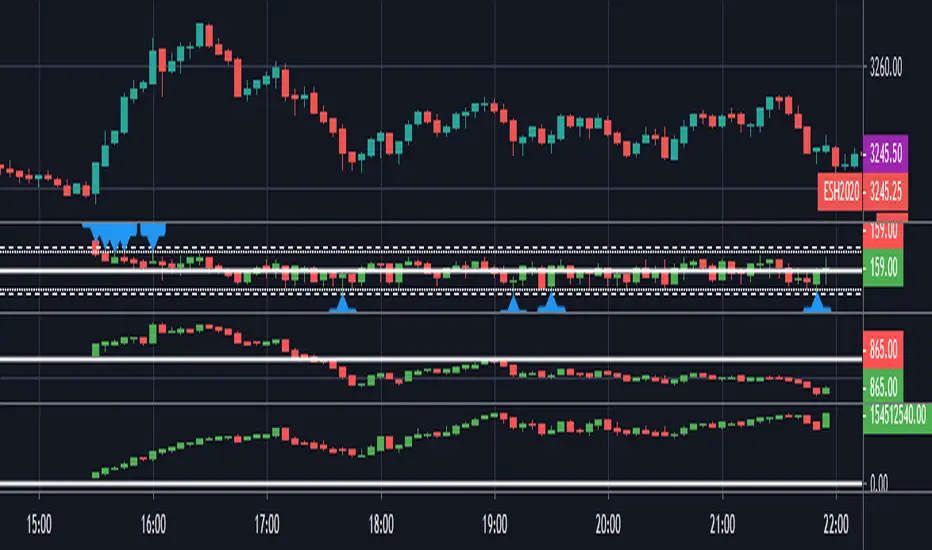
Market Internals [Makit0] MARKET INTERNALS INDICATOR v0.5beta
Market Internals are suitable for day trade equity indices, named SPY or /ES, please do your own research about what they are and how to use them
This scripts plots the NYSE market internals charts as an indicator for an easy and full visualization of market internal structure all in one chart, useful for SPY and /ES trading
Description of the Market Internals
- TICK: NYSE stocks ticking up vs stocks ticking down, extreme values may point to trend continuation on trending days or reversal in non trending days, example of extreme values can be 800 and 1000
- ADD: NYSE stocks going up vs stocks going down, if price auctions around the zero line may be a non trend day, otherwise may be a trend day
- VOLD: NYSE volume of stocks up vs volume of stocks going down, identify clearly where the volume is going, as example if volume is flowing down may be a good idea no to place longs
- TRIN: NYSE up stocks vs down stocks ratio divided by up volume vs down volume ratio. A value of 1 indicates parity, below that the strength is on the long side, above the strength is in the short side.
A basic use of market internals may be looking for divergences, for example:
- /ES is trading in a range but ADD and VOLD are trending up nonstop, may /ES will break the range to the upside
- /ES is trading in a range and ADD and VOLD are trading around the zero line but got an extreme reading on TICK, may be a non trending day and the TICK extreme reading is at one of the extremes of the /ES range, may be a good probability trade to fade that move
- /ES is trading in a trend to the downside, ADD and VOLD too, you catch a good portion of the move but are fearful to flat and miss more gains, you see in the TICK a lot of extreme values below -800 so your're confident in the continuation of the downtrend, until the TICK goes beyond -1000 and you use that signal to go flat
Market internals give you context and confirmation, price in /ES may be trending but if market internals do not confirm the move may a reversal is on its way
Price is an advertise, you can see the real move in the structure below, in the behavior of the individual components of the market, those are the real questions:
- How many stocks are going up/down (ADD)
- How many volume is flowing up/down (VOLD)
- How many stocks are ticking up/down (TICK)
- What is the overall volume breath of the market (TRIN)
FEATURES:
- Plot one of the four basic market internal indices: TICK, ADD, VOLD and TRIN
- Show labels with values beyond an user defined threshold
- Show ZERO line
- Show user defined Dotted and Dashed lines
- Show user defined moving average
SETTINGS:
- Market internal: ticker to plot in the indicator, four options to choose from (TICK, ADD, VOLD and TRIN)
- Labels threshold: all values beyond this will be ploted as labels
- Dot lines at: two dotted lines will be plotted at this value above and below the zero line
- Dash lines at: two dashed lines will be plotted at this value above and below the zero line
- MA type: two options avaiable SMA (Simple Moving Average) or EMA (Exponential Moving Average)
- MA length: number of bars to calculate the moving average
- Show zero line: show or hide zero line
- Show dot line: show or hide dotted lines
- Show dash line: show or hide dashed lines
- Show labels: show or hide labels
GOOD LUCK AND HAPPY TRADING
Tick ChangeTo detect volatility change in any given timeframe. Best used at 5/15/60/240 TF
Adjust parameter accordingly
CL/ZL = 100
DJ/NASDAQ/SPX = 1

TICK Extremes IndicatorSimple TICK indicator, plots candles and HL2 line
Conditional green/red coloring for highs above 500, 900 and lows above 0, and for lows below -500, -900, and highs above 0
Probably best used for 1 - 5 min timeframes
Always open to suggestions if criteria needs tweaking or if something else would make it more useful or user-friendly!
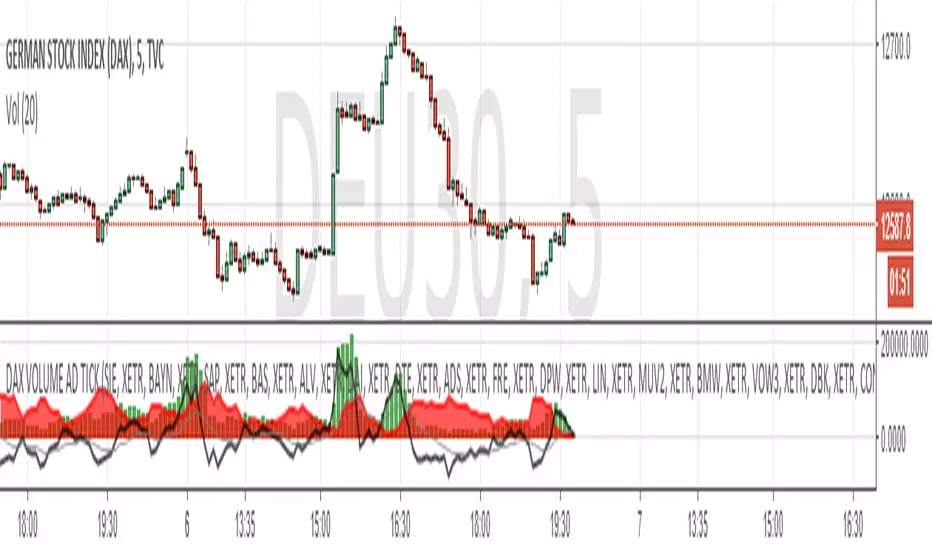
DAX(Germany30) VOLUME AD TICKDAX(Germany) VOLUME AD TICK - Captures the tick volume for DAX index.
@TradeInternals we provide tick volume and tick indices for all global major exchanges


Tick Tick BoomThis is THE tick tick boom method from the GOLD MINDS group!
When we enter a trade the line changes color.
If your charts are not in UTC time then you can adjust the UTC offset time. If your charts are in UTC-9 then set this to 9, if you are in UTC+1 set this to -1, if your charts are un UTC then set this to 0.
I noticed daily pivots, support, and resistance levels are pretty useful targets here. Uncheck the box if you would like to see the levels.
Many thanks to Dimitri Wallace!

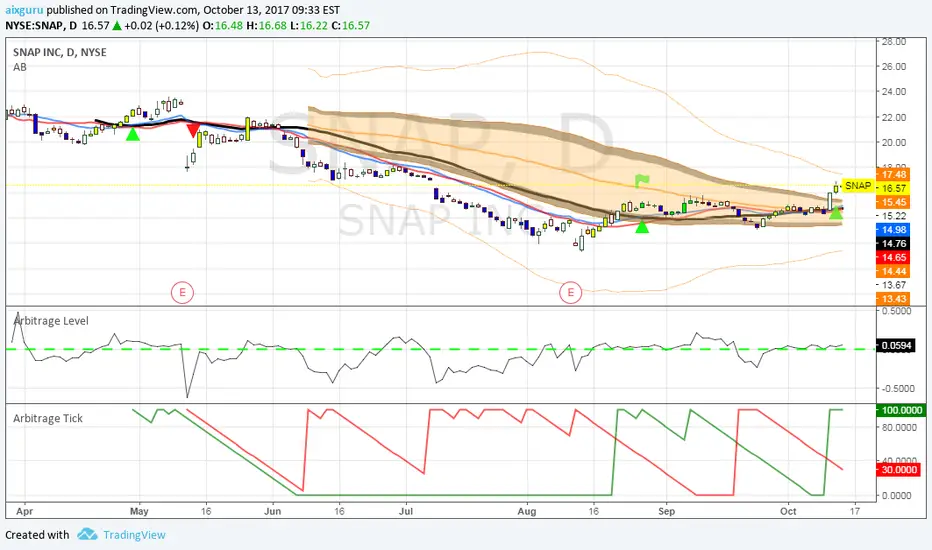
Arbitrage Level (Advance)This version of level is designed for stocks that have not existed long enough to qualify for our standard arbitrage level formula.
It also can be used on shorter time periods to show entries for day trades or swing trades.
Enjoy
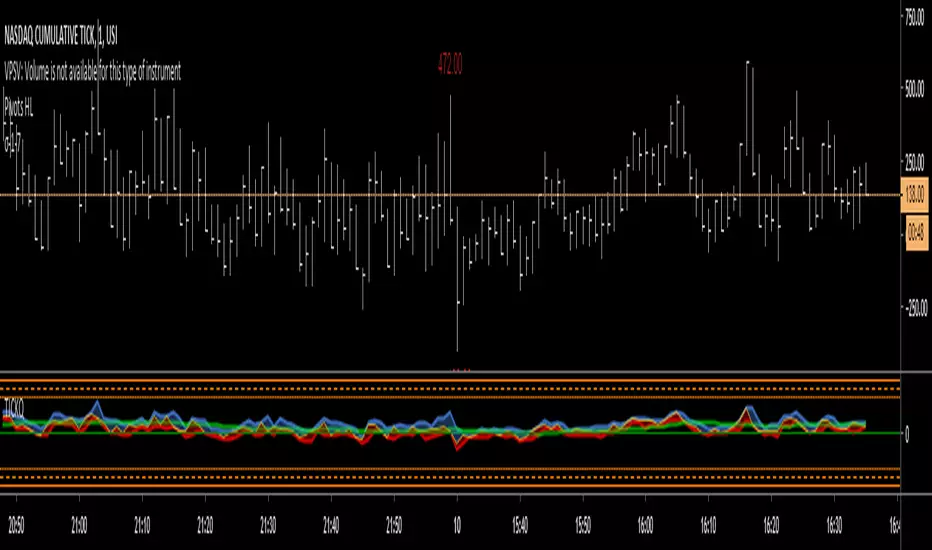
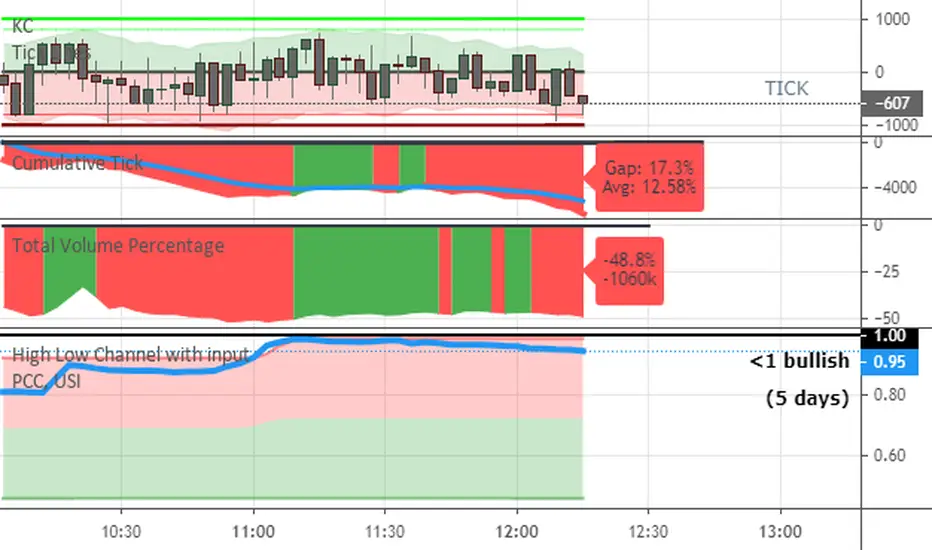
Cumulative TickThis is a script that I use to plot the cumulative TICKS. It resets at the beginning of the session (or whatever time is entered on the input variable) and then starts adding, or subtracting if negative).
TICKv2USI:TICK
FX:SPX500
CME_MINI:ES1!
High/Low/Close/SMA of $TICK
Changes:
editable SMA lenght of HL/2 instead of ema of ohlc4. (green line)
added close (yelllow).
added 4 more editable lines.