INVITE-ONLY SCRIPT
ATR Auto Oscillator [DepthHouse]
Обновлено
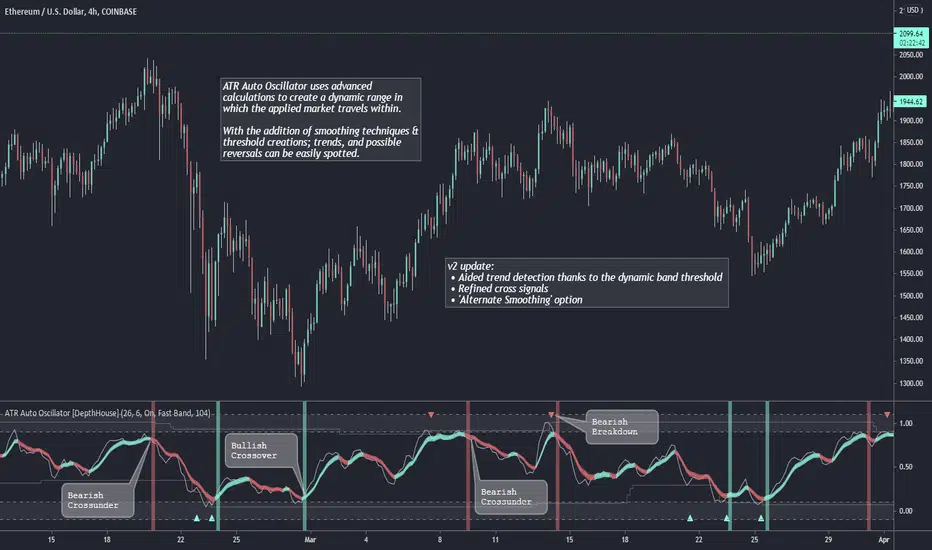
The ATR Auto Oscillator uses advanced range calculations to determine a dynamic range that the applied market moves within. Like an RSI , the ATR Auto Oscillator measures the speed and change of price movements through a given range. Unlike an RSI , the ATR Auto Oscillator automatically re-configures range values dependent on the user set lookback.
The oscillator ranges between (0.1) and 1.1. Generally, the market is oversold while the bands are below 0.2 and is overbought while above 0.8.
The two bands displayed are used to determine short term trend directions and the oversold/undersold state of the applied market. Crossovers of these bands could give a hint to the direction the market is moving.
The fast band (green) is the direct value of where the market is within its calculated range; 1.1 representing the top of range, and -0.1 representing the bottom. Even when this value is near the bottom of the top of the range, the auto oscillator will readjust to create a new range that the market travels within.
The slow band (red) is a lagging version of the fast band which is used to determine the oversold/overbought signals. When this band travels within the oversold and overbought regions the background color will change to signal a warning. If the fast band crosses the slow band within these zones, an opaque signal will appear. These signals are used to catch possible trend reversals.
Breakout Signals (BETA):
Breakout signals are the up and down arrows displayed on the top and bottom of the oscillator. A refined range is generated by the user set 'High Low Length'; it is then displayed by the light gray horizontal lines. If the user set band (fast or slow) returns into the range within a given period (breakout offset) then a signal will generate.
Built in Alerts (must be set up by user):
To gain access to this indicator please follow the link below.
Feel free to message me with any questions directly here on TradingView.
The oscillator ranges between (0.1) and 1.1. Generally, the market is oversold while the bands are below 0.2 and is overbought while above 0.8.
The two bands displayed are used to determine short term trend directions and the oversold/undersold state of the applied market. Crossovers of these bands could give a hint to the direction the market is moving.
The fast band (green) is the direct value of where the market is within its calculated range; 1.1 representing the top of range, and -0.1 representing the bottom. Even when this value is near the bottom of the top of the range, the auto oscillator will readjust to create a new range that the market travels within.
The slow band (red) is a lagging version of the fast band which is used to determine the oversold/overbought signals. When this band travels within the oversold and overbought regions the background color will change to signal a warning. If the fast band crosses the slow band within these zones, an opaque signal will appear. These signals are used to catch possible trend reversals.
Breakout Signals (BETA):
Breakout signals are the up and down arrows displayed on the top and bottom of the oscillator. A refined range is generated by the user set 'High Low Length'; it is then displayed by the light gray horizontal lines. If the user set band (fast or slow) returns into the range within a given period (breakout offset) then a signal will generate.
Built in Alerts (must be set up by user):
- Bullish & Bearish Crossovers within the oversold and overbought ranges.
- Bullish & Bearish Breakout alerts (beta)
- Users can also set custom alerts. Example: Fast Band crossing up Value: 0.7
To gain access to this indicator please follow the link below.
Feel free to message me with any questions directly here on TradingView.
Информация о релизе
- Created a dynamic threshold for the Smooth Band to reduce noise & to aid with trend detection.
- Refined Crossover Signals & Alerts
- 'Alternate Smoothing' option which greatly reduces Fast Band fluctuations.
Скрипт с ограниченным доступом
Доступ к этому скрипту разрешён только для пользователей, авторизованных автором, и для этого обычно требуется оплата. Вы можете добавить скрипт в список избранных, но использовать его можно будет только после запроса на доступ и получения разрешения от автора. Свяжитесь с oh92, чтобы узнать больше, или следуйте инструкциям автора ниже.
TradingView не советует платить за скрипт и использовать его, если вы на 100% не доверяете его автору и не понимаете, как он работает. Часто вы можете найти хорошую альтернативу с открытым исходным кодом бесплатно в нашем разделе Скрипты сообщества.
Инструкции от автора
″For access please follow the link below:
https://depthhouse.com/
Хотите использовать этот скрипт на графике?
Внимание: прочтите это перед тем, как запросить доступ.
Creator of DepthHouse Indicators on TradingView!
↣ depthhouse.com/
↣ depthhouse.com/
Отказ от ответственности
Все виды контента, которые вы можете увидеть на TradingView, не являются финансовыми, инвестиционными, торговыми или любыми другими рекомендациями. Мы не предоставляем советы по покупке и продаже активов. Подробнее — в Условиях использования TradingView.