Multiple Non-Linear Regression [ChartPrime]
Inputs:
Users can adjust several parameters:
- Normalization Data Length: Length of data used for normalization.
- Learning Rate: Rate at which the algorithm learns from errors.
- Smooth?: Option to smooth the output.
- Smooth Length: Length of smoothing if enabled.
- Define start coefficients: Initial coefficients for the regression equation.
Data Normalization:
The script normalizes input data to a range between 0 and 1 using the highest and lowest values within a specified length.
Non-linear Regression:
It calculates the regression equation using the input coefficients and normalized data. The equation used is a weighted sum of the independent variables, with coefficients adjusted iteratively using gradient descent to minimize errors.
Error Calculation:
The script computes the error between the actual and predicted values.
Gradient Descent: The coefficients are updated iteratively using gradient descent to minimize the error.
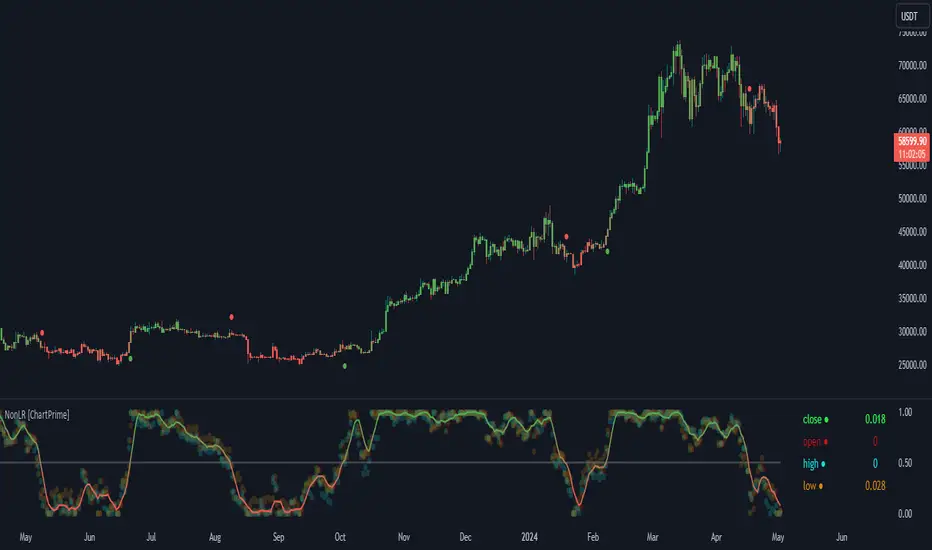
Visualization:
- Plotting of normalized input data (close, open, high, low).
The indicator provides visualization of normalized data values (close, open, high, low) in the form of circular markers on the chart, allowing users to easily observe the relative positions of these values in relation to each other and the regression line. - Plotting of the regression line.
- Color gradient on the regression line based on its value and bar colors.
- Display of normalized input data and predicted value in a table.
- Signals for crossovers with a midline (0.5).
Interpretation:
Users can interpret the regression line and its crossovers with the midline (0.5) as signals for potential buy or sell opportunities.
This indicator helps users analyze the relationship between multiple variables and make trading decisions based on the regression analysis. Adjusting the coefficients and parameters can fine-tune the model's performance according to specific market conditions.
Скрипт с ограниченным доступом
Доступ к этому скрипту разрешён только для пользователей, авторизованных автором, и для этого обычно требуется оплата. Вы можете добавить скрипт в список избранных, но использовать его можно будет только после запроса на доступ и получения разрешения от автора. Свяжитесь с ChartPrime, чтобы узнать больше, или следуйте инструкциям автора ниже.
Обратите внимание, что это приватный скрипт с ограниченным доступом, который модераторы скриптов не проверяли, поэтому ещё не установлено, насколько он соответствует Правилам поведения. TradingView не советует платить за скрипт и использовать его, если вы на 100% не доверяете его автору и не понимаете, как он работает. Часто вы можете найти хорошую альтернативу с открытым исходным кодом бесплатно в нашем разделе Скрипты сообщества.