Graph Reader Pro 4.0
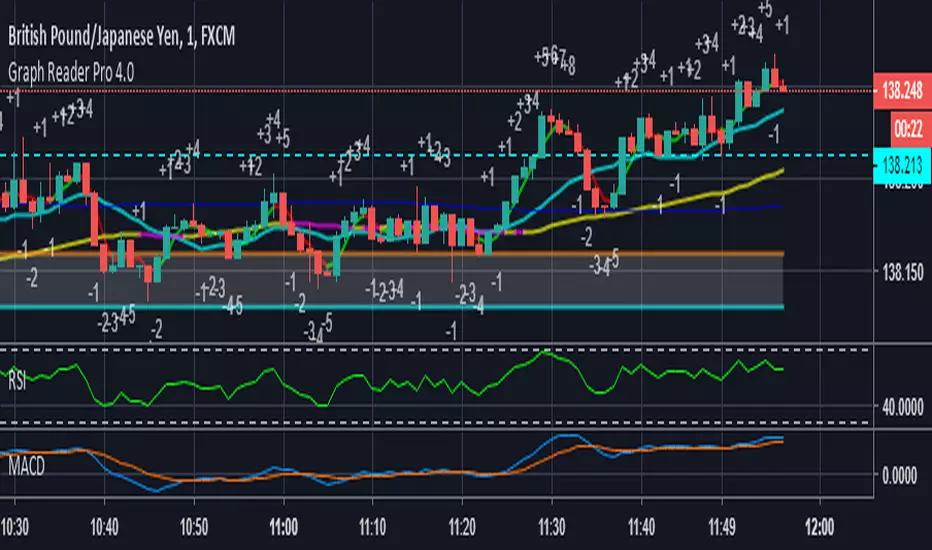
- Automatic CC59 counting that compares the close of the right price bar to that of left price bar in a group of 5 consecutive bars (ignoring 3 bars in the middle). If the right bar closed higher, the count positive number would be printed above the bar. If the right bar closed lower, the count negative number would be printed below the bar. Nine consecutive series of up counts will define the lowest price as CC59 support line and nine consecutive series of down counts will define the highest price as CC59 resistance line. The counted numbers, support and resistance lines are automatically printed on the graph if enabled.
- Draw the high and low levels of the previous day, if enabled. The Previous Day's High and Low are often used as reversal levels in the few future days.
- Draw the price range of each day based on Average Daily Range (ADR) value. These lines only show in graphs with less than daily time frames.
- Draw the price range of each week based on Average Weekly Range (AWR) value. These lines only show in daily graphs.
- Draw simple moving average line SMA3, with ability to change the line color based on increasing or decreasing MACD value.
- Draw simple moving average line SMA50, with ability to change the line color based on its own increasing or decreasing value.
- Locate the price gaps in the graphs of stocks and indexes. The opened gaps are often closed later on. Hence, they are milestones for the price to come back and close them up.
- Draw a ribbon of simple moving average lines consisting of SMA3, SMA4, SMA5, SMA6 and SMA7, if enabled. Twisting of the SMA ribbon gives a visual signal for price reversal.
- Draw a set of other simple moving average lines such as SMA13, SMA200, SMA800 (if enabled).
- Paint the background areas with active Forex trading of Asian, London, and New York sessions, if enabled.
- Locate an engulfing bar that cover the previous bar with a body portion less than 50% of its range.
- Locate an anchor bar that has the range (High - Low) larger than those 14 bars earlier.
- Print "RSI>70" and "RSI<70" for RSI(14) that crossed above 70 % and below 70 %.
- Print "RSI<30" and "RSI>30" for RSI(14) that crossed below 30 % and above 30 %.
- Print "RSI<50" and "RSI>50" for RSI(14) that crossed below 50 % and above 50 %.
- Print "MACD>Sig" and "MACD<Sig" for MACD(12,26,9) that crossed above and below their own SMA9.
- Print "MACD>0" and "MACD<0" for MACD(12,26,9) that crossed above and below zero.
- Print "Max" and "Min" for local maximum and local minimum bars.
- Print "SMA5>13" and "SMA5<13" for SMA(5) crossed above and below SMA(13).
- Print "Highest" and "Lowest" at the highest and lowest prices in a group of configurable number of bars earlier.
=================================================================================================
The source code of Graph Reader Pro 4.0 custom indicator is protected.
Only invited TradingView members can apply this indicator to their forex, crypto currency and stock price graphs.
Lifetime invitation is for 100 USD with free future upgrades and online supports.
Rental invitation is for 10 USD/month with free future upgrades and online supports.
Paypal, Bank transfer and Bitcoin payments are welcome.
For more informaton please contact the author (DrGraph or Nimit Chomnawang, PhD) via TradingView private chat
or in the comment field below.
=================================================================================================
How to install the script:
------------------------------
*Go to the bottom of this page and click on "Add to Favorite Scripts".
*Remove older version Graph Reader Pro by clicking on the "X" botton behind the indicator line at the top left corner of the chart window.
*Open a new chart at [ tradingview.com/chart/ ] and click on the "Indicators" tab.
*Click on the "Favorites" tab and choose "Graph Reader Pro 4.0".
*Right click anywhere on the graph, choose "Settings".
*In "Style" tab, choose the Dark Theme.
*In "Scales" tab, select Decimal Places = 1/100000.
*In "Background" tab, uncheck "Indicator Arguments" and "Indicator Values".
*In "Timezone/Sessions" tab, choose Time Zone = Your local time.
*At the bottom of settings window, click on "Template", "Save As...", then name this theme of graph setting for future call up such as "Graph Reader Pro".
*Click OK.
For free TradingView plan, you can add two more indicators to the chart. That means you may add RSI and MACD indicators with same parameters as those setup in Graph Reader Pro to your graph. DrGraph regularly publishes his educational ideas on using features provided in Graph Reader Pro for profitable investments. You can follow him for how to use the tools in trading stocks, forex, and binary options.
Please do not ask about access to use scripts in the script's comment section.
Скрипт с ограниченным доступом
Доступ к этому скрипту разрешён только для пользователей, авторизованных автором, и для этого обычно требуется оплата. Вы можете добавить скрипт в список избранных, но использовать его можно будет только после запроса на доступ и получения разрешения от автора. Свяжитесь с nimit.chomnawang, чтобы узнать больше, или следуйте инструкциям автора ниже.
Обратите внимание, что это приватный скрипт с ограниченным доступом, который модераторы скриптов не проверяли, поэтому ещё не установлено, насколько он соответствует Правилам поведения. TradingView не советует платить за скрипт и использовать его, если вы на 100% не доверяете его автору и не понимаете, как он работает. Часто вы можете найти хорошую альтернативу с открытым исходным кодом бесплатно в нашем разделе Скрипты сообщества.