INVITE-ONLY SCRIPT
FEJ - DogeMargin
Обновлено
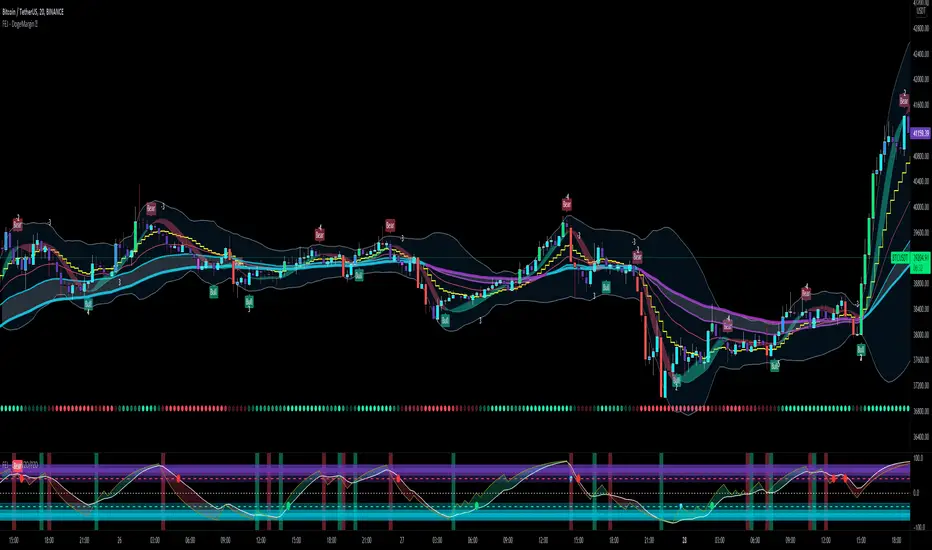
FEJ - DogeMargin ist ein All-in-One Indikator.
Mit dem ihr euch praktisch das Upgrade auf eine bezahlte Tradingview Version sparen könnt.
- Wave-Detector: Bestehend aus einem innovativen Wave-Trenddetector mit dessen hilfe es sehr leicht ist einen Trendwechsel und die vorraussichtliche Stärke des kommenden Moves zu erkennen.
- NMA: Eine dynamische Trendlinie um die stärke der Signale zu überprüfen.
- Channel: Um potenzielle Trendwenden bzw. Überkaufte oder Überverkaufte Situationen zu erkennen.
- Golden- & Deathcross: SMA basierende Crosses um potenzielle Trendwendepunkte zu erkennen und bestehende Signale zu überprüfen. Die SMA Crosses sind in einem festgelegten Timeframe, welcher sich in den Einstellungen anpassen lässt. Die SMA´s sind optional einblendbar. In einem Update folgen noch MACD Crosses.
- Volume Candles: Dieser passt die Farbe der Candles entsprechend dem aktuellen Volumen und dessen Richtung an.
Dunkel Violett - Der Preis sinkt und das Volumen ist größer als 200% des Durchschnitts der letzten 20 Tage - Stark Bearish
Violett - Der Preis sinkt und das Volumen ist zwischen 50% und 200% des Durchschnitts der letzten 20 Tage - Volumen ist weder stark noch schwach
Helles Violett - Der Preis sinkt und das Volumen ist geringer 50% des Durchschnitts der letzten 20 Tage - Wenig Support für die aktuellen Preisbewegungen.
Aqua - Der Preis steigt und das Volumen ist größer als 200% des Durchschnitts der letzten 20 Tage - Stark Bullish
Blau - Der Preis steigt und das Volumen ist zwischen 50% und 200% des Durchschnitts der letzten 20 Tage - Volumen ist weder stark noch schwach
Helles Blau - Der Preis steigt und das Volumen ist geringer 50% des Durchschnitts der letzten 20 Tage - Wenig Support für die aktuellen Preisbewegungen.
- S & R Lines: Dieser Indikator zeigt die für diesen Timeframe aktuellen Support und Resistance Linien an.
- EMA Ribbons: Dieser Indikator zeigt ein Ribbon für den aktuellen Timeframe an.
Wave
Mit Hilfe der Welle in der Mitte lassen sich Trendwenden erkennen.Die Trendwende ist besonders stark, wenn das Signal bei einem Bull-Signal unterhalb der gelben NMA-Line liegt ; bei einem Bear-Signaloberhalb der gelben NMA-Linie liegt.
Wenn Kurs in folge eines Signals nach der NMA schließt, deutet das auf einen Trendwechsel hin. Bis dahin
Mit hilfe des Dogeprotocol lassen sich diese Signale noch weiter verbessern undgegenprüfen
Channel
NMA
Golden- & Deathcross
Zeigt an wo sich entweder ein SMA Golden- oder Death-Cross befindet
WICHTIG: Der TimeFrame für die Crosses ist festgelegt - Standardmäßig auf 4h (240m)
Es macht am meisten Sinn, den TF auf 1/10 deines Beobachtungszeitramens zu stellen.
2x SMA´s
Volume Candles
S & R Lines
EMA Ribbos
____________________________________________________________________________________________________________________________
English:
FEJ - DogeMargin is an all-in-one indicator.
With which you practically do that Upgrading to a paid Tradingview version can save you money.
- Wave detector: Consists of an innovative wave trend detector with its help it is very easy to change the trend and the anticipated Recognize the strength of the upcoming move.
- NMA: A dynamic trend line to check the strength of the signals.
- Channel: Around potential trend reversals or overbought or oversold situations to recognize.
- Golden & Death cross: SMA based crosses around potential trend turning points to recognize and to check existing signals. The SMA Crosses are in a fixed timeframe, which can be found in the settings can be adjusted. The SMAs can optionally be faded in. MACD Crosses will follow in an update.
- Volume Candles: This adjusts the color of the candles according to the current volume and its direction.
Dark Purple - The price is falling and the volume is greater than 200% of the Last 20 Day Average - Strongly Bearish
Purple - The price is going down and the volume is between 50% and 200% of the Last 20 days average - volume is neither strong nor weak
Light purple - the price goes down and the volume is less than 50% of the Average of the last 20 days - Little support for the current ones Price movements.
Aqua - The price goes up and the volume is greater than 200% of the Last 20 days average - Strong Bullish
Blue - The price is increasing and the volume is between 50% and 200% of the Last 20 days average - volume is neither strong nor weak
Light blue - the price goes up and the volume is less 50% of the Average of the last 20 days - Little support for the current ones Price movements.
- S & R Lines: This indicator shows the current support and for this timeframe
Resistance lines on.
- EMA Ribbons: This indicator shows a ribbon for the current timeframe.
Wave
Trend reversals can be seen with the help of the wave in the middle.
The turnaround is particularly strong when the signal is at one
Bull signal is below the yellow NMA line; on a bear signal is above the yellow NMA line.
If course closes on a signal after the NMA , it indicates one
Change of trend. Until then
With the help of the Dogeprotocol, these signals can be improved even further
double check
Channel
NMA
Golden & Death Cross
Shows where either a SMA golden or death cross is located
IMPORTANT: The timeframe für crosses is fixed - by default to 4h (240m)
It makes the most sense to set the TF to 1/10 of your observation timeframe.
2x SMAs
Volume candles
S&R Lines
EMA Ribbos
Информация о релизе
Updated TitleИнформация о релизе
Der Indikator wird am besten in Kombination mit dem FEJ - DogeProtocol genutzt.Updates:
- Layout
- "Dynamic Resistance & Support" nach FEJ - DogeMA verschoben
- Filler für "EMA Ribbon" hinzugefügt
- Level Band hinzugefügt
- Ein Band um die übergeordnete Trendstärke zu erkennen. Dieses hat die Funktion zwischen kleineren Timeframes und größeren Timeframes zu wechseln.
------------------------------------------------------------------------------------------------------------------------------------------------------------------------------------------------------------------------------------------------------------------------------------
The indicator is best used in combination with the FEJ - DogeProtocol.
Updates:
- layout
- "Dynamic Resistance & Support" moved to FEJ - DogeMA
- Added filler for "EMA Ribbon"
- Level band added
- A band to recognize the overall trend strength. This has the function of switching between smaller timeframes and larger timeframes.
Информация о релизе
Changed the pictureИнформация о релизе
Changed Default Setting:- Disabled Volume Candle Overlay
- Disabled Signal Arrows Overlay
Информация о релизе
Changed - PictureИнформация о релизе
Some optical Updates at the EMA-RibbonsИнформация о релизе
Little correctionИнформация о релизе
German:Großes Update:
- Signal Zahlen (Default) von -4 bis +4, je höher respektive niedriger die Zahl ist, desto stärker ist das Signal. Trotz allem ist das einzelne Signal mit anderen zu überprüfen und auf den TimeFrame zu achten.
- Symbole als Signale (Optional):
XCross - Starke Flagge
Cross - Schwache Flagge
Dreieck - Schwaches Signale des DogeProtocoll
Diamond - Starkes Signal des DogeProtocoll
- Grüner Hintergrund (Default) / Optional als Kreise anzuzeigen:
Ein starkes Signal zum Kauf, der Einstieg ist oft sehr gut, aber der Ausstieg kommt oft relativ spät.
- Alarme für viele Signale hinzugefügt.
Entfernt:
- Golden- und Death-Crosses
- Volume Candles
____________________________________________________________________________________
English:
Major Update:
- Signal numbers (default) from -4 to +4, the higher respectively lower the number is, the stronger the signal is. Despite everything, check the individual signal with others and pay attention to the TimeFrame.
- Symbols as signals (optional):
XCross - Strong flag
Cross - Weak flag
Triangle - Weak signal of the DogeProtocoll
Diamond - Strong signal of the DogeProtocoll
- Green background (default) / Optional to display as circles:
A strong signal to buy, the entry is often very good, but the exit often comes relatively late.
- Alarms added for many signals.
Removed:
- Golden and death crosses
- Volume Candles
Translated with DeepL.com/Translator (free version)
Информация о релизе
Bugfix:In dem letzten Update hat sich ein Berechnungsfehler eingeschlichen, welchen ich nun korrigiert habe.
Durch diesen war der Offset leider um -1 erhöht auf insgesamt -2. Mit dem Update reduziere ich das wieder auf das gewohnte -1, sodass die Flags nur noch eine Kerze verzögert kommen.
Für die Einstellung der Farben benötige ich leider noch etwas mehr Zeit.
__________________________________________________________________________________
Bugfix:
In the last update a calculation error crept in, which I have now corrected.
Unfortunately, this increased the offset by -1 to a total of -2. With the update, I reduce this back to the usual -1, so that the flags are only delayed by one candle.
For the adjustment of the colors I need unfortunately still some more time.
__________________________________________________________________________________
Hier noch ein kleines Bild um die Stärke der Nummern aus dem letzten Update zu verdeutlichen.
Here is another small picture to illustrate the strength of the numbers from the last update.
Информация о релизе
German:Wichtiges Update:
- Special K: Eine neue Funktion um Trendwechsel und -stärke zu erkennen. Die Hauptdarstellung sind die Grünen und Roten Punkte unterhalb des Charts, diese werden in unterschiedlichen Farbstärken angezeigt.
Optional ist es möglich die Farbe der Candles an die Farben des Special K anpassen.
Außerdem wird ein Trendwechsel durch eine +/- 3 angezeigt. Ein weiteres Werkzeug um den perfekten Zeitpunkt zum ein- und aussteigen zu erkennen!
Die Farben für das Special K Band lässt sich aktuell nicht einstellen.
- Umstrunkturierung der Nummer-Gewichtung: Die schwächeren Signale (Weak Flag & Weak Protocol) behalten +/- 1, die starken Signale (Strong Flag & Strong Protocol) erhalten +/- 2 und Special K kommt mit +/- 3 hinzu.
Das bedeutet, das eine neue Spanne von +/- 1 bis hin zu +/- 9 möglich ist, wobei die Signale mit der größe der Zahl (+/-) immer stärker werden.
Ebenfalls kann es Sinn machen, Zahlen die in kurzer Zeit aufeinander folgen in Kombination zu betrachten.
- Alarme: Kombinierte-Alarme für +/- 5 bis +/- 9 wurden hinzugefügt und +/- 1 wurde entfernt.
Solo-Alarme wurden entfernt, der Grund dafür sind tiefgreifende Limitationen im Programmier-Umfang von TradingView.
-- Aufgrund von tiefgreifenden Limitationen im Programmier-Umfang von TradingView, musste ich die Solo-Alarme und die EMA-Ribbons entfernen. --
BugFix: Die Möglichkeit Farben einzustellen wurde wieder hinzugefügt! Diese können alle im "Inputs" Fenster bearbeitet werden.
______________________________________________________________________________________________________________________________________
English:
Important update:
- Special K: A new feature to detect trend changes and strength. The main display is the green and red dots below the chart, these are displayed in different color strengths.
Optionally it is possible to adjust the color of the candles to the colors of the Special K.
In addition, a trend change is indicated by a +/- 3. Another tool to recognize the perfect time to enter and exit!
The colors for the Special K band cannot be adjusted at the moment.
- Re-ranking of the number weighting: The weaker signals (Weak Flag & Weak Protocol) keep +/- 1, the strong signals (Strong Flag & Strong Protocol) get +/- 2 and Special K is added with +/- 3.
This means that a new range of +/- 1 up to +/- 9 is possible, whereby the signals become stronger with the size of the number (+/-).
It can also make sense to consider numbers that follow each other in a short time in combination.
- Alarms: Combined alarms for +/- 5 to +/- 9 have been added and +/- 1 has been removed.
Solo alarms have been removed due to deep limitations in the programming scope of TradingView.
-- Due to deep limitations in the programming scope of TradingView, I had to remove the solo alarms and the EMA ribbons. --
BugFix: The possibility to set colors was added again! These can all be edited in the "Inputs" window.
Информация о релизе
Nur das Bild geändert um den Haus Regeln zu entsprechen. Heikin Ashi Cadles sind nicht erlaubt.Only the image changed to comply with the house rules. Heikin Ashi Cadles are not allowed.
Информация о релизе
German:- Informationstexte für so gut wie jede Funktion direkt im Setup Fenster, das ganze in Deutsch und Englisch.
Einfach mit der Maus über das kleine "I" gehen und kurz warten.
*Eine Bar Color Überschreibung mit deren Hilfe sich bestimmte Volumen Situationen einfach und auf einen Blick erkennen lassen.
1. Neutrale Volumenzone - In Default Einstellung zu erkennen an den Standard Farben (Col 5 & 6).
2. Das Volumen ist größer als das durchschnittliche down oder up Volumen - In Default Einstellung zu erkennen an Blau (Up) und Pink (Down), (Col 3 & 4).
3. Eine Climax Situation wird angezeigt. Diese Kennzeichnet meist das Ende oder den Anfang eines Bull/Bear Cycle und zeichnet sich durch große Volumen Spitzen aus. - In Default Einstellung zu erkennen an Grün (Bull) und Rot (Bear), (Col 1 & 2).
-----------------------------------------------------
English:
*Information texts for almost every function directly in the setup window, the whole thing in German and English.
Just move the mouse over the small "I" and wait a moment.
*A bar color override with the help of which certain volume situations can be recognized easily and at a glance.
1. neutral volume zone - in default setting to be recognized by the standard colors (Col 5 & 6).
2. the volume is larger than the average down or up volume - in default setting to be recognized by blue (up) and pink (down), (Col 3 & 4).
3. a Climax situation is displayed. This usually indicates the end or the beginning of a Bull/Bear Cycle and is characterized by large volume peaks. - In the default setting, this is indicated by green (Bull) and red (Bear), (Col 1 & 2).
Информация о релизе
Just the PictureИнформация о релизе
Big Update:German:
- Update Script Version zu PineScript V5
- Um den Indikator zu nutzen muss nun bestätigt werden, dass auch der FEJ - DogeMargin, wie jeder Indikator, nicht zu 100% genau sein kann und sich die Gesamtperformance mit den Marktbedingungen ändern kann und ein intelligentes Trade Management essenziell ist.. Auch wenn der FEJ - DogeMargin die Chancen auf bessere Trades erhöht.
- Bei der Signalbewertung wurde die "1" entfernt, da diese zu falschen Interpretationen geführt hat. Die Range geht nun von 2 bis 9.
- Die Shapes für die Signalbewertung wurde entfernt, damit das Script schlanker wird..
- Die Band TrendArrows wurden entfernt, da sie eine bereits vorhandene Information erneut dargestellt haben.
- Ebenfalls wurde die Strong-Buy-Background Funktion entfernt, um das Script schlanker zu gestalten.
------------------------------------------------------------------------------------------------------------------------------------------------------------------------------------
English:
- Update Script Version to PineScript V5
- In order to use the indicator it must now be confirmed that the FEJ - DogeMargin, like any indicator, cannot be 100% accurate and the overall performance can change with market conditions and intelligent trade management is essential. Even though the FEJ - DogeMargin increases the chances of better trades.
- The "1" has been removed from the signal rating as it led to misinterpretation. The range now goes from 2 to 9.
- The Shapes for the signal evaluation was removed, so that the Script becomes more slender.
- The Band TrendArrows have been removed, because they were displaying an already existing information again.
- Also removed the Strong-Buy-Background function to make the script leaner.
Информация о релизе
- Added Alerts for crssing with the Bands (Bull/Bear & Rejection/Breakout)- Sorted the Alarms alphabeticly
Информация о релизе
- Extra Alerts addedСкрипт с ограниченным доступом
Доступ к этому скрипту разрешён только для пользователей, авторизованных автором, и для этого обычно требуется оплата. Вы можете добавить скрипт в список избранных, но использовать его можно будет только после запроса на доступ и получения разрешения от автора. Свяжитесь с FiatEaterJens, чтобы узнать больше, или следуйте инструкциям автора ниже.
TradingView не советует платить за скрипт и использовать его, если вы на 100% не доверяете его автору и не понимаете, как он работает. Часто вы можете найти хорошую альтернативу с открытым исходным кодом бесплатно в нашем разделе Скрипты сообщества.
Хотите использовать этот скрипт на графике?
Внимание: прочтите это перед тем, как запросить доступ.
Отказ от ответственности
Все виды контента, которые вы можете увидеть на TradingView, не являются финансовыми, инвестиционными, торговыми или любыми другими рекомендациями. Мы не предоставляем советы по покупке и продаже активов. Подробнее — в Условиях использования TradingView.