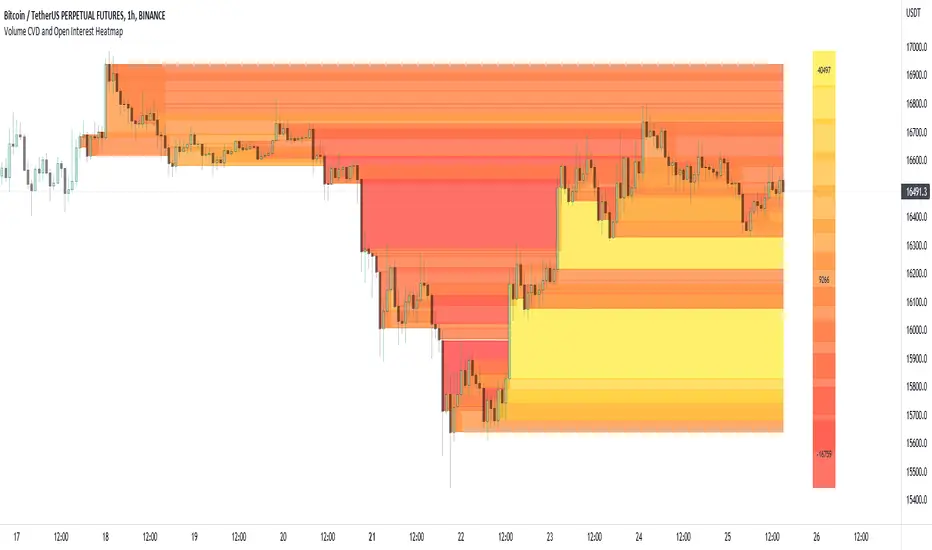
Volume CVD and Open Interest Heatmap
- Volume - the total volume of transactions, buys and sells
- Up Volume - the total volume from buys only
- Down Volume - the total volume from sells only
- Up/Down Volume (Net) - the difference in the Buy Volume and Sell Volume
- Cumulative Delta - the sum of the up/down volume for the previous 14 bars
- Cumulative Delta EMA - a smoothed average of the sum of the up/down volume for the previous 14 bars, over a 14 period EMA
- Open Interest - a user defined ticker, whose value is added to the plot, while this is designed to be used with Open Interest tickers, you can actually choose any ticker you want, perhaps you want to see DXY while charting Bitcoin!
You can define the lookback period, though you should make sure your timeframe for volume source data, is high enough to accommodate the lookback. TradingView will only fetch 5000 candles worth of data, so at 1 min volume data, you can only lookback 83 hours.
While similar, Volume and Open Interest are not the same. To me the simplest explanation is Volume shows the trades that have been executed and the buy/sell direction, while Open Interest shows the value of open trades that are yet to be completed.
Volume shows strength, sentiment and volatility .
Open Interest does not show direction, but does indicate momentum and liquidity in the market.
With this novel way of visualizing these, you can also now determine where all that liquidity and positions came from and therefore might have resting liquidity below.
Скрипт с ограниченным доступом
Доступ к этому скрипту разрешён только для пользователей, авторизованных автором, и для этого обычно требуется оплата. Вы можете добавить скрипт в список избранных, но использовать его можно будет только после запроса на доступ и получения разрешения от автора. Свяжитесь с Texmoonbeam, чтобы узнать больше, или следуйте инструкциям автора ниже.
Обратите внимание, что это приватный скрипт с ограниченным доступом, который модераторы скриптов не проверяли, поэтому ещё не установлено, насколько он соответствует Правилам поведения. TradingView не советует платить за скрипт и использовать его, если вы на 100% не доверяете его автору и не понимаете, как он работает. Часто вы можете найти хорошую альтернативу с открытым исходным кодом бесплатно в нашем разделе Скрипты сообщества.