INVITE-ONLY SCRIPT
Algohub (Nephew_Sam_)
Обновлено
(republished as previous version did not meet Tradingview house rules)
This indicator marks out majority Algohub concepts - which will help your system become fully mechanical if it isn't already.
Here are all of the concepts and features included in the indicator:
Timeframe
- You can select the timeframe of the indicator (has to be higher or equal to the chart timeframe)
- Min option is the minimum timeframe to show the indicator. If you show daily structure on 1m chart, you can run into a timeout error so keep it close to the chart timeframe.
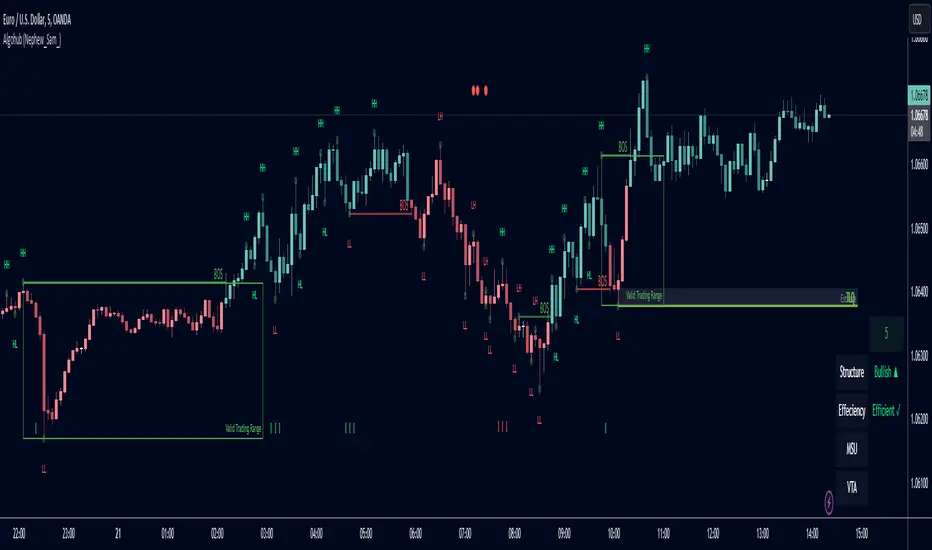
Structure
The structure is calculated using a combination of candle patterns (ie. pivot top = Bullish x3-Bearish-Bullish) and pivot points (from strength 1 to 3) and marks out circle labels after a new HH or LL
ILQ - Inducement Liquidity concept
In a bearish example this is the most recent structure high.
TLQ
In a bearish example this is the second most recent structure high.
This is also what helps define our structure direction. If broken, the structure changes (bullish / bearish) and plots a bos line.
EPA - Efficient price action
When price returns back to previous structure point after bos. Similar to an ICT breaker.
Note: It might be a little, just a little buggy if you have set your indicator timeframe to higher than the chart timeframe.
Extremes Zones
The final zone to find a trade entry before a structural shift. These are wick of the TLQ candle. This is select the wick of the current timeframe candle even if indicator is set to higher timeframe.
MSU
Tiny arrow labels at the bottom of your chart. Plots the arrows when price is between an ILQ and TLQ
VTA
Valid trading range. This is when we get some sort of a structure pattern. Plots a box when price induces previous structure point and then breaks structure in the opposite direction. Here are the patterns:
Bull VTA - HH-LL-HH
Bear VTA - LL-HH-LL
Bull Strict VTA - LL-HH-LL-HH
Bear Strict VTA - HH-LL-HH-LL
Bar colors
Changes the bar color based on the structure to all green/red.
Note: for this to work, you will have to right click on the indicator, then under visual order select 'bring to front'
Table
This table plots the structure stats/data
1. If structure is bullish / bearish
2. If price is efficient or not
3. If there is an MSU
4. If price is inside a VTA
This indicator marks out majority Algohub concepts - which will help your system become fully mechanical if it isn't already.
Here are all of the concepts and features included in the indicator:
Timeframe
- You can select the timeframe of the indicator (has to be higher or equal to the chart timeframe)
- Min option is the minimum timeframe to show the indicator. If you show daily structure on 1m chart, you can run into a timeout error so keep it close to the chart timeframe.
Structure
The structure is calculated using a combination of candle patterns (ie. pivot top = Bullish x3-Bearish-Bullish) and pivot points (from strength 1 to 3) and marks out circle labels after a new HH or LL
ILQ - Inducement Liquidity concept
In a bearish example this is the most recent structure high.
TLQ
In a bearish example this is the second most recent structure high.
This is also what helps define our structure direction. If broken, the structure changes (bullish / bearish) and plots a bos line.
EPA - Efficient price action
When price returns back to previous structure point after bos. Similar to an ICT breaker.
Note: It might be a little, just a little buggy if you have set your indicator timeframe to higher than the chart timeframe.
Extremes Zones
The final zone to find a trade entry before a structural shift. These are wick of the TLQ candle. This is select the wick of the current timeframe candle even if indicator is set to higher timeframe.
MSU
Tiny arrow labels at the bottom of your chart. Plots the arrows when price is between an ILQ and TLQ
VTA
Valid trading range. This is when we get some sort of a structure pattern. Plots a box when price induces previous structure point and then breaks structure in the opposite direction. Here are the patterns:
Bull VTA - HH-LL-HH
Bear VTA - LL-HH-LL
Bull Strict VTA - LL-HH-LL-HH
Bear Strict VTA - HH-LL-HH-LL
Bar colors
Changes the bar color based on the structure to all green/red.
Note: for this to work, you will have to right click on the indicator, then under visual order select 'bring to front'
Table
This table plots the structure stats/data
1. If structure is bullish / bearish
2. If price is efficient or not
3. If there is an MSU
4. If price is inside a VTA
Информация о релизе
Structure label size fixИнформация о релизе
Bug fixИнформация о релизе
Doji candle bug fixesИнформация о релизе
Bug fixИнформация о релизе
Bug fix for bosИнформация о релизе
Added indicator start date - You can use this if price is in a range and you want to see the recent structureИнформация о релизе
Added HH/LL labelsИнформация о релизе
Bug fix for structure bar colorИнформация о релизе
Bug fixИнформация о релизе
Bug fixesИнформация о релизе
Bug fixИнформация о релизе
Bug fixИнформация о релизе
Bug fixИнформация о релизе
Candle color bug fixСкрипт с ограниченным доступом
Доступ к этому скрипту разрешён только для пользователей, авторизованных автором, и для этого обычно требуется оплата. Вы можете добавить скрипт в список избранных, но использовать его можно будет только после запроса на доступ и получения разрешения от автора. Свяжитесь с nephew_sam_, чтобы узнать больше, или следуйте инструкциям автора ниже.
TradingView не советует платить за скрипт и использовать его, если вы на 100% не доверяете его автору и не понимаете, как он работает. Часто вы можете найти хорошую альтернативу с открытым исходным кодом бесплатно в нашем разделе Скрипты сообщества.
Хотите использовать этот скрипт на графике?
Внимание: прочтите это перед тем, как запросить доступ.
Отказ от ответственности
Все виды контента, которые вы можете увидеть на TradingView, не являются финансовыми, инвестиционными, торговыми или любыми другими рекомендациями. Мы не предоставляем советы по покупке и продаже активов. Подробнее — в Условиях использования TradingView.