Ghost Feed
Ghost Feed is a drawing tool that helps you extrapolate recent price actions. Although it is not meant to give you a precise picture of what's coming, it can provide you with valuable insights into your suggestions about future price movements.
In this solution you'll learn:
! Important: Ghost Feed is a drawing tool, not an indicator or strategy. It is meant to accompany your analysis — not substitute it. Do not use Ghost Feed drawings as a single reliable source of information for forecasting.
What is Ghost Feed
As mentioned earlier, Ghost Feed is a technical analysis drawing tool. It helps with forecasting assets' future price movements, and entry and exit points for trades. It uses previous data as well as your inputs to project the likelihood of certain candles and their possible outlook.
! Note: Ghost Feed is designed for drawing the standard candles. You can experiment using it with other chart types, but we suggest avoiding it so as not to skew the data.
Ghost Feed projects probable standard candles that might occur in the chosen price movement direction.
To better understand how the drawing works, let's move further and look how you can apply its capabilities to your charting.
How to use Ghost Feed
With Ghost Feed, you can see how candles might look in a particular direction, as well as the possible highs and lows of these candles according to the settings of this drawing tool.
To start using it, find Forecasting and measurements tools on the drawings toolbar on the left side of the chart and choose Ghost Feed.

Then choose any place on the chart that will be the starting point for the Ghost Feed to start projecting candles.
You can use Ghost Feed in any direction: up, down, or even backwards. It draws candles in any direction you choose. Logically, it would be impossible for the forecasting tool to construct candles in an unusual direction, but it sometimes does this. That's why it's designed as a visualization tool to use only after you've conducted your analysis and decided on a future price direction.

Simplifying the steps when using the Ghost Feed:
- Map out the potential price action
- Adjust the Ghost Feed settings
- Study what that price action might look like
Ghost Feed settings
To call for the Ghost Feed settings, double-click on the Ghost candles. Now, when the settings window opens, you can set the following parameters.
- Inputs
- Style
- Coordinates
- Visibility
Let’s go through each of these.
Inputs
In Inputs, you can set only two, but extremely important parameters.
- Avg HL in minticks (Average high/low in minimum ticks). Allows you to set the average value of the highest and lowest prices of each candle. Ticks are the minimum price movements the stock can make — for those listed on Nasdaq and the NYSE, the tick size is generally $0.01.
- Variance. Sets the distance between candles, measured in ticks as well.

? Example: Charting the TSLA symbol, which is traded on Nasdaq. You set Avg HL in minticks to 100. Every Ghost candle now will have $1 difference between its highest and lowest prices. If the Variance is set 100 too, the average distance between candles will be $1 also.
Style
Here, you can change ghost candles' bodies' colors, their edges colors, wins colors, and transparency.

Coordinates
On this tab, you can set the price and time scales' values as the starting points for the price directions in which you project the price to move.
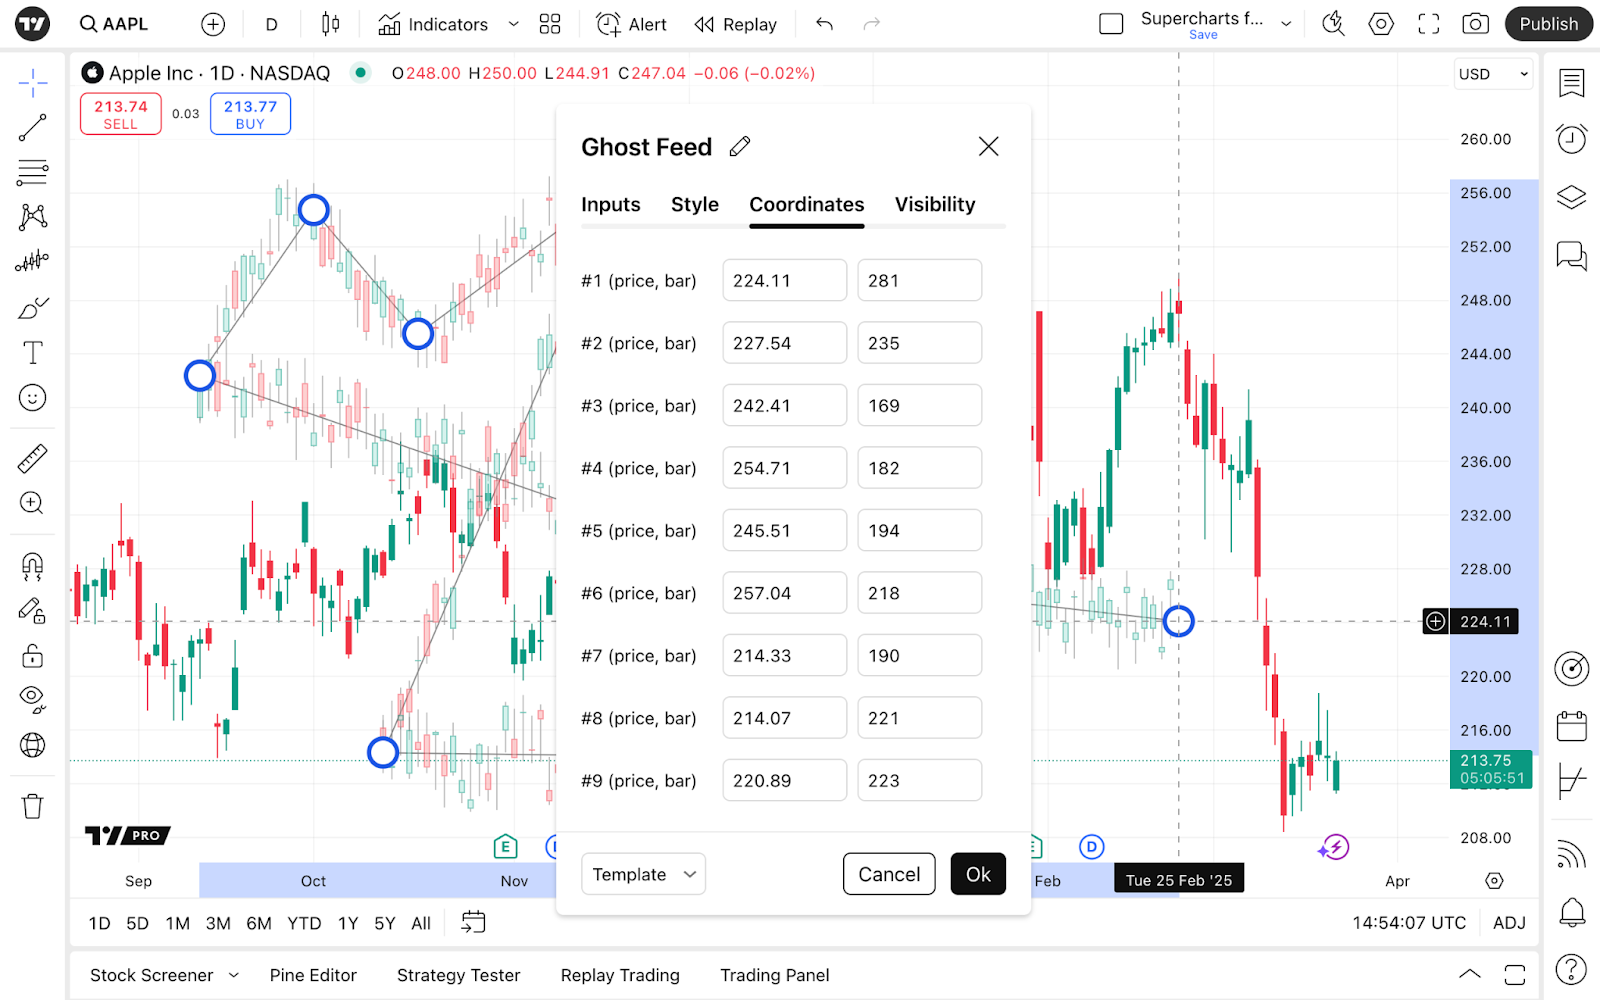
In the left field, you can set the asset’s price — by changing it, you change the starting point in price.
The right field allows changing the starting point in particular bars. By default, the latest bar is counted as the 300th.
? Example: If you have a daily timeframe on your chart and set the right field in the Coordinates settings to 200, the starting point for the ghost candles would be 100 days back from the current date. If you set this field to 330, the ghost candles will appear 30 days after the current date.
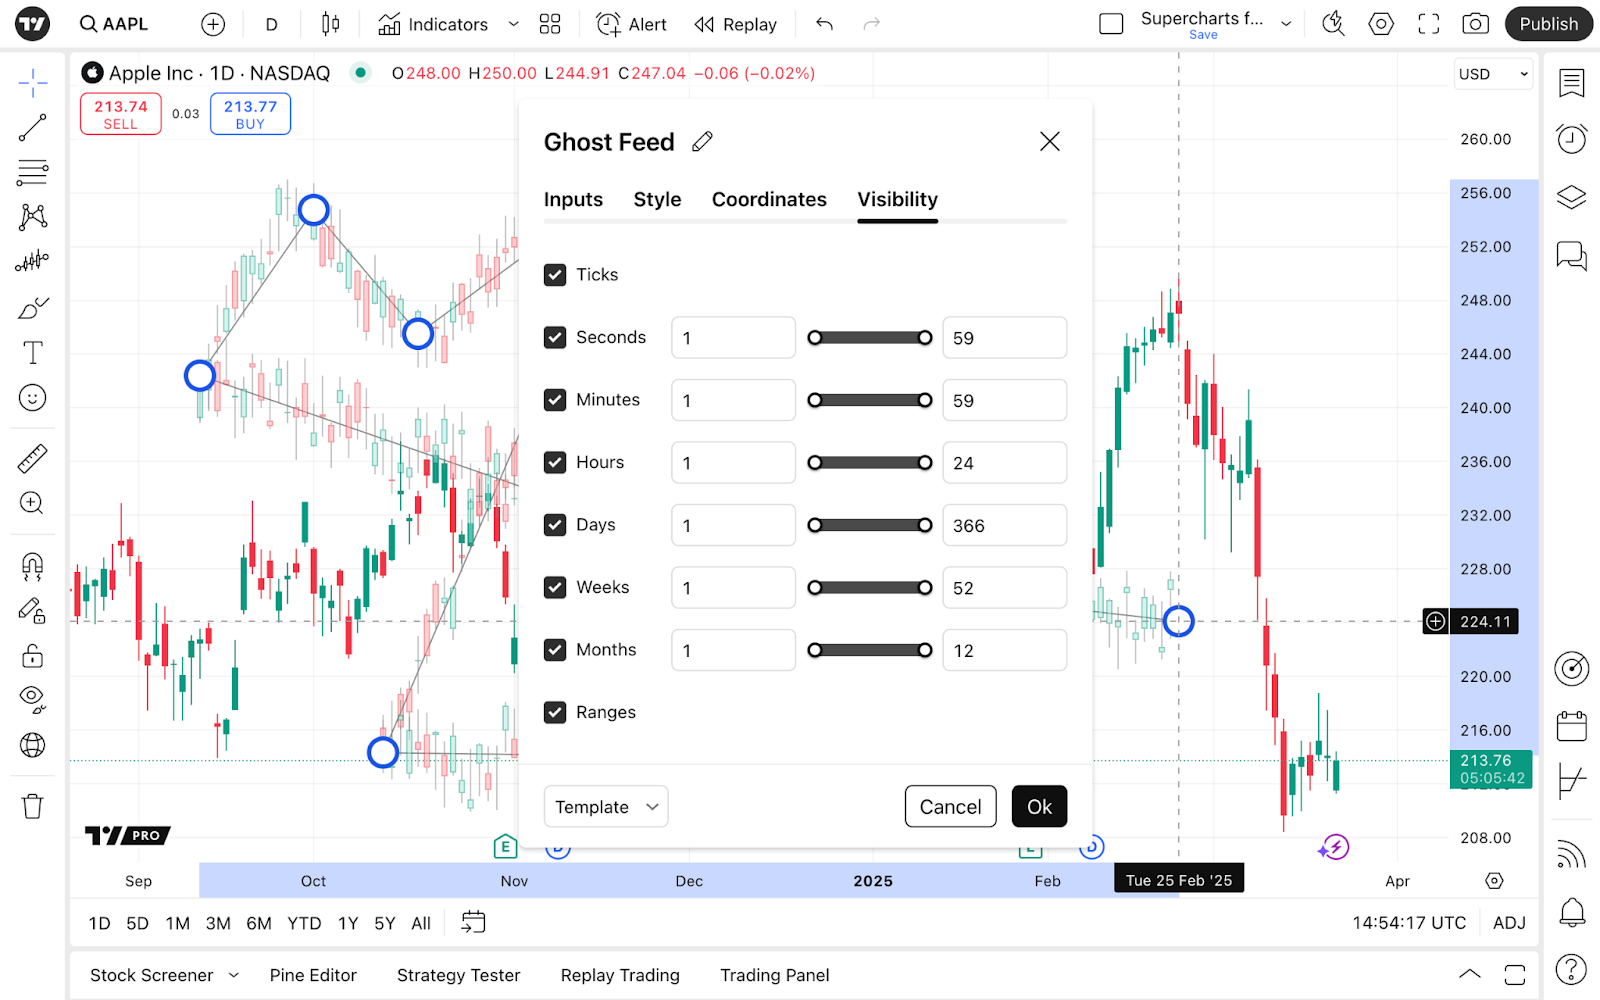
Visibility
As the Ghost Feed is a drawing tool, if you have changed the timeframe, these drawings remain. Say, you were on a daily chart and now want to move to a 4-hour chart. If you do that, Ghost feed will stay unchanged.
For your convenience, when you change timeframes and don't need the Ghost Feed on every of them, remove the time intervals for which you don't use this tool.
Additional Ghost Feed settings and tips
Keep in mind that you can always move the Ghost Feed by simply dragging it from one place to another with a left click.
Right click on the Ghost candles — additional settings will appear.

- Save the drawings as a template for later use.
- When using multiple drawings, choose the positioning of the ghost feed compared to others with Visual order.
- Visibility on interval allows you to change the Ghost Feed visibility like in Visibility settings but in more general terms.
- The Object tree helps organise your chart by combining multiple drawings into groups.
- Clone and Copy the Ghost Feed. Use it on other charts with other symbols — it keeps all the settings.
- Lock it so it's not movable with the left click.
- Hide it or remove it when your analysis is completed.
The last thing to mention is that drawings can greatly benefit your analysis and help with evaluating your suggestions. Ghost Feed can be very helpful, just don't trust it much, as trading always imposes some level of uncertainty.
Also read: