What are TradingView layouts? A quick guide
A well-structured chart layout is crucial for efficient trading and market analysis. In this article, we'll share the best ways to organize your chart layouts, save and customize them, and make the most of TradingView Supercharts. You'll learn the following:
What are layouts?
A chart layout is its look, fill, design, and all of the chart settings, and even includes drawings that you apply to the chart. It is basically your workspace, and after you make changes to the chart, you can save them as a layout for later use.
Each layout can be customized according to your specific needs. So, when switching between tasks, the only thing you need to do is change the layout.
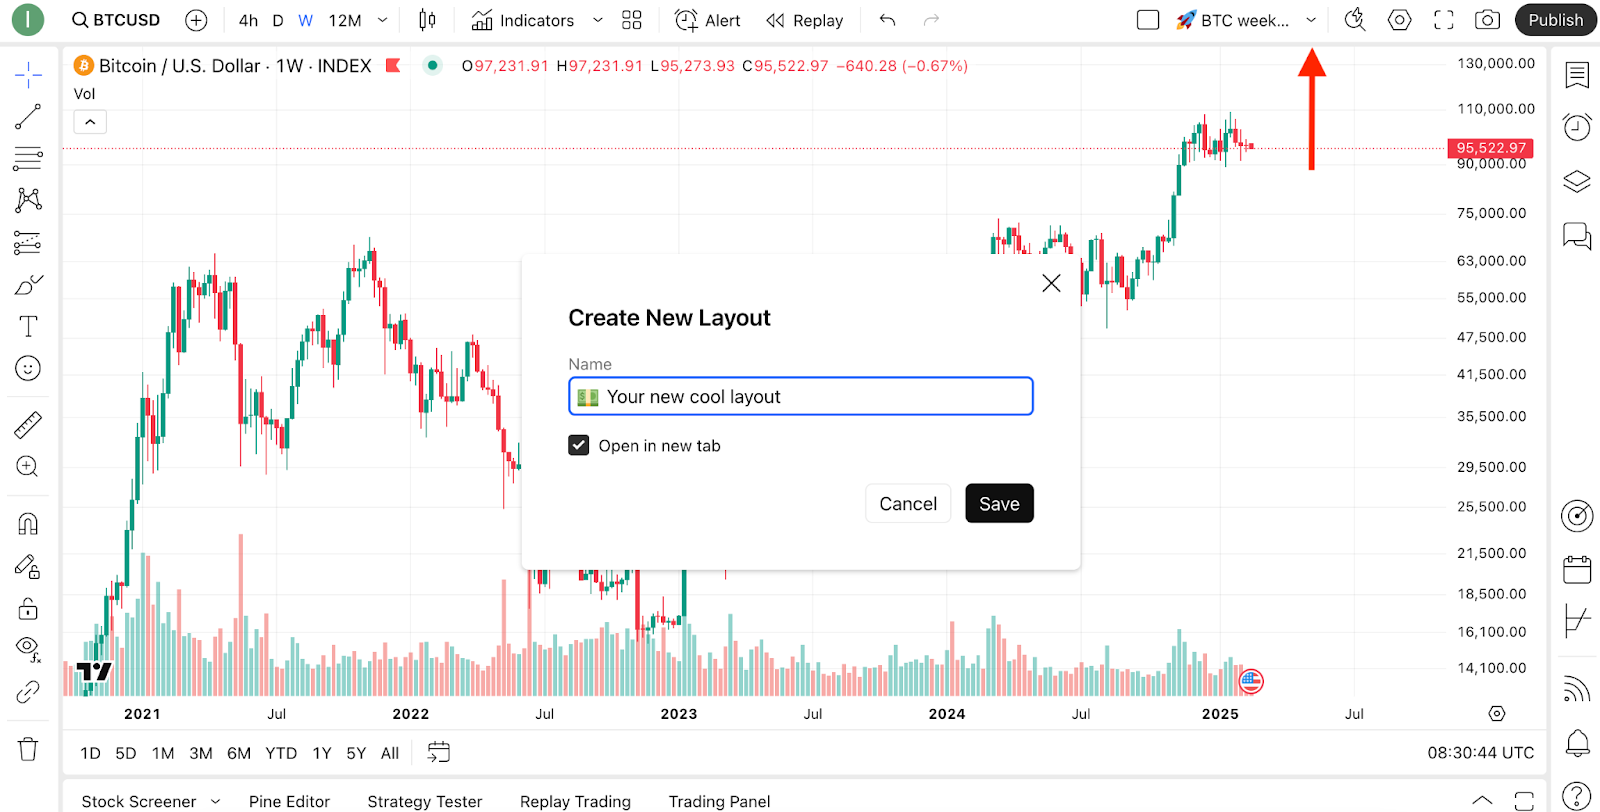
To start customizing a new layout, find the Manage layouts button on the upper toolbar and click the "Create new layout" button. There, type in the name of the new layout.
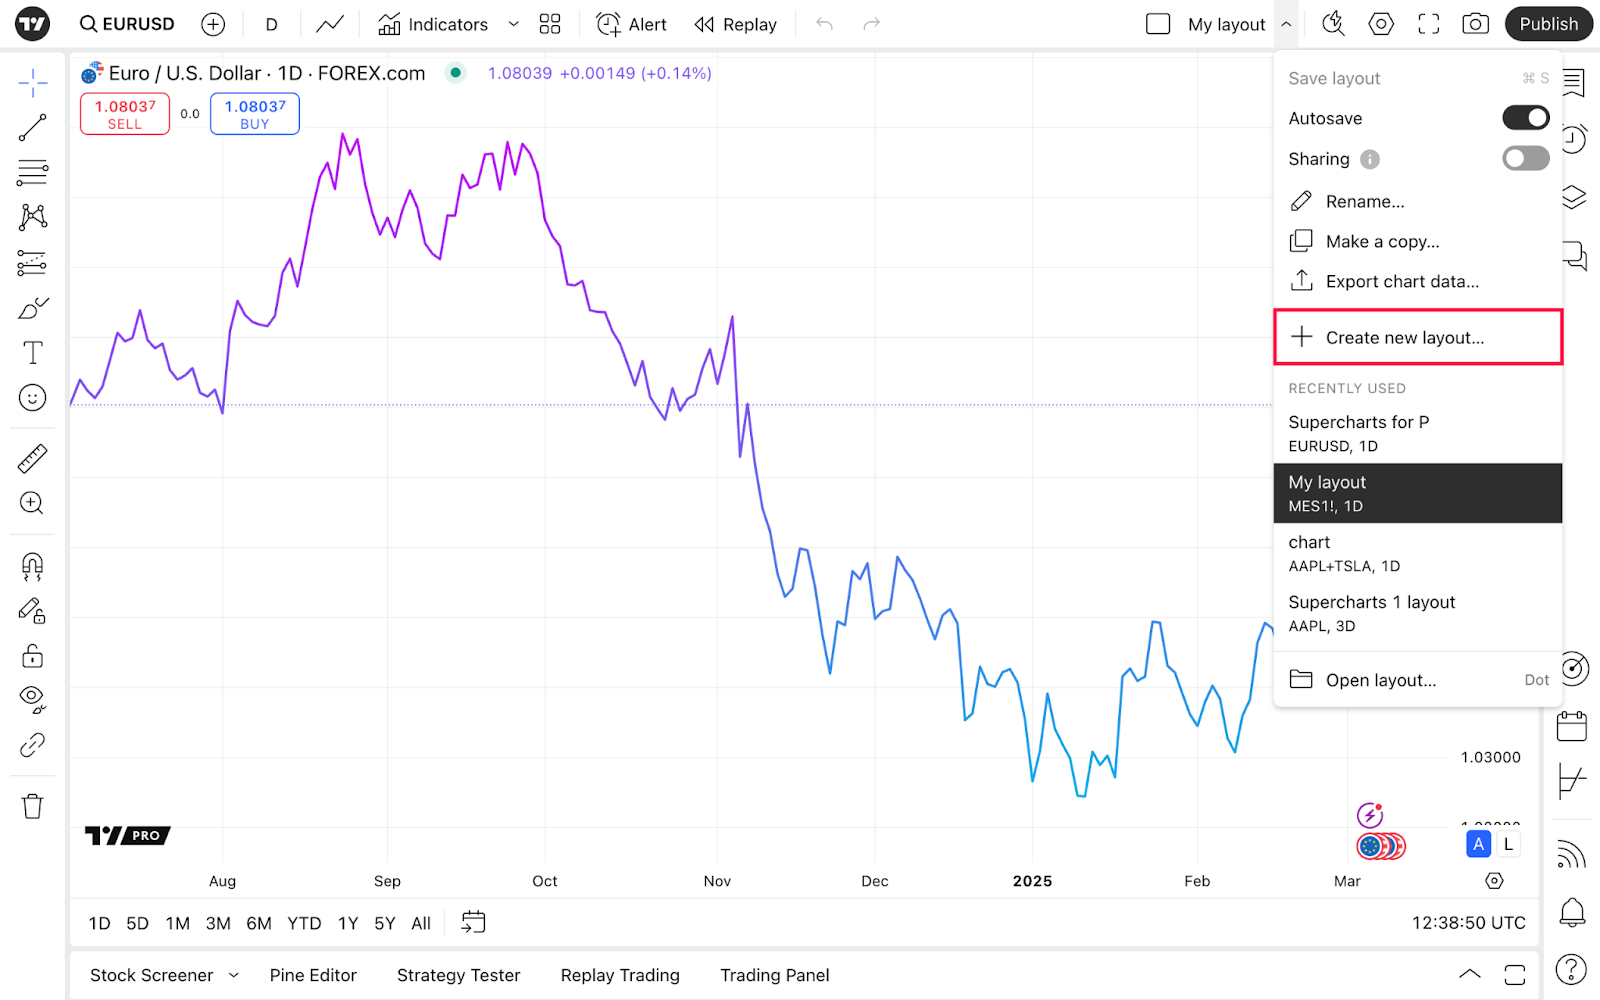
After you save your newly created layout, it'll be displayed in the Manage layouts drop-down menu.
Manage layouts
Here's a quick overview of the features available in this menu.
- Save layout to avoid losing changes
- Toggle Autosave to automatically keep control of changes
- If Sharing is on, "Copy link" will appear. Send this link to anyone to share your chart with its unique settings. When sharing the layout, only you can make changes to the chart
- Make a copy of the chart if you want to keep this layout and have another with some of the features of the existing one
- With the Export chart data feature, you can download a CSV file to store the data, perform quantitative analysis, or for other needs
- Go to Open layout to see all your layouts that are not displayed in Recently used
Every time you make changes to your chart, you'll see Save appearing under the layout's name — click on it from time to time to make sure your progress is saved. You can also use Ctrl+S for Windows and Cmd+S for macOS to save the changes.
When you open your layout, it'll display the latest used interval and symbol. It also remembers the indicators, so it is a quick and convenient way to navigate across different symbols with the same settings on.
Using layouts
As our charts are highly customizable, you can create various layouts to fit your needs. For example, you can create separate layouts for analysis trading.
Let’s see how you can create an efficient layout for market analysis. Start by creating a new layout.
Now, let’s customize. First, choose a chart type. Every chart type has its own purpose and aims at helping at different stages of your analysis — some like line charts are better for the overall quick snapshot of the asset's performance, while others, like candlesticks, are better for identifying the potential entry and exit points for trades. It's better to use multiple chart types during the analysis stage.
Then, click the gear button at the bottom of the chart: it allows you to set up the scale's mode. With regular scale, the chart will be plotted based on the equal changes in price. The more common logarithmic scale uses equal percentage price changes rather than the actual price changes to plot the price line.
Always do your analysis and trades on the same price scale.

Now it's time to add some style to your chart. Navigate to Canvas in chart settings. Set the background and scale text size along with other visual enhancements to make your layout unique and visually appealing.

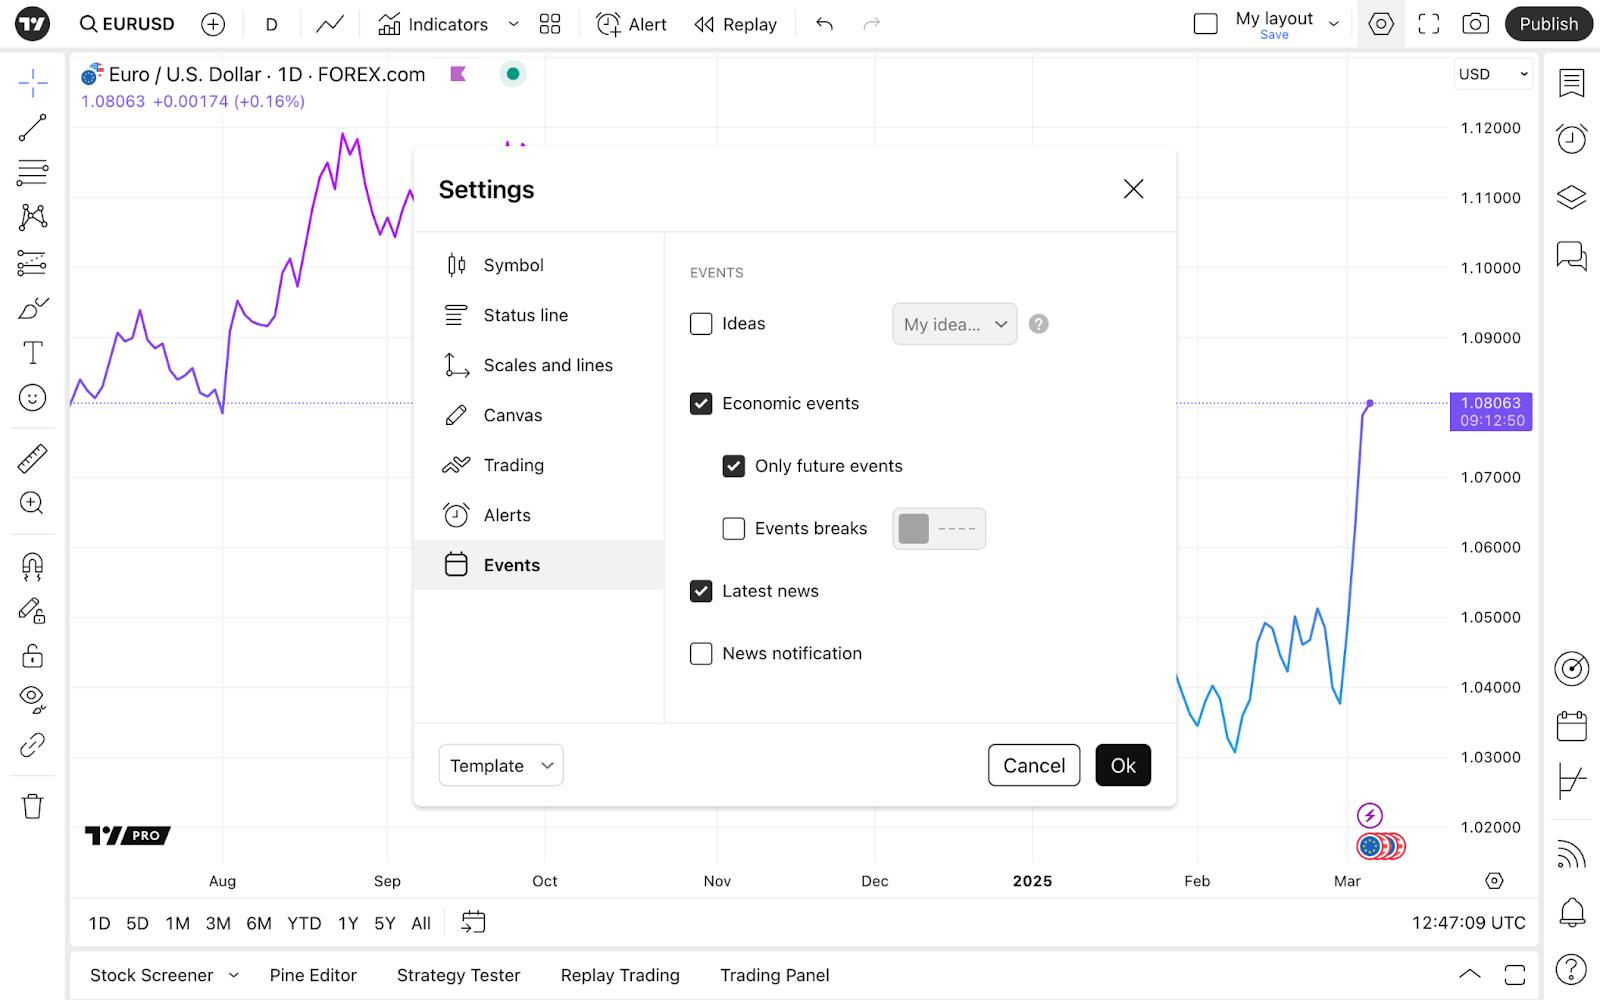
Go to Scales and lines and Status line to choose what information to display for that layout.
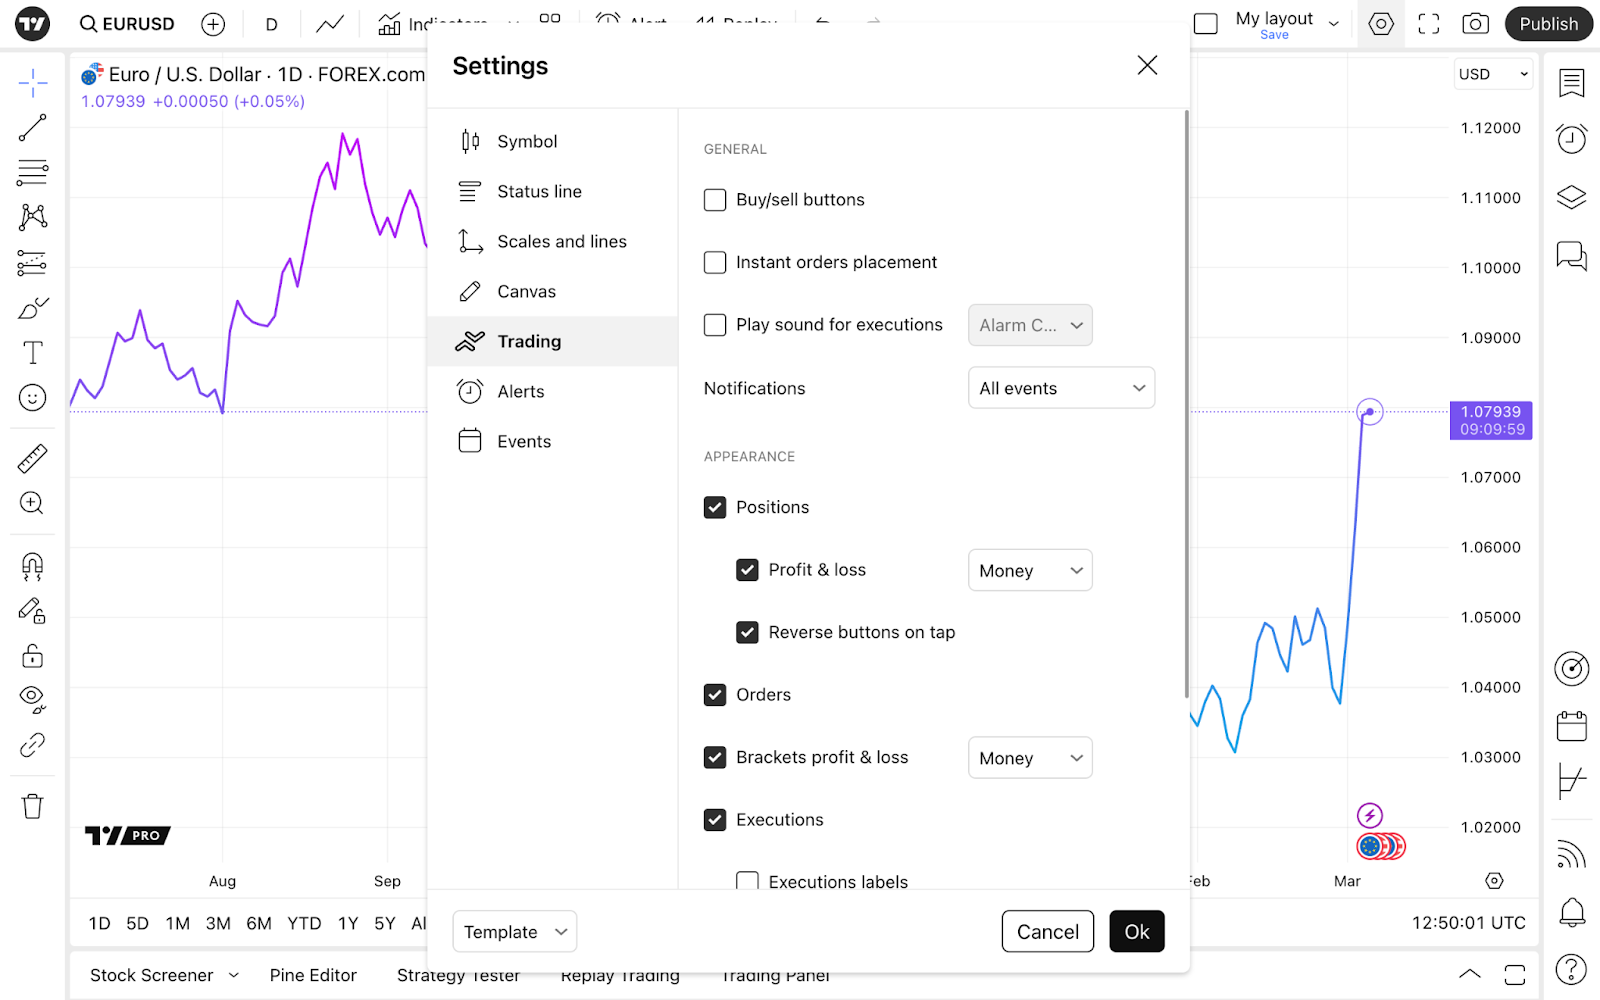
Disable all the features in Trading, so nothing distracts you here.
In the Events, you can choose the chart to display key corporate actions such as earnings reports, stock splits, and dividends distribution. Knowing about them can greatly impact your analysis. You can further deepen your technical analysis by adjusting data for dividends in the Symbol section. Some companies are known for regularly paying their dividends, so enabling this option might significantly change the chart's appearance and thus play a crucial role during your decision making.
Here, you can also enable the Ideas display to see what the TradingView community thinks about that symbol on your chart.
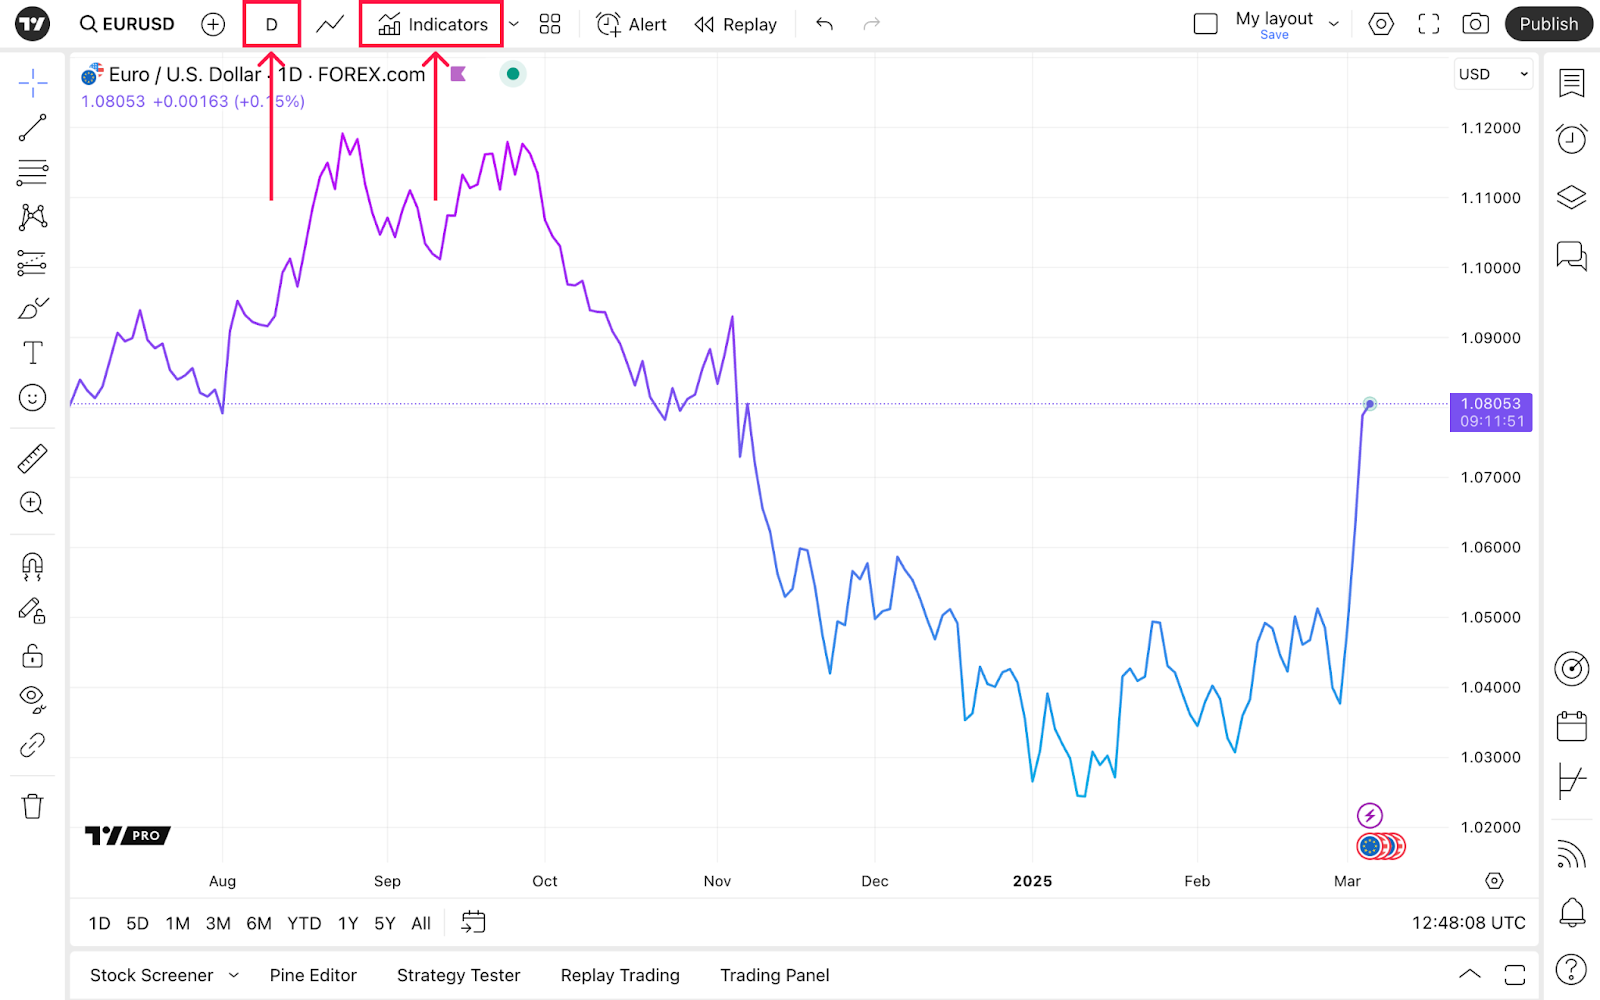
Also, don't forget to set a time interval and pick indicators to make the most of your analysis — both menus are located on the upper toolbar.
Now that you've created the chart for the analysis, let's create one more for trading purposes.
Repeat the previous customization steps with some tweaks to distinguish these two charts by their look.
When you've got the desired look, it's time to enable the features from the Trading tab that we ignore in the previous layout. For example, choose to display the buy and sell buttons, set notifications, tackle appearance, and more.
After customization is finished, make sure that you connect your favorite broker to trade right from the chart. To do this, go to the Trading panel by clicking an arrow in the lower right corner and find your broker’s icon. Our guides on trading essentials can help you better utilize these TradingView capabilities.

Trading is impossible without precise timing. To be fully prepared, we recommend you head to the alerts section of our knowledge base. There you can also learn how to trade through TradingView.
If you are just starting trading, create an extra layout for practising with paper trading, our tools for risk-free strategy testing.
Note that when you navigate across symbols, your layout keeps its settings such as appearance and indicators. That may help you if you apply the same strategy or use similar indicators for different symbols.
To better understand what features the TradingView Supercharts have, familiarize yourself with the chart introduction — the comprehensive guide on what you need to know about other settings of the Supercharts.
Multiple chart layouts
Another key feature of TradingView Supercharts is its multi-chart layouts, which you can find in Layout setup. This mode allows you to have multiple charts in your workspace to maximize your analysis.
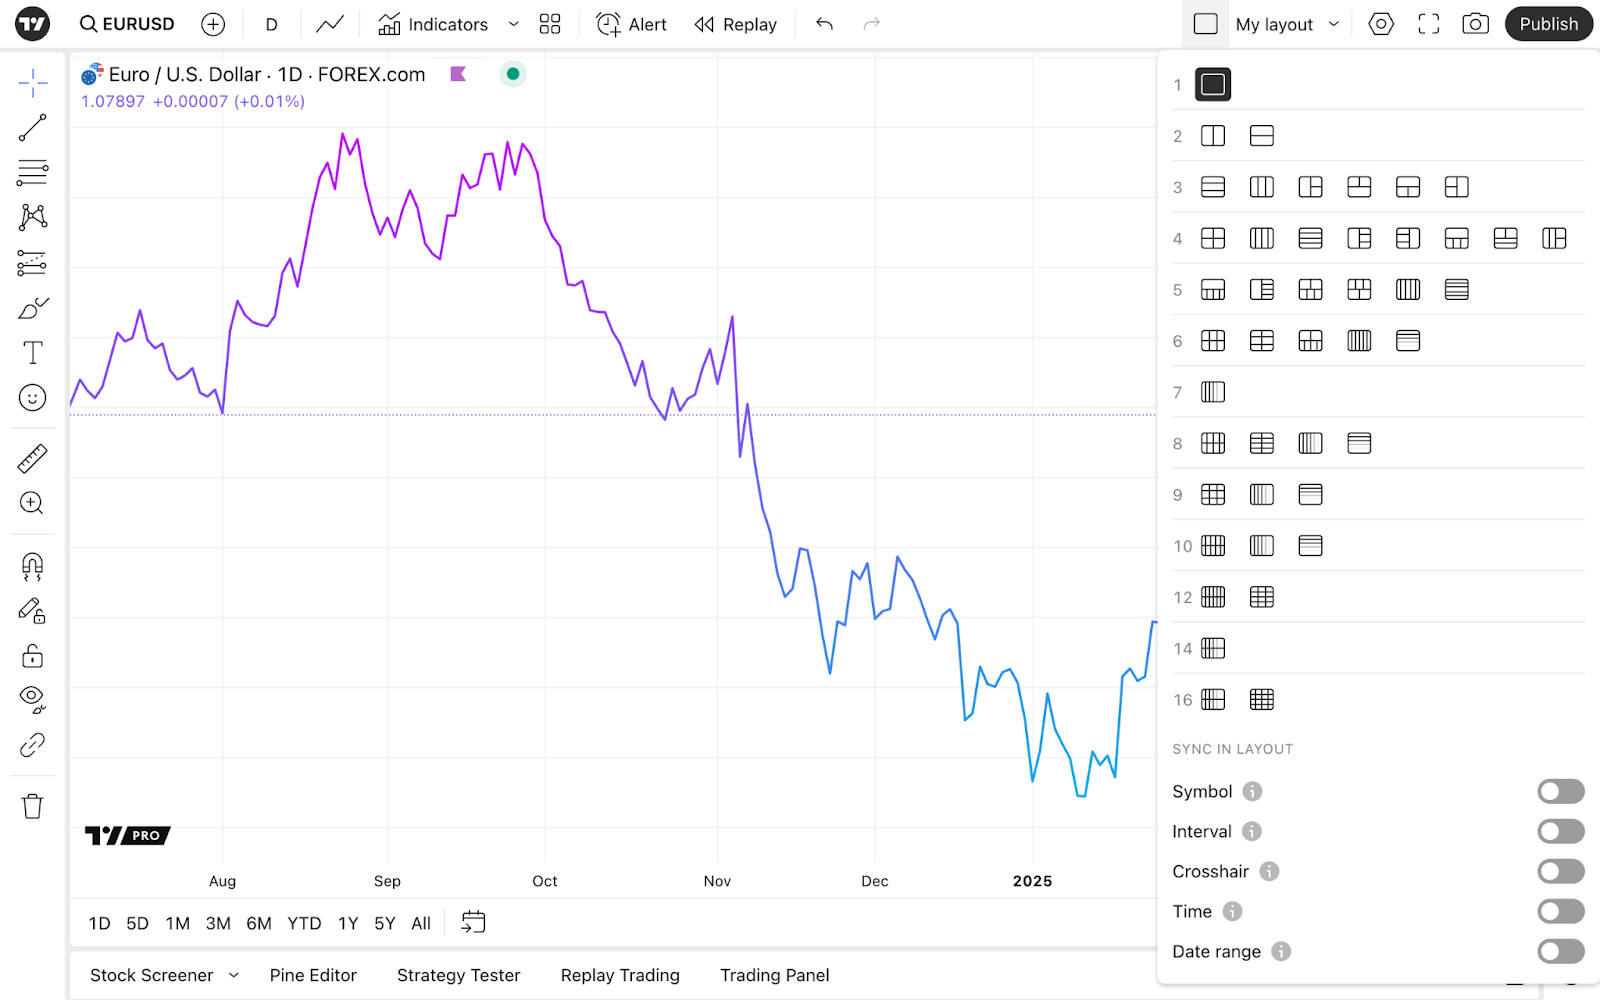
When you choose multiple charts, all the indicators and strategies from the initial chart will apply to the additional charts. Keep in mind that chart settings from the initial chart will not be transferred to the additional charts, as they are tied to the specific chart. But you can choose to synchronize some basic settings like interval, symbol, and more in the Layout setup menu.
There's a separate workflow when it comes to drawings: they are applied only for the particular symbol. If you change symbols within the same layout, drawings will disappear.
However, you can choose to synchronize them between multiple layouts or within one layout. For that, in the drawings panel on the left toolbar, find the button with either of these two icons.
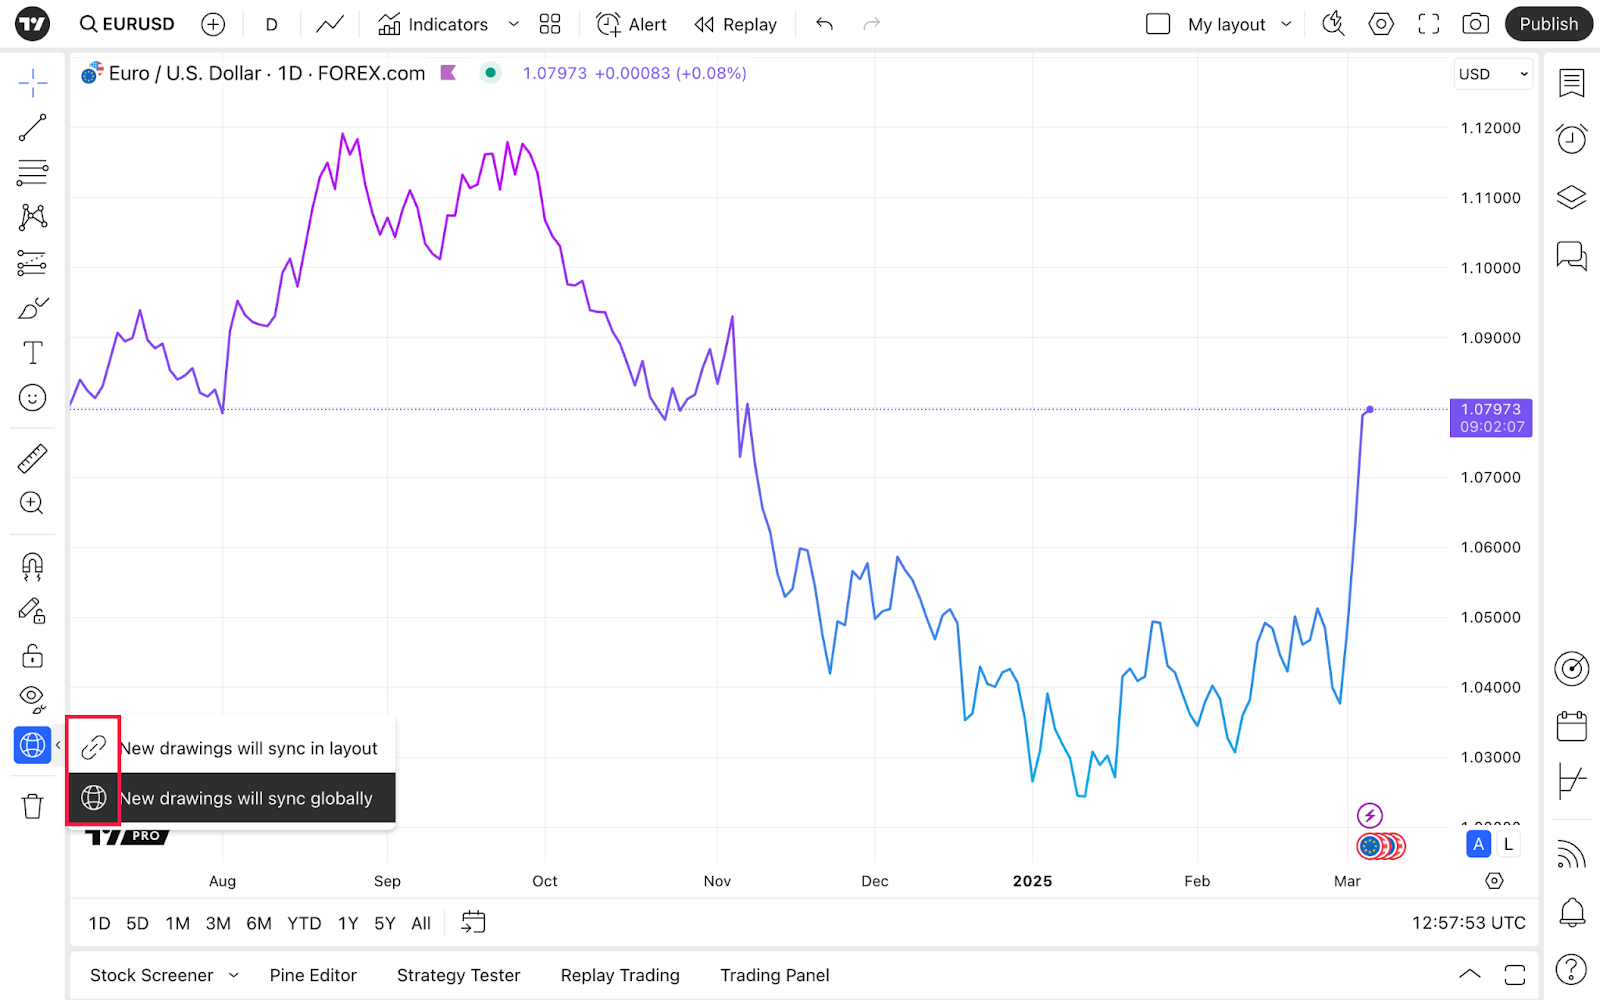
If this feature is off, drawings are local, meaning that they will be applied only for the particular symbol on the particular chart within the particular layout.
- Sync drawings in layout will make drawings appear on every new chart for the same symbol within that layout.
- Sync drawings globally will save your drawings on every new chart for the same symbol, even if you create a new layout.

If you turn off the global synchronization, all the drawings for that symbol from all the other layouts will be deleted.
Let's say you applied drawings to the chart with the TSLA symbol. If you change the symbol to, say, NVDA, the drawings will disappear. If you go back to the TSLA, the drawings will reemerge.
If the global sync is on, after you create a new layout and choose the TSLA symbol there, that layout will keep the previous drawings made for the TSLA on the previous chart in another layout.
TradingView layouts are high-performance solutions for optimizing your strategy. Whether you are a novice or advanced trader, their easy and detailed customization will help you smoothly navigate across symbols and highlight crucial spots on the chart.