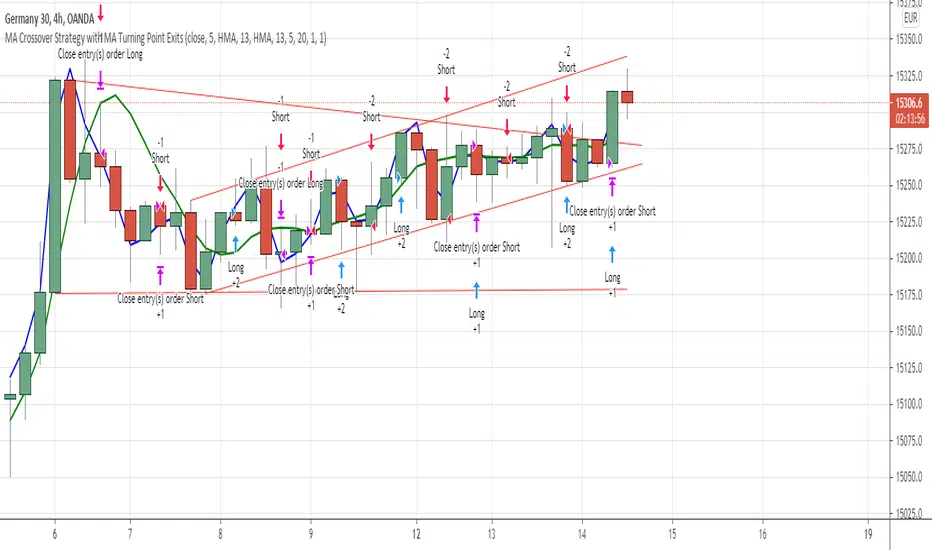
MA Crossover Strategy with MA Turning Point Exits + ADX filterThis strategy uses @rthomson's "MA Crossover Strategy with MA Turning point Exits" and combines it with ADX.
This strategy filters out any entries where ADX < 20. In fact you can set the value for ADX threshold. (Generally value under 20 for ADX is considered as non trend zone)
Взвешенное скользящее среднее (WMA)
Funding Rate for FTX:BTCPERP (estimated) v0.1 Original credits goes to @Hayemaker, and @NeoButane for the TWAP portions of this script
By @davewhiiite, 2021-03-27
Version 0.1
Summary: The funding rate is the interest charged / credited to a perpetual futures trader for taking a long or short position. The direction of the funding rate is used as an indicator of trader sentiment (+ve = bullish; -ve = bearish), and therefore useful to plot in real time.
The FTX exchange has published the calculation of their funding rate as follows:
TWAP((future - index) / index) / 24
The formula here is the same, but expresses it in the more common % per 8hr duration:
funding = TWAP((future / index) - 1) * (8 / 24) * 100
For reference: future refers to the FTX bitcoin futures contract price (FTX:BTCPERP) and index is the spot price of bitcoin on the exchange (FTX:BTCUSD)
Additional notes:
Probably best to add to the indicator to a new pane, or as secondary axis
Plot this in combination with FTX:BTCPERP or FTX:BTCUSD, or chart of your choice to complement your bitcoin dashboard
Compare to funding rates published on ViewBase
questions? Ask me!

Reivaj MA - PreSession This script contains 9 moving averages which can be changed each between "sma", "ema", "wma", "vwma.
The values of the moving averages are:
MMA20 = SMA20
MMA50 = SMA50
MMA100 = SMA100
MMA200 = SMA200
MMA300 = SMA300.
MMAextra1 = ema 8
MMAextra2 = ema21
MMAextra3 = sma400
MMAextra4 = sma500.
It has an Asian range that goes from 21: 00-07: 00 UTC which turns the color of the candle in green.
And pre-sessions that is one hour before the opening, the time of the opening and the hour after the opening of London and New York.

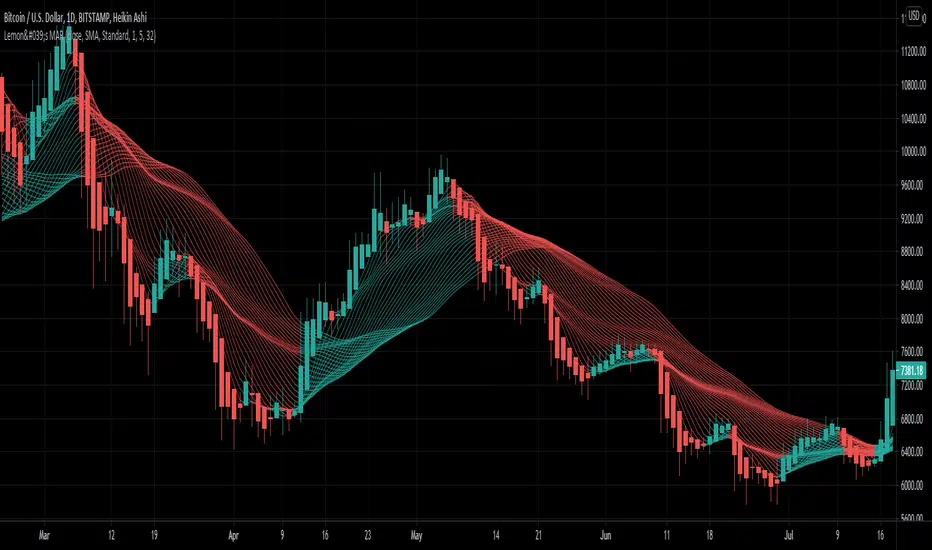
Customizable MA RibbonAll credits to @Violent (www.tradingview.com) for making the original code! I just updated it by adding new features and themes!
---------------------------------------------
Lemon's Customizable MA Ribbon:
---------------------------------------------
A series of moving averages of different lengths that create a ribbon-like indicator. Traders can determine trend strength by lookin at the distance between the moving averages and the overall balance of the colored lines. Price movements through the ribbon can also be used to identify trend changes.
------------
FEATURES
------------
MA TYPES: SMA , EMA , WMA, RMA, ALMA, VWMA, HMA
Editable length
Editable start
User defined number of plots to show (between 1 to 32 total plots)
Multiple color theme choices
A color smoothing option.
Thank you and happy trading!
with love,
-Lemon
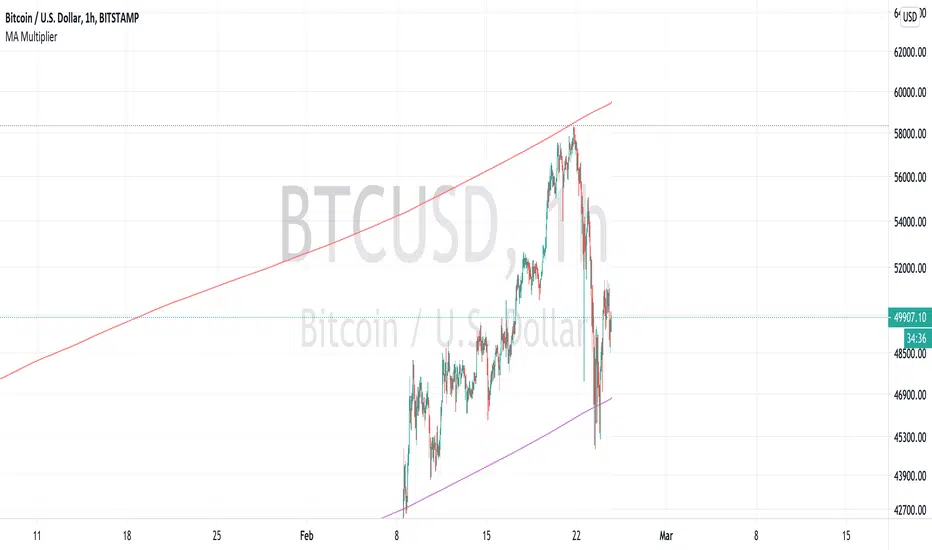
MA Multiplier with FibonacciThis implementation of the "2-Year MA Multiplier" gives you some control over the indicator, you can change the multiplier from it's default of 5, you can change the lookback from it's default of 730 days and I've also added three fibonacci traces between the moving average and it's multiple that you can play with. Oh and you can also choose the data source ('close' or 'hl2' make most sense).
The formula for this indicator was created by Philip Swift.
Thanks to @Pladizow for pointing me to this indicator.
MA, MATR, ChEx | All in One - 4CR CUPIn trade position setup, we always need to determine the market structure and manage the position sizing in a short period of decision time. Indicators such as moving average, initial stop loss and trailing stop loss are always helpful.
This indicator put all these handy tools into a single toolkit, which includes the following price action and risk management indicators:
MA - Moving Average
MATR - Moving Average less Average True Range
ChEx - Chandelier Exit
This script further enhances the setting so that you can easily customize the indicators.
For both the Moving Averages and the Moving Average less Average True Range , you can pick a type of moving average which suits your analysis style from a list of commonly used moving average formulations: namely, EMA , HMA , RMA, SMA and WMA , where EMA is selected as default.
The Moving Average less Average True Range , MATR, is usually applied as a reference to set the initial stop loss whenever opening a new position.
The abbreviation, MATR, is picked, so that this can serve as a handy reminder of a very good trading framework as elaborates as below:
M – Market Structure
A – Area of Value
T – Trigger
R – Risk Management (aka. Exit Strategy)

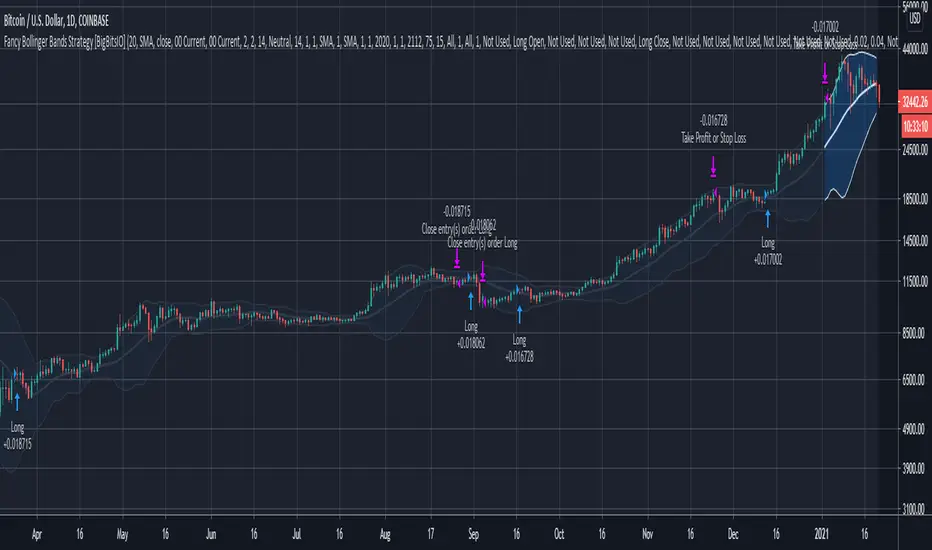
Fancy Bollinger Bands Strategy [BigBitsIO]This script is for a Bollinger Band type indicator with built-in TradingView strategy including as many features as I can possibly fit into a Bollinger Band type indicator including a wide variety of options to create the most flexible Bollinger Bands strategy possible.
Features:
- A single custom moving average serving as the middle band.
- Standard MA inputs.
- MA type.
- MA period.
- MA price.
- MA resolution (time frame).
- Visibility toggle.
- MA Candle Type
- Fancy MA inputs.
- Toggle to show only candles included in the MA calculation ("Highlight inclusion") or display entire MA history.
- Toggle to show a ghost trail when Highlight inclusion is toggled on. Displays a shaded version of past MA history before the inclusion period (as seen on snapshot).
- Toggle to show forecast values for the MA.
- Other inputs related to forecasting:
- Forecast bias. (Neutral forecasts MA if the current price remains the same.)
- Forecast period.
- Forecast magnitude.
- Toggle showing details on the screen
- Toggle the visibility of the fill between the upper and lower bands.
- Toggle to use ATR instead of the standard deviation to calculate the location of the upper and lower bands.
- Custom input for the ATR period.
Strategy Features
-Strategy Window - only test during this window
-Take Profit and Stop Loss
-Open and Close conditions, including condition counts and any/all requirements
-Many conditions to choose from that can either be selected to open, close or open and close a position
-Conditions include:
-Price crossing above/below the Upper, Middle, or Lower bands
-Price being above/below the Upper, Middle, or Lower bands
-Bollinger Band width crossing or being above/below custom values
-Percent B crossing or being above/below custom values
This script may contain errors, or out of date code. Please be mindful of updates to the script.
*** DISCLAIMER: For educational and entertainment purposes only. Nothing in this content should be interpreted as financial advice or a recommendation to buy or sell any sort of security or investment including all types of crypto. DYOR, TYOB. ***
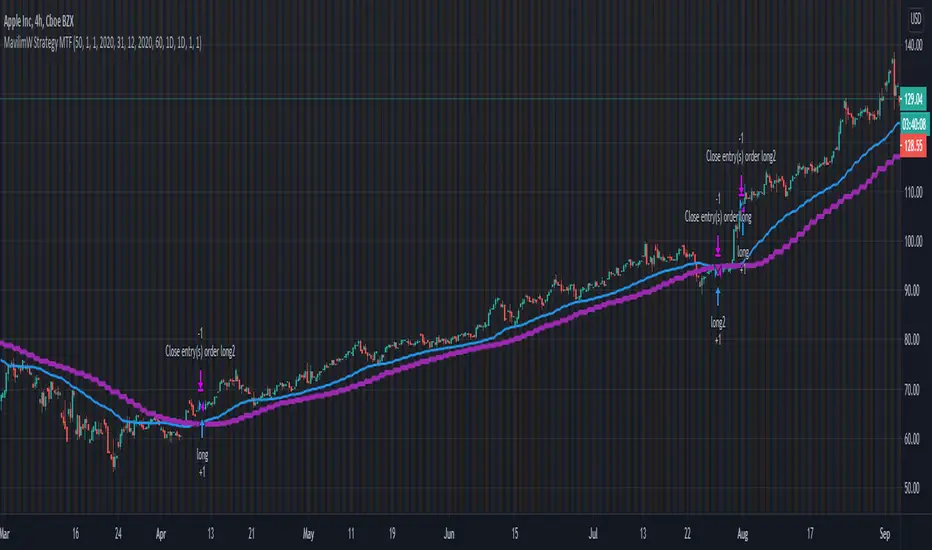
MavilimW Strategy MTF EMA with HA CandlesThis is a strategy adapted initially for Mavilim moving average indicator, based on WMA MA.
It seems to works amazingly on long term markets, like stocks, some futures, some comodities and so on.
In this strategy, I form initially the candle, using EMA values, so I take the EMA of last 50 closes, open, highs and lows and form the candle
After this I take interally HA and convert the EMA candle to HA.
Then using the moving averages on multiple timeframes, like in this example we have a chart on 4h, but I use 1h and 1d moving averages.
For long condition we have : close is above moving average timeframe1 and oving average timeframe2 and oving average timeframe3
Initially short would be close below ma timeframe1, ma timeframe2 and timeframe3 -> but here I also convert it into a long signal.
So we actually go only long .
And we have 2 different exits : for first long if we have a crossdown of 1h ma with 1 day ma, and for second long if we have a cross up of 1h ma with 1 day ma in this example.
Message me if you have any questions about this strategy.
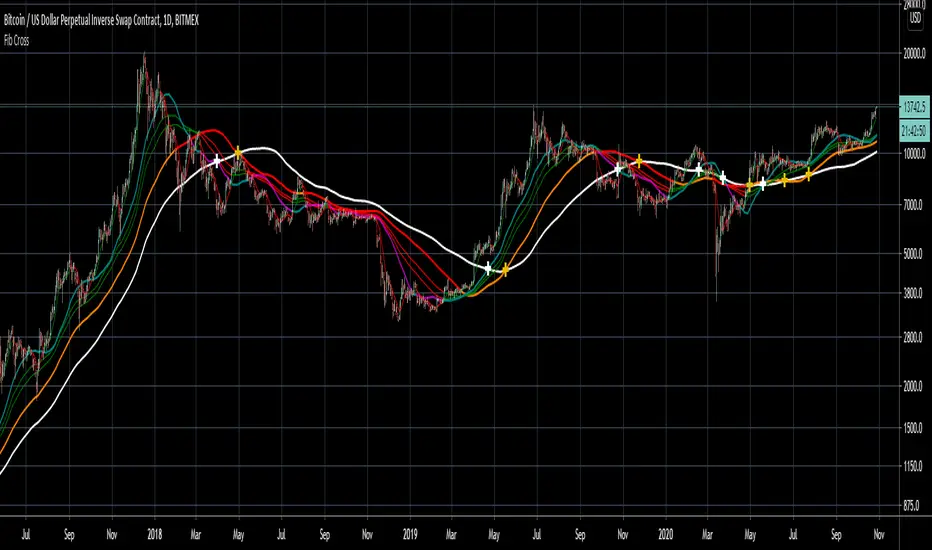
Fib Cross Moving AveragesThe white line is the main 200-candle MA. The fibonacci ratio MAs are relative to that 200-day MA. Some lines change color based on the trend shown by this indicator.
So 61.8% for example, the orange/red line golden ratio MA is a 124 candle MA (~68% of 200). There is also a weighted 124 candle MA that works along-side the 100 candle MA.
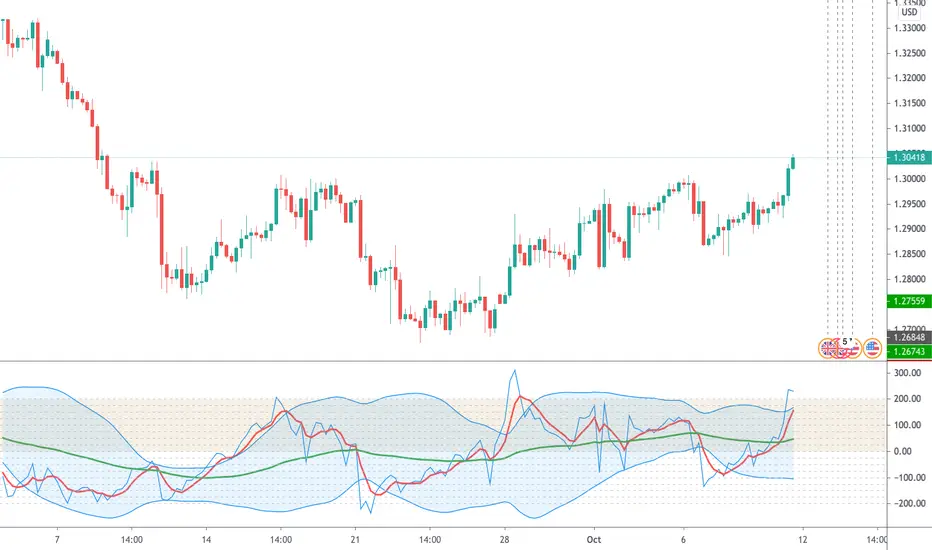
CCI Strategy v2This was a strategy I found based on MT4. It takes CCI readings, then transforms them into a weighted moving average illustration. This is represented as:
Red Line - A six period moving average taken from CCI (NOT PRICE)
Green Line - A sixty-six period moving average taken from CCI (NOT PRICE)
Blue Line - CCI plotted
I have also added some levels and bollinger bands to highlight changes in activity.
The strategy is:
BUY - When the red line crosses upwards over green line.
SELL - When the red line crosses downwards over green line.
Extra confirmation is available by watching the blue line, it should be above red to buy, below red to sell. If the blue line drops in the opposite direction, this may be an opportunity to buy on a pull back.
If you wish for any modications to be applied, please do not hesitate to contact me.
Hull MA Scanner / Screener LabelThis screens for Hull MA trend reversal's in 10 different securities. If the label color is not visible due to the text in it being white colored, then choose a different color from settings. Also added a simple HullMA to it. If want can increase it upto 40 securities in the code which is upto user to decide.
This was requested by soderstromkenan in comments and looked like a nice idea so decided to make it.
The Hull MA logic is from "Hull50" by u/RafaelZioni with his permission. Screener logic from u/Quantnomad with his permission.

VVOscillator [nb]Multiple volume oscillators in one.
Description:
As Warren Guppet once said, be “fearful when others are buying less, and greedy when others are selling less.”
Divergences are the main point of usage of all bundled indicators.
OBV Oscillator, remade. The formula has been changed to smooth out the way OBV is calculated during a trending move
OBV Oscillator, original OBV formula.
Price Volume Trend Oscillator. Similar to OBV, except price is taken into account as well.
Price Volume Trend Oscillator, log.
Accumulation/Distribution. (close - low) - (high - close) / (high - low), then multiplied by volume
Chaikin Money Flow . Very similar to accum/dist except it was already made into an oscillator.
OBV just by itself. Change style to line for easier interpretation.
Experimental function that utilizes a part of CCI
This is the unedited "Variable Volume Oscillator v1" released for free use. In the time since I've created it, I've realized it's something I'd like to share because I like it and hope you will too.

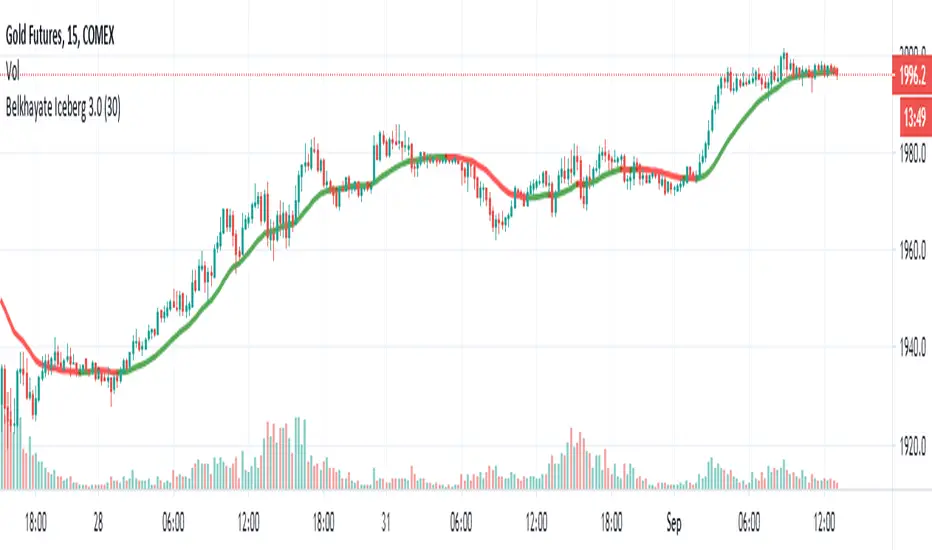
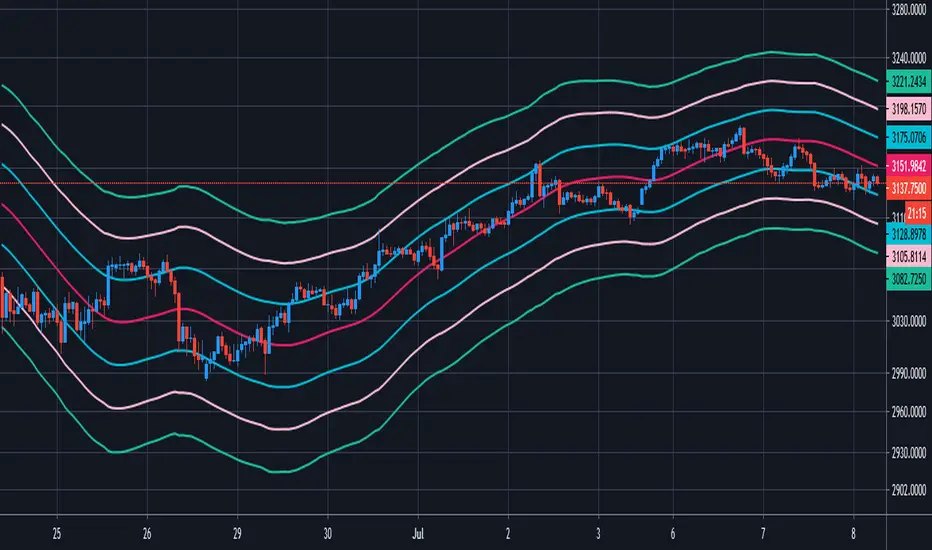
Belkhayate Iceberg 3.0 - WMA 30 periodThis is a multicolore WMA 30 Period and not an iceberg orders detector as claimed by Mostafa Belkhayate.
The colors will change based on the candles position towards the 30 period WMA .
Its free and open source for all the african youth, we never charge and lie to our beloved people.
We look for buy opportunities when the plot is green.
We look for sell opportunities when the plot is red.
EMA_VTX
Abbreviations:
EMA - Exponential Moving Average
SMA - Simple Moving Average
WMA - Weighted Moving Average
VWMA - Volume-Weighted Moving Average
TP - TimePeriod (1m,2m,5m,1h....)
TP Steps - 1m,3m,12m,1h,5h,D (This steps i use)
Use-case:
Moving Average Exponential is a good indicator of Support and Resistance Level. Giving us average price level in particular moment.
This script calculates and plots Moving Average with minute precision, even if you want to see 21 EMA level from 1H chart.
So you can accommodate all important information on one chart with best precision.
Made for Intraday Perioads.
Best used for DayTrading, when you need to make quick and efficient decisions.
EMA_VTX = Preferred resolution * Length / Present resolution.
In addition to plotting EMA , you can quickly switch between SMA, WMA, VWMA .
Settings:
Resolution - Most used TP included, plus some exclusive paid plans (1m, 2m, 3m, 5m, 12m, 15m, 1h, 4h, 5h, Daily). Default set to 1h
Use - Bonus function for EMA indicator. You can quickly switch type from EMA to SMA, WMA,VWMA
Length - standard function. Default set to 144
Offset - standard function. Default set to 0
Source - standard function. Default set to hlc3
Why to use it ?
Yes, i know that variable TP is standard now in TradingView. But there are some limitations, especially for DayTraders.
Problem:
Imagine you are trading/scalping on 1m.. 5m.. 15.. charts and you want to see where are your Higher TP MAs.
-- You can change to 1h and check it, but you will loose the picture from smaller TP.
-- You can use Standard EMA TP function, but your MAs data will update every 15m, 1h (depends on TP)
Solution:
This script help to solve this problem, by breaking information down to 1m and building from there.
So whatever Intraday TP you choose to trade, your MAs will be updated with minute precision.
Limitations:
Sadly nothing without limitations.
1. You can experience "Reference too many candles in history" around 5K - This means that too many candles are used to plot MAs.
-- Quick fix: Reduce "Length" or Step down TP (best experience when projecting MAs 1-2 TP Steps up)
2. For Best performance use only Higher TP dividable By Yours (ex. You use 3m chart, then you can plot 12m, 15m, 1h / You use 5m chart, then you can plot 15m, 1h. 12m will already have 3m of information lost using 5m Chart )
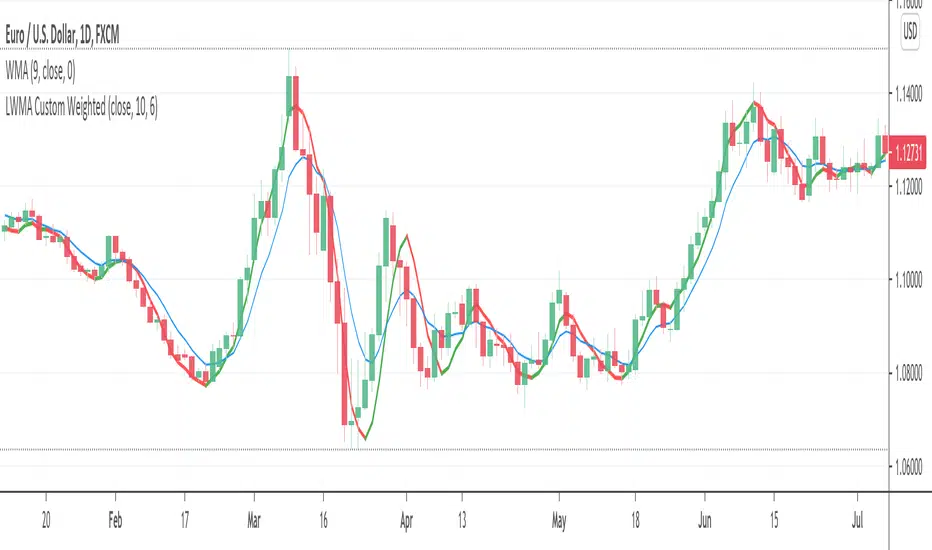
LWMA: Linear Weighted Moving AverageCouldn't find searching for Linearly Weighted Moving Average (LWMA) in tradingview. Found one with the LWMA title, but it uses plain WMA calculation without the linearity which more heavily weights recent price data, which I need, so I try to made one.
LWMAs are also quicker to react to price changes than SMA and EMA. If you want a moving average with less lag than an SMA, try a LWMA.
It kind of also have a more clarity in defining the price trend and reversals. Trade signals usually based on crossovers, they can also indicate areas of potential support or resistance. But beware though, multiple false signals may also occur before a significant trend develops. Use a filter, some decent volatility oscillator might do the job.
--
The formula for this Linearly Weighted Moving Average is:
LWMA = (( P n∗ W 1)+( P n−1∗ W 2)+( P n−2∗ W 3)...) / ∑W
P = Price for the period
n = The most recent period, n-1 is the prior period, and n-2 is two periods prior
W = The assigned weight to each period, with the highest weight going first and then descending linearly based on the number of periods being used.
I hope I'm doing right translating it to Pine Script 4. Let me know if I miss something.
Ehlers Predictive Moving Average [CC]The Predictive Moving Average was created by John Ehlers (Rocket Science For Traders pg 212) and this is one of his first leading indicators. I have been asked by many people for more leading indicators so this one is for you all! Buy when the indicator line is green and sell when it is red.
Let me know if there are other indicators you would like to see me publish or if you want something custom done!

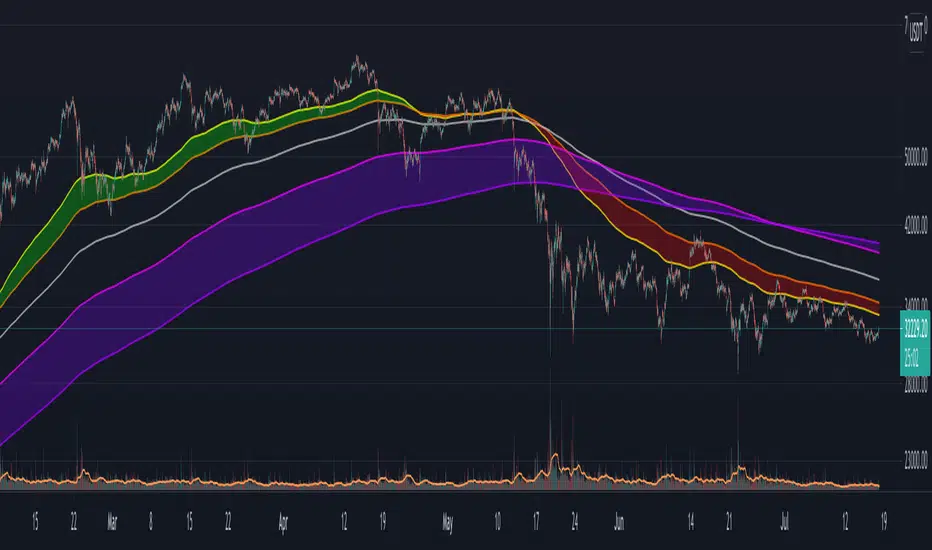
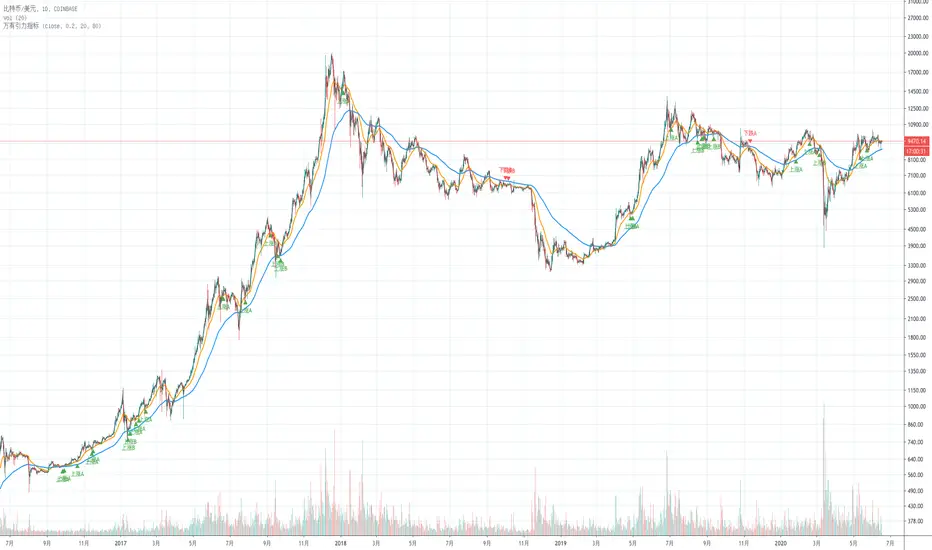
万有引力(均线支撑阻挡Moving Average Support and Resisitance)系统This is a Moving Average indicator base on R/S which design for Chinese.
这是一个基于均线作为移动支撑阻挡的用法而设计的指标。
本脚本的目的在于帮助使用中文的人了解该指标,特别是其用法。同时将该指标代码添加完整的中文注释,方便使用中文的人学习Pine语言。
均线移动支撑阻挡的用法是葛南维八大买卖法则的基础。
本指标的特色
本指标利用均线的支撑阻挡效应来捕捉一段长期趋势的第二段行情。
*万有引力:即均值回归理论。认为价格始终在重复着远离其均值,再回到其均值;
*洛希极限:以均线为中心,以其0.2标准差构建其上下轨道,形成一个容错通道;
指标可调节参数
该指标有三个可设置的参数
1 短周期均线参数:默认为20;
2 长周期均线乘数:默认为80;
3 标准差参数:0.2
本指标还有两项可选设置项
1 价格源:价格源默认使用收盘价,但是你还可以选择使用开盘价、最高价、最低价等其他的价格计算方式;
2 是否显示强趋势的开关;
3 是否显示中趋势的开关;
指标用法
买入信号: 当指标出现上涨A或上涨B时,即为买入信号。其中上涨A为强趋势信号,上涨B为中趋势信号。
卖出信号: 当指标出现下跌A或下跌B时,即为卖出信号。其中下跌A为强趋势信号,下跌B为中趋势信号。
本指标支持配置买卖点的预警。
指标优势
1 适用于不同的时间周期和不同的交易品种;
2 对趋势有很好的识别效应。
指标局限性
本指标主要在于捕捉趋势的第二段,若当前趋势较弱时,第二段极有可能不成立。
RAT Momentum Squeeze BETAV1.0
MAs are a great tool to measure the market's momentum. I created this indicator to graphically depict bullish and banishment movements with the moving averages.
Using the 50, 100, & 200 day MA in conjunction with the RSI we are able to find great swing setups. This is used best on the 30min & up to the daily chart.

Smoothed Sensitive MAThis moving average is sensitive and reacts quickly to significant price movements, while remaining indifferent to small price moves.
Smoothed Sensitive MA is triple weighted for price changes.
It takes in one parameter "Length", which is used as both
1. the lookback period for price change,
zCC=abs(close-close [ len ])
and also as
2. the number of periods to be averaged
zSSMA=sum(zCC*zCC*zCC*close, len )/sum(zCC*zCC*zCC, len )
Alternatively, you could modify the script to use two separate parameters for values for 1 and 2.

End Point Moving Average [CC]The End Point Moving Average was created by Patrick E. Lafferty (Stocks & Commodities V13 (413-417)) and it is essentially a variation of the weighted moving average but the weight system is different. Feel free to change the offset and length amounts to adjust to your needs but I'm using the default amounts in my script. This hugs the price very closely and I think you will enjoy this script as much as I had making it. As always buy when the indicator line is green and sell when it is red!
Let me know if you would like me to publish other scripts or if you want something custom done!
Note: I'm republishing this because the original script couldn't be found in searches so this will fix that.

GMS: Keltner ChannelsBasically I wanted to make this into one indicator instead of three while adding in some extra options as well... So this is just a Keltner Channel with three channels, all of which have the same length. I have also added in an option to select the moving average for the channel, the original is based on the EMA.
The source code should be open so take a look around and enjoy!
Andre
Cubed Weighted Moving AverageThis is another indicator that I have created that is my favorite script yet for a weighted moving average. This indicator is very similiar to a classic weighted moving average but in this version I'm cubing the weights. It hugs the price very closely as you can see and of course buy when the indicator line is green and sell when it is red.
Let me know if you would like me to publish other scripts or if you want something custom done!
