FeraTrading Multi-Timeframe FVG w/ Volume FilteringWelcome to the FeraTrading Multi-Timeframe FVG w/ Volume Filtering Indicator.
This Fair Value Gap (FVG) indicator identifies bullish and bearish FVGs across up to 5 customizable timeframes—from intraday scalps to higher-timeframe confluences.
🔹 Volume-Filtered FVGs: Optionally filter for high-volume zones only, focusing on strong institutional interest.
🔹 Bullish & Bearish Toggles: Choose which setups you want to see.
🔹 Dynamic Gap Lengths: Gap size automatically scales with volume intensity using a smart multiplier.
🔹 Multi-Timeframe Support: Pulls FVGs from higher timeframes without cluttering your chart.
🔹 Color-Coded Zones: Easily distinguish between bullish and bearish areas with custom transparency.
Great for scalpers, day traders, and swing traders looking for precise entry zones backed by volume and structure.
We made this indicator open-source on purpose: So you can tweak it, improve it, or build on it. Whether you’re a developer or a trader with some coding skills, we want you to make it your own and help the tool evolve with the community. Mess with the volume logic or how the FVGs interact with candles, it is all setup for you to do so. If you are not a coder, enjoy using a great indicator!
This indicator was developed by FeraTrading to visualize market structure.
Объем

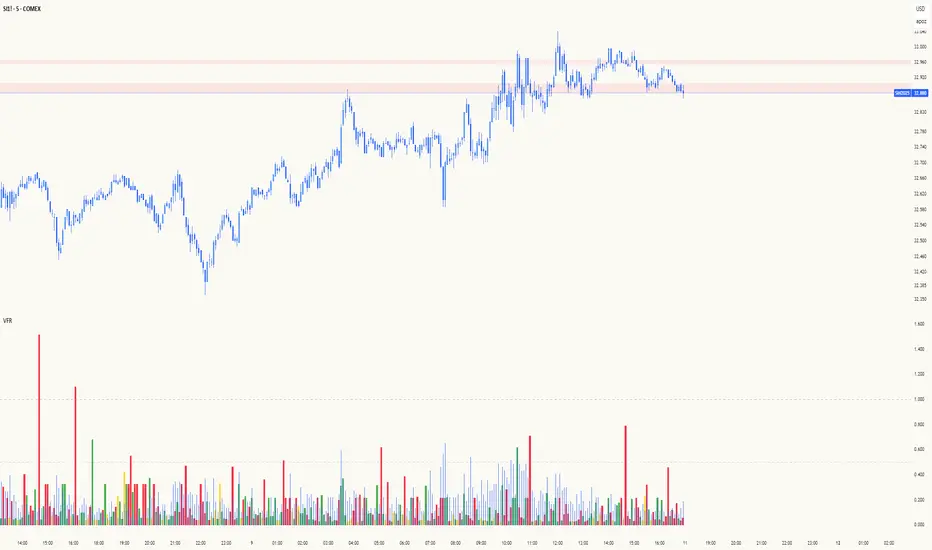
Volume Flow RatioVolume Flow Ratio (VFR) Indicator
Overview
The Volume Flow Ratio (VFR) is a sophisticated volume analysis tool that measures current trading volume relative to the maximum volume of the previous period. Unlike traditional volume indicators that show raw volume or simple moving averages, VFR provides context by comparing current activity to recent maximum activity levels.
Core Features
1. Split Period Analysis
- Multiple Timeframe Options:
- Daily: Compares to previous day's maximum
- Weekly: Week-to-week comparison
- NYSE Weekly: Specialized for stock market trading (Monday-Friday only)
- Monthly: Month-to-month analysis
- Quarterly: Quarter-to-quarter perspective
- Yearly: Year-over-year volume comparison
2. Ratio-Based Measurement
- Displays volume as a ratio (0 to 1+) rather than raw numbers
- 1.0 represents volume equal to previous period's maximum
- Example: If previous max was 50,000 contracts:
- Current volume of 25,000 shows as 0.5
- Current volume of 75,000 shows as 1.5
3. Triple Coloring Modes
- Moving Average Based:
- Compares current ratio to its moving average
- Customizable MA period
- Green: Above MA (higher than average activity)
- Red: Below MA (lower than average activity)
- Previous Candle Comparison:
- Simple increase/decrease from previous bar
- Green: Higher than previous bar
- Red: Lower than previous bar
- Candle Color Based:
- Syncs with price action
- Green: Bullish candles (close > open)
- Red: Bearish candles (close < open)
Primary Use Cases
1. Volume Profile Analysis
- Perfect for traders who need to understand when markets are most active
- Helps identify unusual volume spikes relative to recent history
- Useful for timing entries and exits based on market participation
2. Market Activity Traders
Ideal for traders who:
- Need to identify high-liquidity periods
- Want to avoid low-volume periods
- Look for volume breakouts or divergences
- Trade based on institutional participation levels
3. Mean Reversion Traders
Helps identify:
- Overextended volume conditions (potential reversals)
- Volume exhaustion points
- Return to normal volume levels after spikes
4. Momentum Traders
Useful for:
- Confirming trend strength through volume
- Identifying potential trend exhaustion
- Validating breakouts with volume confirmation
Advantages Over Traditional Volume Indicators
1. Contextual Analysis
- Shows relative strength rather than raw numbers
- Easier to compare across different time periods
- Automatically adjusts to changing market conditions
2. Period-Specific Insights
- Respects natural market cycles (daily, weekly, monthly)
- Special handling for NYSE trading days
- Eliminates weekend noise in stock market analysis
3. Flexible Visualization
- Three distinct coloring methods for different trading styles
- Clear reference line at 1.0 for quick analysis
- Histogram style for easy pattern recognition
Best Practices
For Day Traders
- Use Daily split for intraday volume patterns
- MA coloring mode with shorter periods (5-10)
- Focus on ratios during market hours
For Swing Traders
- Weekly or NYSE Weekly splits
- Longer MA periods (15-20)
- Look for sustained volume patterns
For Position Traders
- Monthly or Quarterly splits
- Candle color mode for trend confirmation
- Focus on major volume shifts
Limitations
- Requires one full period to establish baseline
- May be less effective in extremely low volume conditions
- NYSE Weekly mode specific to stock market hours
This indicator is particularly valuable for traders who understand that volume is a crucial component of price action but need a more sophisticated way to analyze it than simple volume bars. It's especially useful for those who trade based on market participation levels and need to quickly identify whether current volume is significant relative to recent history.
VWAP Separation Oscillator V5 (No Arrows)Okay, here is a draft description you can adapt for your TradingView publication. It starts from the basics and explains the concepts behind the indicator and how to interpret its visual elements.
VWAP Separation Oscillator
Summary
This indicator provides a normalized view of how far the current price has deviated from its Volume-Weighted Average Price (VWAP), helping traders identify potentially overbought or oversold conditions relative to recent VWAP dynamics. It calculates the price separation from VWAP and expresses it in terms of standard deviations (a Z-score), making it easier to gauge the statistical significance of the deviation.
Core Concepts Explained
What is VWAP?
VWAP stands for Volume-Weighted Average Price. It's a trading benchmark calculated by taking the total dollar value traded for every transaction (price multiplied by volume) and dividing it by the total shares traded for the day (or other chosen period).
Unlike a simple moving average, VWAP gives more weight to price levels where more volume occurred. Many institutional traders use it as a reference point for execution quality.
This indicator allows you to choose the "Anchor Period" (Session, Week, Month, etc.) which determines when the VWAP calculation resets.
What is VWAP Separation?
P
rice doesn't always stay at the VWAP; it naturally fluctuates above and below it.
"VWAP Separation" is simply the difference between the current price (Source) and the calculated VWAP value (Separation = Price - VWAP). A positive separation means the price is above VWAP; negative means below.
How Standard Deviation is Used:
While knowing the separation is useful, its significance can vary wildly between different stocks or market conditions. A $1 separation might be huge for one stock but tiny for another.
Standard Deviation is a statistical measure of how spread out data points are from their average. In this indicator, we calculate the standard deviation of the VWAP Separation over a specified Lookback Length. This tells us how volatile or dispersed the separation has been recently.
The Oscillator Line (Z-Score):
The main purple (or Green/Red) line plotted by this indicator is the Z-score of the VWAP Separation.
Formula conceptually: Oscillator Value = (Current Separation - Average Separation) / Standard Deviation of Separation
Interpretation: It tells you how many standard deviations the current separation is away from the average separation over the lookback period.
A value of +2.0 means the current separation is 2 standard deviations higher (more extended to the upside) than the average separation.
A value of -1.5 means the current separation is 1.5 standard deviations lower (more extended to the downside) than the average separation.
This normalization makes it easier to compare readings across different assets or timeframes and to define consistent thresholds for "extreme" deviations.
Visual Elements Explained
Oscillator Line: The primary line showing the Z-score value (explained above). Can optionally be colored Green/Red based on its slope (rising/falling).
Overbought Line (Solid Red): A user-defined level (default: 2.0). When the oscillator moves above this line, it suggests the price deviation above VWAP is statistically significant compared to recent history.
Oversold Line (Solid Green): A user-defined level (default: -2.0). When the oscillator moves below this line, it suggests the price deviation below VWAP is statistically significant compared to recent history.
Overbought/Oversold Zone Fills (Transparent Red/Green): These shaded areas appear only when the oscillator line enters the respective Overbought or Oversold territory (defined by the OB/OS Lines), visually highlighting these periods.
Zero Line (Dotted Gray): Represents the point where the current VWAP separation is exactly equal to the average VWAP separation over the lookback period. Crossings indicate shifts relative to this mean.
Zero Cross Markers (Orange 'X'): Small 'x' marks plotted directly on the oscillator line whenever it crosses the Zero Line, pinpointing these moments.
Potential Usage / Interpretation
Identifying Extremes: High positive values (above OB Level) or low negative values (below OS Level) can suggest the price move relative to VWAP might be over-extended and potentially due for a pause or pullback. Look for the oscillator turning back from these extremes.
Spotting Divergences: Look for discrepancies between price action and the oscillator.
Bearish Divergence: Price makes a new high, but the oscillator makes a lower high (often in the OB zone). Suggests weakening upside momentum relative to VWAP dynamics.
Bullish Divergence: Price makes a new low, but the oscillator makes a higher low (often in the OS zone). Suggests weakening downside momentum relative to VWAP dynamics.
Context is Key: This oscillator measures deviation from a specific benchmark (VWAP). Its interpretation should always be done within the context of the overall market trend, price structure (support/resistance), volume analysis, and potentially other confirming indicators.
Disclaimer: This indicator is a tool for analysis, not a standalone trading system. It does not provide financial advice. Always use risk management.
Settings Overview
Anchor Period: Determines how often the VWAP calculation resets (Session, Week, Month, etc.).
Source: The price data used for the separation calculation (default: hlc3).
Lookback Length: The number of bars used to calculate the average and standard deviation of the separation, influencing the oscillator's responsiveness.
Overbought/Oversold Levels: User-defined thresholds for identifying extreme Z-score values.
Color Oscillator Line: Option to color the oscillator line based on whether it's rising or falling.

Volume and Volatility Ratio Indicator-WODI该指标名为“交易量与波动率比例指标-WODI”,主要基于交易量和价格波动率构造一个复合指数,帮助识别市场内可能存在的异常或转折信号。具体实现如下:
用户自定义参数
用户可以设置交易量均线长度(vol_length)、指数的短期与长期均线长度(index_short_length、index_long_length)、均线敏感度(index_magnification)、阈值放大因子(index_threshold_magnification)以及检测K线形态的区间(lookback_bars)。这些参数为后续计算提供了灵活性,允许用户根据不同市场环境自定义指标的敏感度和响应速度。
交易量均线与百分比计算
首先通过 ta.sma 计算指定长度的交易量简单均线(vol_ma)。
接下来,将当前交易量与均线进行比较,计算出当前交易量占均线的百分比(vol_percent),这反映了短期内交易量的相对活跃程度。
波动率的衡量
使用当前K线的最高价和最低价计算振幅,再除以收盘价乘以100得到波动率(volatility),从而反映市场价格波动的幅度。
构建交易量/波动率指数
将交易量百分比与波动率相乘,形成了“交易量/波动率指数”(volatility_index)。该指数能够同时反映市场的交易活跃度和价格波动性,两者的联合作用帮助捕捉市场的“热度”。
计算指标均线与阈值
对交易量/波动率指数分别计算短期均线(index_short_ma)和长期均线(index_long_ma),并通过乘以一个敏感度参数(index_magnification)进行调整。
同时,依据长期均线计算一个阈值(index_threshold),起到过滤噪音的作用。当指数突破该阈值时,可能预示着市场的重要变化。
K线形态与反转模式检测
通过遍历最近几根K线(由lookback_bars控制),指标会检测是否符合一系列预定条件(涉及交易量、价格振幅、K线形态等),以判断是否存在反转模式。若符合条件,则标记为反转模式,从而为潜在的转折点提供提示。
图表展示
最终在独立窗口中绘制多个元素:
指数短均线与长均线:经过敏感度调整后显示,用于分析指数趋势。
交易量/波动率指数:采用阶梯线风格绘制,直观展示指数变化。
阈值线:作为参考水平,便于判断指数是否突破常规范围。
交易量柱状图:当当前交易量高于均线时,通过不同颜色显示;当检测到反转模式时,颜色会进一步强化,帮助用户迅速识别潜在信号。
English Description
This indicator, titled “Volume and Volatility Ratio Indicator - WODI”, is designed to construct a composite index based on trading volume and price volatility, aiding in the identification of abnormal market conditions or potential reversal signals. Its functionality is broken down as follows:
User-Defined Parameters
The indicator allows users to set parameters such as the moving average length for volume (vol_length), the short and long moving average lengths for the index (index_short_length and index_long_length), a sensitivity multiplier (index_magnification), a threshold magnification factor (index_threshold_magnification), and the number of bars for pattern detection (lookback_bars). These parameters provide flexibility to adjust the sensitivity and responsiveness of the indicator based on different market conditions.
Volume Moving Average and Percentage Calculation
A simple moving average (SMA) of volume is computed over the specified length (vol_ma) using the ta.sma function.
The current volume is then compared to its moving average to calculate the volume percentage (vol_percent), reflecting the relative trading intensity in the short term.
Measuring Volatility
Volatility is calculated based on the current bar’s high and low prices, normalized by the closing price and multiplied by 100, which provides a measure of the market’s price fluctuation magnitude.
Constructing the Volume/Volatility Index
The index (volatility_index) is derived by multiplying the volume percentage by the calculated volatility. This composite metric reflects both market activity and price movement, effectively capturing the overall “heat” of the market.
Calculating the Index Moving Averages and Threshold
Two moving averages for the volatility_index are computed: one short-term (index_short_ma) and one long-term (index_long_ma). These are then adjusted by the sensitivity multiplier (index_magnification).
A threshold level (index_threshold) is calculated based on the long-term moving average multiplied by the threshold magnification factor, serving to filter out market noise. When the index exceeds this threshold, it may signal significant market shifts.
Detection of Reversal Patterns
The indicator iterates through the recent bars (as determined by lookback_bars) to check whether a set of predetermined conditions (involving trends in the volatility_index, volume comparisons, price closes, and K-line patterns) are met. If these conditions are satisfied, it flags a reversal pattern, which may serve as a warning for a potential market turnaround.
Visualization on the Chart
The final display includes several elements plotted in a separate indicator window:
The short-term and long-term moving averages of the index (after sensitivity adjustment) which help visualize the trend of the composite index.
The volatility index itself is drawn using a step-line style for clarity.
A threshold line is plotted to provide a reference level against which index movements can be compared.
A volume histogram is also displayed, where bars are colored differently when the current volume exceeds the moving average; the color is further enhanced if a reversal pattern is detected, making it easy for users to quickly spot potential signals.

Anchored VWAP Pro (Final Visibility Enhanced)This is a fully customizable Anchored VWAP (Volume Weighted Average Price) indicator designed for traders who prioritize precision, clarity, and macro trend analysis.
Unlike traditional VWAPs tied to daily or session data, this version allows you to manually anchor the VWAP to any candle in history—ideal for macro swing trading, cycle lows, breakouts, and reaccumulation phases.
Features:
• Manual Anchor Date: Set the exact year, month, and day for your VWAP to begin
• Custom Price Source: Choose between HLC3, close, or any OHLC-based input
• VWAP Bands: Two standard deviation bands for identifying overextension or fair value zones
• Full Visual Control:
• Toggle each band on/off individually
• Adjust color, line width, and line style (solid, dotted, dashed)
• Built for Clarity: Designed to stand out on both light and dark charts
This script is ideal for:
• Identifying macro confluence zones
• Defining risk during trend pullbacks
• Confirming breakout legitimacy
• Layering with other tools like Market Cipher, VRVP, and Fib levels
Inspired by the work of LonesomeTheBlue, Algokid, and other pros—this is a cleaner, more flexible and updated alternative for precision trading.
Script created and published by @ImmortalEmerson
For advanced swing traders, crypto analysts, and macro trend specialists.

VWAP 2.0 with desv + Initial Balance by RiotWolftrading🌟 Overview
This powerful tool is designed for traders who want to harness the power of the Volume Weighted Average Price (VWAP) alongside session-based ranges to make informed trading decisions. Whether you're a day trader or a swing trader, this indicator provides a clean and effective way to identify support, resistance, and market trends—all in one place! 💡
✨ Key Features
Auto-Anchored VWAP 📊
Automatically calculates the VWAP based on a user-defined anchor period (e.g., Daily, Weekly, Monthly).
Resets at the start of each period (e.g., daily for a Daily anchor).
Displays a customizable VWAP line with standard deviation bands to highlight key price levels.
Standard Deviation Bands 📏
Plots up to three sets of standard deviation bands above and below the VWAP (multipliers: 1.0, 2.0, 3.0).
Includes volume percentage labels to show where trading volume is concentrated. 📉
Session High/Low Range 🕒
Identifies the high and low prices within a customizable session (default: 12:00 to 15:31).
Draws horizontal lines at the session high and low, with dotted deviation lines for additional reference points.
Perfect for spotting key levels during your trading session! 🔑
Time-Based Range Box ⏰
Highlights a specific time window (default: 15:40 to 15:50) with a colored box showing the high and low prices.
Ideal for tracking price action during high-impact events like news releases or market opens. 📅
Alerts 🚨
Set up alerts for when the price crosses above or below the VWAP—never miss a potential trading opportunity!
⚙️ Settings
Customize the indicator to fit your trading style with these easy-to-use settings:
VWAP Settings
Timezone 🌍: Select your timezone (default: GMT+2) to align calculations with your local time.
VWAP Source 📈: Choose the price source for VWAP (default: hlc3 - average of high, low, close).
Std Deviation Multipliers 📐: Adjust the multipliers for the bands (default: 1.0, 2.0, 3.0).
Line Width ✏️: Set the thickness of the VWAP and band lines (default: 1).
Session Time ⏳: Define the session window for VWAP calculations (default: 08:00-18:00, all days).
Show Upper/Lower Bands 👀: Toggle visibility for each set of bands (default: Band 1 visible, Bands 2 & 3 hidden).
Range Settings
Range Start/End Time 🕙: Set the time window for the range box (default: 15:40 to 15:50).
Box Color 🎨: Customize the border color (default: blue).
Box Background Color 🖌️: Adjust the background color (default: light aqua, 90% transparency).
I created this indicator to provide a streamlined, clutter-free tool for traders who rely on VWAP and session-based analysis. It focuses on the essentials—VWAP, standard deviation bands, session high/low, and range box—without unnecessary overlays. I hope it helps you in your trading journey! If you have feedback or suggestions, feel free to share—I’d love to hear from you! 😊
VWAP+bgcolorThe "VWAP+bgcolor" indicator is an enhanced version of the Volume Weighted Average Price (VWAP) that visually highlights price action relative to the VWAP line. By coloring the chart background, it helps traders quickly identify whether the price is above or below the VWAP, making it easier to spot bullish or bearish market conditions.

Dynamic Volume Profile OscillatorDynamic Volume Profile Oscillator
Introduction
The Dynamic Volume Profile Oscillator (DVPO) is an advanced technical analysis tool that merges volume profiling with price action dynamics to enhance trend identification and improve trade entry precision. Unlike conventional oscillators that rely solely on price-based metrics, DVPO incorporates adaptive volume-weighted mean deviations to present a more responsive and insightful perspective on market behavior. This makes it a powerful instrument for traders seeking refined momentum insights and context-aware overbought/oversold detection.
Key Features
Adaptive Volume Profiling: Utilizes real-time volume data to adjust the oscillator’s sensitivity to prevailing market activity, enabling more accurate trend and exhaustion zone identification.
Mean Reversion Mode: Highlights potential reversion points when price deviates significantly from volume-weighted norms, ideal for contrarian and range-bound strategies.
Oscillator Smoothing: Integrates optional smoothing filters to reduce noise and provide clearer directional signals without sacrificing responsiveness.
Dynamic Midline & Zones: Features an evolving midline calibrated to the current volume-weighted context, along with dynamically adjusting overbought and oversold zones.
Signal Crossovers: Generates actionable momentum signals when the oscillator crosses key thresholds or the midline, aiding in timing entries and exits.
Gradient Zone Visualization: Visually represents intensity and directional bias through gradient color zones, helping users quickly assess momentum strength and market condition shifts.
How It Works
The DVPO calculates deviations from a volume-weighted average price baseline across a defined lookback period. These deviations are then transformed into an oscillator that fluctuates above and below a dynamic midline, which represents the fair value zone based on recent volume distribution.
To enhance interpretability, the indicator introduces:
Dynamic Zones that expand or contract based on current volatility and volume skewness.
Smoothing algorithms (optional) that can be applied to reduce erratic movements caused by sudden spikes in volume.
Gradient coloring to reflect the strength and direction of the momentum — darker tones indicate stronger trends, while lighter ones suggest potential reversals or weakening trends.
Crossover logic that detects when the oscillator line crosses above or below the midline or critical thresholds, often coinciding with trend initiations or reversals.
Conclusion
The Dynamic Volume Profile Oscillator offers a significant enhancement to traditional momentum indicators by intelligently adapting to both price and volume shifts. Whether used for trend following, mean reversion, or breakout confirmation, its comprehensive design provides traders with an intuitive yet powerful edge in identifying actionable market signals across varying conditions.
Disclaimer
This indicator is intended for educational and informational purposes only. It does not constitute financial advice or a recommendation to buy or sell any financial instrument. Users should perform their own due diligence and consult a qualified financial advisor before making any trading decisions.

Quarterly Theory ICT 04 [TradingFinder] SSMT 4Quarter Divergence🔵 Introduction
Sequential SMT Divergence is an advanced price-action-based analytical technique rooted in the ICT (Inner Circle Trader) methodology. Its primary objective is to identify early-stage divergences between correlated assets within precise time structures. This tool not only breaks down market structure but also enables traders to detect engineered liquidity traps before the market reacts.
In simple terms, SMT (Smart Money Technique) occurs when two correlated assets—such as indices (ES and NQ), currency pairs (EURUSD and GBPUSD), or commodities (Gold and Silver)—exhibit different reactions at key price levels (swing highs or lows). This lack of alignment is often a sign of smart money manipulation and signals a lack of confirmation in the ongoing trend—hinting at an imminent reversal or at least a pause in momentum.
In its Sequential form, SMT divergences are examined through a more granular temporal lens—between intraday quarters (Q1 through Q4). When SMT appears at the transition from one quarter to another (e.g., Q1 to Q2 or Q3 to Q4), the signal becomes significantly more powerful, often aligning with a critical phase in the Quarterly Theory—a framework that segments market behavior into four distinct phases: Accumulation, Manipulation, Distribution, and Reversal/Continuation.
For instance, a Bullish SMT forms when one asset prints a new low while its correlated counterpart fails to break the corresponding low from the previous quarter. This usually indicates absorption of selling pressure and the beginning of accumulation by smart money. Conversely, a Bearish SMT arises when one asset makes a higher high, but the second asset fails to confirm, signaling distribution or a fake-out before a decline.
However, SMT alone is not enough. To confirm a true Market Structure Break (MSB), the appearance of a Precision Swing Point (PSP) is essential—a specific candlestick formation on a lower timeframe (typically 5 to 15 minutes) that reveals the entry of institutional participants. The combination of SMT and PSP provides a more accurate entry point and better understanding of premium and discount zones.
The Sequential SMT Indicator, introduced in this article, dynamically scans charts for such divergence patterns across multiple sessions. It is applicable to various markets including Forex, crypto, commodities, and indices, and shows particularly strong performance during mid-week sessions (Wednesdays and Thursdays)—when most weekly highs and lows tend to form.
Bullish Sequential SMT :
Bearish Sequential SMT :
🔵 How to Use
The Sequential SMT (SSMT) indicator is designed to detect time and structure-based divergences between two correlated assets. This divergence occurs when both assets print a similar swing (high or low) in the previous quarter (e.g., Q3), but in the current quarter (e.g., Q4), only one asset manages to break that swing level—while the other fails to reach it.
This temporal mismatch is precisely identified by the SSMT indicator and often signals smart money activity, a market phase transition, or even the presence of an engineered liquidity trap. The signal becomes especially powerful when paired with a Precision Swing Point (PSP)—a confirming candle on lower timeframes (5m–15m) that typically indicates a market structure break (MSB) and the entry of smart liquidity.
🟣 Bullish Sequential SMT
In the previous quarter, both assets form a similar swing low.
In the current quarter, one asset (e.g., EURUSD) breaks that low and trades below it.
The other asset (e.g., GBPUSD) fails to reach the same low, preserving the structure.
This time-based divergence reflects declining selling pressure, potential absorption, and often marks the end of a manipulation phase and the start of accumulation. If confirmed by a bullish PSP candle, it offers a strong long opportunity, with stop-losses defined just below the swing low.
🟣 Bearish Sequential SMT
In the previous quarter, both assets form a similar swing high.
In the current quarter, one asset (e.g., NQ) breaks above that high.
The other asset (e.g., ES) fails to reach that high, remaining below it.
This type of divergence signals weakening bullish momentum and the likelihood of distribution or a fake-out before a price drop. When followed by a bearish PSP candle, it sets up a strong shorting opportunity with targets in the discount zone and protective stops placed above the swing high.
🔵 Settings
⚙️ Logical Settings
Quarterly Cycles Type : Select the time segmentation method for SMT analysis.
Available modes include: Yearly, Monthly, Weekly, Daily, 90 Minute, and Micro.
These define how the indicator divides market time into Q1–Q4 cycles.
Symbol : Choose the secondary asset to compare with the main chart asset (e.g., XAUUSD, US100, GBPUSD).
Pivot Period : Sets the sensitivity of the pivot detection algorithm. A smaller value increases responsiveness to price swings.
Activate Max Pivot Back : When enabled, limits the maximum number of past pivots to be considered for divergence detection.
Max Pivot Back Length : Defines how many past pivots can be used (if the above toggle is active).
Pivot Sync Threshold : The maximum allowed difference (in bars) between pivots of the two assets for them to be compared.
Validity Pivot Length : Defines the time window (in bars) during which a divergence remains valid before it's considered outdated.
🎨 Display Settings
Show Cycle :Toggles the visual display of the current Quarter (Q1 to Q4) based on the selected time segmentation
Show Cycle Label : Shows the name (e.g., "Q2") of each detected Quarter on the chart.
Show Bullish SMT Line : Draws a line connecting the bullish divergence points.
Show Bullish SMT Label : Displays a label on the chart when a bullish divergence is detected.
Bullish Color : Sets the color for bullish SMT markers (label, shape, and line).
Show Bearish SMT Line : Draws a line for bearish divergence.
Show Bearish SMT Label : Displays a label when a bearish SMT divergence is found.
Bearish Color : Sets the color for bearish SMT visual elements.
🔔 Alert Settings
Alert Name : Custom name for the alert messages (used in TradingView’s alert system).
Message Frequency :
All: Every signal triggers an alert.
Once Per Bar: Alerts once per bar regardless of how many signals occur.
Per Bar Close: Only triggers when the bar closes and the signal still exists.
Time Zone Display : Choose the time zone in which alert timestamps are displayed (e.g., UTC).
Bullish SMT Divergence Alert : Enable/disable alerts specifically for bullish signals.
Bearish SMT Divergence Alert : Enable/disable alerts specifically for bearish signals
🔵 Conclusion
The Sequential SMT (SSMT) indicator is a powerful and precise tool for identifying structural divergences between correlated assets within a time-based framework. Unlike traditional divergence models that rely solely on sequential pivot comparisons, SSMT leverages Quarterly Theory, in combination with concepts like liquidity sweeps, market structure breaks (MSB) and precision swing points (PSP), to provide a deeper and more actionable view of market dynamics.
By using SSMT, traders gain not only the ability to identify where divergence occurs, but also when it matters most within the market cycle. This empowers them to anticipate major moves or traps before they fully materialize, and position themselves accordingly in high-probability trade zones.
Whether you're trading Forex, crypto, indices, or commodities, the true strength of this indicator is revealed when used in sync with the Accumulation, Manipulation, Distribution, and Reversal phases of the market. Integrated with other confluence tools and market models, SSMT can serve as a core component in a professional, rule-based, and highly personalized trading strategy.

Smart Technical Matrix v6 - Display OnlySmart Technical Matrix Analyzer - This script analyzes 32 technical signals from 8 indicators across 4 timeframes (15m, 1H, 4H, 1D). It generates long/short trade signals with strength level, entry and target levels. Fully compatible with the Smart Matrix Display.

Auto Anchored VWAPs for FuturesAbout the Script
This indicator automatically plots five anchored VWAPs based on predefined starting times, offering traders key reference points across multiple timeframes. These starting points are hardcoded and cannot be customized, ensuring consistency across all time zones. Below are the anchored VWAPs and their respective starting times:
NY Session: Starts daily at 9:30 AM EST
Globex: Starts daily at 6:00 PM EST
Weekly: Resets every Sunday at 6:00 PM EST
Monthly: Anchored to the first session of the month at 6:00 PM EST
Yearly: Anchored to the first session of the year at 6:00 PM EST
How to Use the Script
1) Add the script to your chart.
2) Select the appropriate Daylight Savings Time format.
3) Customize the visual appearance to your preference.
4) Click "OK" to apply the changes.
Once configured, the VWAP levels will automatically adjust based on the predefined timeframes.
How the Script Works
The script calculates and plots anchored VWAPs at the predefined starting times listed above. As each session, week, month, and year progresses, the corresponding VWAP is recalculated and updated on the chart, providing traders with dynamic insights into market trends and volume-weighted price action.
VOLD IndicatorVOLD-Indicator can show us the trend of the day. The indicator shows us the value of the VOLD that is a ratio of the volume flowing in up-stocks divided by the volume flowing in down stocks. Readings above 3 and below -3 can be seen as relevant for a trend day.

FTB Cheklist🔍 FTB Cheklist – Precision-Based Breakout Strategy for Options Traders
FTB Cheklist is a tactical script built for serious day and swing traders looking to catch high-probability breakouts with clarity, confidence, and control.
This system is designed around key institutional concepts — combining volume spike breakouts, PDH/PDL levels, EMA alignment (8/13/50/200), and ATR-based price targets across the 30-minute, 1-hour, and daily timeframes. It visually guides your session entries and filters out noise, giving you clean, confirmed trade opportunities.
🔧 What It Does:
✅ Breakout Arrows when price breaks previous day high/low with volume confirmation & trend bias
📊 Dynamic Volume Spike Detection with time-sensitive multipliers (1.5 pre-noon, 1.2 after)
📈 Stacked EMAs Filter: Only show setups when trend is clearly in your favor
🎯 ATR-Based Price Targets: Projects 30m, 1h, and Daily levels upon breakout
🕐 Trading Hours Guidance overlay: Calls out the best times to trade (9:40–11:30 & 2:00–3:30)
🧭 Clean On-Chart Labels & Guidance to keep your execution focused and frictionless
🔑 Best For:
Day & swing traders of SPY, QQQ, and large-cap options
Traders who value structure, trend alignment, and measured targets
Avoiding FOMO and chop through visual clarity & volume precision
🔥 Built to respect bias. Built to respect time. Built for discipline .
FTB Cheklist isn’t just an indicator — it’s a trade execution assistant for serious technical traders. Load it up, trust the conditions, and trade the Cheklist.

ScalpSwing Pro SetupScript Overview
This script is a multi-tool setup designed for both scalping (1m–5m) and swing trading (1H–4H–Daily). It combines the power of trend-following , momentum , and mean-reversion tools:
What’s Included in the Script
1. EMA Indicators (20, 50, 200)
- EMA 20 (blue) : Short-term trend
- EMA 50 (orange) : Medium-term trend
- EMA 200 (red) : Long-term trend
- Use:
- EMA 20 crossing above 50 → bullish trend
- EMA 20 crossing below 50 → bearish trend
- Price above 200 EMA = uptrend bias
2. VWAP (Volume Weighted Average Price)
- Shows the average price weighted by volume
- Best used in intraday (1m to 15m timeframes)
- Use:
- Price bouncing from VWAP = reversion trade
- Price far from VWAP = likely pullback incoming
3. RSI (14) + Key Levels
- Shows momentum and overbought/oversold zones
- Levels:
- 70 = Overbought (potential sell)
- 30 = Oversold (potential buy)
- 50 = Trend confirmation
- Use:
- RSI 30–50 in uptrend = dip buying zone
- RSI 70–50 in downtrend = pullback selling zone
4. MACD Crossovers
- Standard MACD with histogram & cross alerts
- Shows trend momentum shifts
- Green triangle = Bullish MACD crossover
- Red triangle = Bearish MACD crossover
- Use:
- Confirm swing trades with MACD crossover
- Combine with RSI divergence
5. Buy & Sell Signal Logic
BUY SIGNAL triggers when:
- EMA 20 crosses above EMA 50
- RSI is between 50 and 70 (momentum bullish, not overbought)
SELL SIGNAL triggers when:
- EMA 20 crosses below EMA 50
- RSI is between 30 and 50 (bearish momentum, not oversold)
These signals appear as:
- BUY : Green label below the candle
- SELL : Red label above the candle
How to Trade with It
For Scalping (1m–5m) :
- Focus on EMA crosses near VWAP
- Confirm with RSI between 50–70 (buy) or 50–30 (sell)
- Use MACD triangle as added confluence
For Swing (1H–4H–Daily) :
- Look for EMA 20–50 cross + price above EMA 200
- Confirm trend with MACD and RSI
- Trade breakout or pullback depending on structure

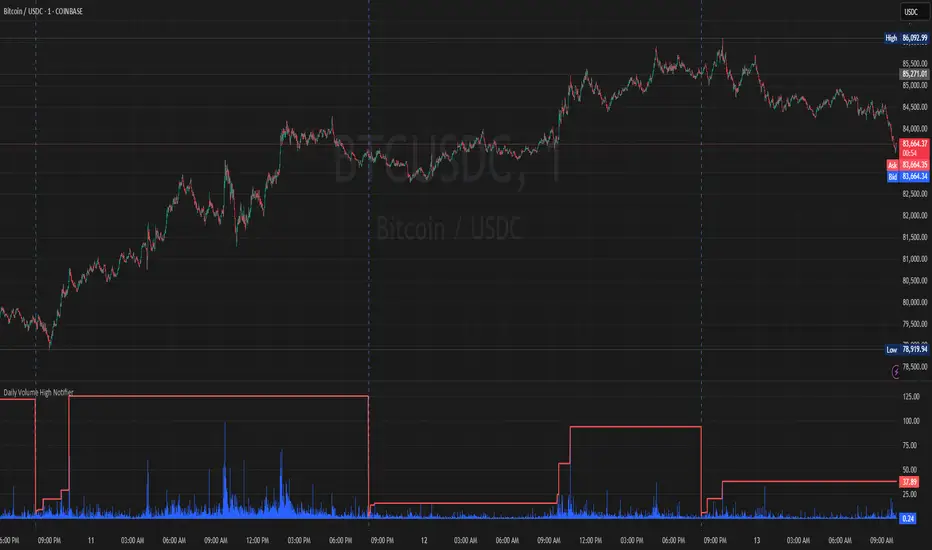
Daily Volume High Notifier📜 Script Description – Daily Volume High Notifier
This indicator monitors trade volume and sends an alert whenever a new daily high in volume is reached. The high volume is reset at the beginning of each trading day, allowing traders to stay informed of significant intraday volume spikes.
🛠️ Features:
Tracks the highest trade volume for the current day.
Resets the volume high tracker at the start of each new day.
Sends a real-time notification (alert()) whenever a new volume high is detected.
Useful for identifying unusual activity, potential breakouts, or institutional participation.
📊 Visual Elements:
Blue histogram for standard volume.
Red line showing the current day’s highest volume so far.
🔔 How to Use:
Add the script to any chart.
Enable alerts using the built-in alert() function.
Receive notifications every time volume hits a new high for the day.
🔔 Setting up Alerts in TradingView:
After adding this indicator to your chart:
Click the Alarm Clock (Alerts) icon.
Set condition: Daily Volume High Notifier → alert() function call .
Choose your alert type (app notification, email, popup, etc.).
Name it something like "Volume High Alert" and hit Create.
This tool is ideal for day traders, scalpers, and volume-based strategy traders who want to be instantly notified of spikes in market activity.
Advanced SMC Toolkit by MaazAdvanced SMC Toolkit by Maaz
The Advanced Smart Money Concepts (SMC) Toolkit is a comprehensive trading indicator designed to visualize key price action elements used by institutional traders. This powerful tool helps retail traders identify important market structures and potential reversal zones with precision.
Key Features:
Break of Structure (BOS) - Clearly identifies when price breaks previous swing points, signaling potential trend changes
Order Blocks - Highlights institutional entry areas that often become support and resistance
Fair Value Gaps (FVG) - Detects imbalances in price action where markets move too quickly, leaving unfilled gaps
Premium/Discount Zones - Divides the chart into value areas to identify when price is trading at premium or discount levels
Liquidity Levels - Shows both internal and external liquidity zones where stop orders accumulate
Customizable Settings - Adjust swing sensitivity, minimum FVG size, and toggle various display elements to suit your trading style
This indicator combines multiple SMC concepts into one powerful overlay, helping you visualize institutional order flow and make more informed trading decisions. Perfect for traders focused on price action, market structure, and institutional trading concepts.
Contact for Custom Development
For freelance algorithmic trading, custom indicators, or custom trading and investment tools development, contact Maaz at maazshulli@gmail.com. Specializing in Python, PineScript and trading systems development.

Step-Based Trailing Stop-Loss IndicatorThis indicator is built for momentum traders who want to maximize winning trades and minimize losses through a smart, step-based trailing stop-loss system. Instead of using a fixed Take Profit, this tool dynamically protects profits once the trade reaches a favorable RR (Risk-to-Reward) level.
How It Works:
Manual Entry Input
You enter your Entry Price and select Buy/Sell in the settings.
This flexibility allows backtesting or live trade tracking.
Initial Setup
Default SL: 50 ticks(Tested on us30,but works on any pair you just need to adjust SL)
TP for reference: 4R — can be used for benchmarking, but we don't limit profits with a hard TP.
Trailing Logic
Once price reaches 3R in profit:
The SL begins trailing.
It starts at 2R, keeping a 1R cushion behind the max profit.
For every 0.5R gain, SL also moves up by 0.5R:
Example: At 3.5R → SL is at 2.5R
At 5.0R → SL is at 4.0R
This trailing continues until the SL is hit or the trend exhausts.
Chart Features
🟧 Entry Line
🔴 Initial SL
🟢 Reference TP (4R, optional)
🟣 Dynamic Trailing SL
🏷️ Labels for Entry & SL levels

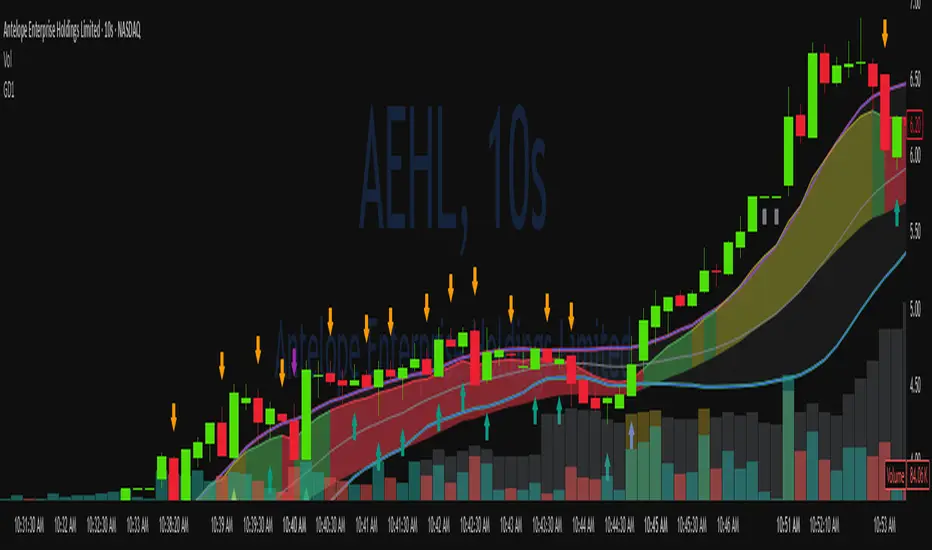
Green*DiamondGreen*Diamond (GD1)
Unleash Dynamic Trading Signals with Volatility and Momentum
Overview
GreenDiamond is a versatile overlay indicator designed for traders seeking actionable buy and sell signals across various markets and timeframes. Combining Volatility Bands (VB) bands, Consolidation Detection, MACD, RSI, and a unique Ribbon Wave, it highlights high-probability setups while filtering out noise. With customizable signals like Green-Yellow Buy, Pullback Sell, and Inverse Pullback Buy, plus vibrant candle and volume visuals, GreenDiamond adapts to your trading style—whether you’re scalping, day trading, or swing trading.
Key Features
Volatility Bands (VB): Plots dynamic upper and lower bands to identify breakouts or reversals, with toggleable buy/sell signals outside consolidation zones.
Consolidation Detection: Marks low-range periods to avoid choppy markets, ensuring signals fire during trending conditions.
MACD Signals: Offers flexible buy/sell conditions (e.g., cross above signal, above zero, histogram up) with RSI divergence integration for precision.
RSI Filter: Enhances signals with customizable levels (midline, oversold/overbought) and bullish divergence detection.
Ribbon Wave: Visualizes trend strength using three EMAs, colored by MACD and RSI for intuitive momentum cues.
Custom Signals: Includes Green-Yellow Buy, Pullback Sell, and Inverse Pullback Buy, with limits on consecutive signals to prevent overtrading.
Candle & Volume Styling: Blends MACD/RSI colors on candles and scales volume bars to highlight momentum spikes.
Alerts: Set up alerts for VB signals, MACD crosses, Green*Diamond signals, and custom conditions to stay on top of opportunities.
How It Works
Green*Diamond integrates multiple indicators to generate signals:
Volatility Bands: Calculates bands using a pivot SMA and standard deviation. Buy signals trigger on crossovers above the lower band, sell signals on crossunders below the upper band (if enabled).
Consolidation Filter: Suppresses signals when candle ranges are below a threshold, keeping you out of flat markets.
MACD & RSI: Combines MACD conditions (e.g., cross above signal) with RSI filters (e.g., above midline) and optional volume spikes for robust signals.
Custom Logic: Green-Yellow Buy uses MACD bullishness, Pullback Sell targets retracements, and Inverse Pullback Buy catches reversals after downmoves—all filtered to avoid consolidation.
Visuals: Ribbon Wave shows trend direction, candles blend momentum colors, and volume bars scale dynamically to confirm signals.
Settings
Volatility Bands Settings:
VB Lookback Period (20): Adjust to 10–15 for faster markets (e.g., 1-minute scalping) or 25–30 for daily charts.
Upper/Lower Band Multiplier (1.0): Increase to 1.5–2.0 for wider bands in volatile stocks like AEHL; decrease to 0.5 for calmer markets.
Show Volatility Bands: Toggle off to reduce chart clutter.
Use VB Signals: Enable for breakout-focused trades; disable to focus on Green*Diamond signals.
Consolidation Settings:
Consolidation Lookback (14): Set to 5–10 for small caps (e.g., AEHL) to catch quick consolidations; 20 for higher timeframes.
Range Threshold (0.5): Lower to 0.3 for stricter filtering in choppy markets; raise to 0.7 for looser signals.
MACD Settings:
Fast/Slow Length (12/26): Shorten to 8/21 for scalping; extend to 15/34 for swing trading.
Signal Smoothing (9): Reduce to 5 for faster signals; increase to 12 for smoother trends.
Buy/Sell Signal Options: Choose “Cross Above Signal” for classic MACD; “Histogram Up” for momentum plays.
Use RSI Div + MACD Cross: Enable for high-probability reversal signals.
RSI Settings:
RSI Period (14): Drop to 10 for 1-minute charts; raise to 20 for daily.
Filter Level (50): Set to 55 for stricter buys; 45 for sells.
Overbought/Oversold (70/30): Tighten to 65/35 for small caps; widen to 75/25 for indices.
RSI Buy/Sell Options: Select “Bullish Divergence” for reversals; “Cross Above Oversold” for momentum.
Color Settings:
Adjust bullish/bearish colors for visibility (e.g., brighter green/red for dark themes).
Border Thickness (1): Increase to 2–3 for clearer candle outlines.
Volume Settings:
Volume Average Length (20): Shorten to 10 for scalping; extend to 30 for swing trades.
Volume Multiplier (2.0): Raise to 3.0 for AEHL’s volume surges; lower to 1.5 for steady stocks.
Bar Height (10%): Increase to 15% for prominent bars; decrease to 5% to reduce clutter.
Ribbon Settings:
EMA Periods (10/20/30): Tighten to 5/10/15 for scalping; widen to 20/40/60 for trends.
Color by MACD/RSI: Disable for simpler visuals; enable for dynamic momentum cues.
Gradient Fill: Toggle on for trend clarity; off for minimalism.
Custom Signals:
Enable Green-Yellow Buy: Use for momentum confirmation; limit to 1–2 signals to avoid spam.
Pullback/Inverse Pullback % (50): Set to 30–40% for small caps; 60–70% for indices.
Max Buy Signals (1): Increase to 2–3 for active markets; keep at 1 for discipline.
Tips and Tricks
Scalping Small Caps (e.g., AEHL):
Use 1-minute charts with VB Lookback = 10, Consolidation Lookback = 5, and Volume Multiplier = 3.0 to catch $0.10–$0.20 moves.
Enable Green-Yellow Buy and Inverse Pullback Buy for quick entries; disable VB Signals to focus on Green*Diamond logic.
Pair with SMC+ green boxes (if you use them) for reversal confirmation.
Day Trading:
Try 5-minute charts with MACD Fast/Slow = 8/21 and RSI Period = 10.
Enable RSI Divergence + MACD Cross for high-probability setups; set Max Buy Signals = 2.
Watch for volume bars turning yellow to confirm entries.
Swing Trading:
Use daily charts with VB Lookback = 30, Ribbon EMAs = 20/40/60.
Enable Pullback Sell (60%) to exit after rallies; disable RSI Color for cleaner candles.
Check Ribbon Wave gradient for trend strength—bright green signals strong bulls.
Avoiding Noise:
Increase Consolidation Threshold to 0.7 on volatile days to skip false breakouts.
Disable Ribbon Wave or Volume Bars if the chart feels crowded.
Limit Max Buy Signals to 1 for disciplined trading.
Alert Setup:
In TradingView’s Alerts panel, select:
“GD Buy Signal” for standard entries.
“RSI Div + MACD Cross Buy” for reversals.
“VB Buy Signal” for breakout plays.
Set to “Once Per Bar Close” for confirmed signals; “Once Per Bar” for scalping.
Backtesting:
Replay on small caps ( Float < 5M, Price $0.50–$5) to test signals.
Focus on “GD Buy Signal” with yellow volume bars and green Ribbon Wave.
Avoid signals during gray consolidation squares unless paired with RSI Divergence.
Usage Notes
Markets: Works on stocks, forex, crypto, and indices. Best for volatile assets (e.g., small-cap stocks, BTCUSD).
Timeframes: Scalping (1–5 minutes), day trading (15–60 minutes), or swing trading (daily). Adjust settings per timeframe.
Risk Management: Combine with stop-losses (e.g., 1% risk, $0.05 below AEHL entry) and take-profits (3–5%).
Customization: Tweak inputs to match your strategy—experiment in replay to find your sweet spot.
Disclaimer
Green*Diamond is a technical tool to assist with trade identification, not a guarantee of profits. Trading involves risks, and past performance doesn’t predict future results. Always conduct your own analysis, manage risk, and test settings before live trading.
Feedback
Love Green*Diamond? Found a killer setup?
Triple Confirmation Scalper v2 - Alarm CompatibleTriple Confirmation Scalper Strategy
A high-probability scalping strategy combining trend momentum, overbought/sold conditions, and volume confirmation to filter low-noise signals.
📊 Strategy Logic
Trend Direction
Dual EMA crossover (9 & 21 periods) for momentum and trend bias.
Overbought/Oversold Zones
RSI (14-period) to avoid entries at extremes.
Volume Spike Filter
OBV + 20-period volume average to confirm breakout validity.
Dynamic Risk Management
Stop-loss: Adaptive to recent price action (5-candle low/high ±1%).
Take-profit: 1.5% target (1.5:1 risk/reward).
🔍 Advanced Features
Precision VWAP (20-period, HLC3-based) for dynamic S/R levels.
Visual Aids:
EMA/VWAP bands + trend-colored background.
Volume spike alerts.
TradingView Alerts pre-configured for long/short signals.
⚙️ Default Settings
Commission: 0.1% factored into backtests.
Mode: Supports both long/short positions.
⚠️ Disclaimer
This is a technical analysis tool, not financial advice.
Past performance ≠ future results. Test thoroughly in a demo account.
Adjust parameters (e.g., EMA periods, RSI thresholds) to match your risk tolerance.
✅ TradingView Compliance Notes:
No exaggerated claims (e.g., "100% win rate").
Clear disclaimer included.
Focus on objective strategy logic (no promotional language).

AI Volume StrategyAI Volume Strategy detects significant volume spikes and combines them with trend direction and candlestick color to generate buy and sell signals. The strategy uses an Exponential Moving Average (EMA) of volume to identify abnormal volume spikes that may indicate strong market activity. Additionally, it uses a 50-period EMA of price to filter the trend and decide on entry direction.
Key Features:
Volume Spike Detection: The strategy detects when the current volume exceeds the EMA of volume by a user-defined multiplier, signaling abnormal increases in market activity.
Trend Direction Filter: The strategy uses a 50-period EMA of price to determine the market trend. Buy signals are generated when the price is above the EMA (uptrend), and sell signals are generated when the price is below the EMA (downtrend).
Candle Color Filter: The strategy generates a buy signal only when the current candle is bullish (green) and a sell signal only when the current candle is bearish (red).
Exit after X Bars: The strategy automatically closes the position after a specified number of bars (default is 5 bars), but the exit condition can be adjusted based on user preference, timeframe, and backtesting results. The default exit is after 5 bars, but users can set it to 1 bar or any other number depending on their preferences and strategy.
Signals:
Buy Signal: Generated when a volume spike occurs, the trend is upward, and the current candle is bullish.
Sell Signal: Generated when a volume spike occurs, the trend is downward, and the current candle is bearish.
Alerts:
Buy Alert: Alerts the user when a buy signal is triggered.
Sell Alert: Alerts the user when a sell signal is triggered.
Visualization:
Buy Signal: A green label appears below the bar when the buy conditions are met.
Sell Signal: A red label appears above the bar when the sell conditions are met.
Volume EMA: Optionally, the Volume EMA line can be plotted on the chart to visualize volume trends.
This strategy helps traders identify potential entry points based on increased volume activity while considering trend direction and candlestick patterns. With the ability to adjust the exit condition, users can fine-tune the strategy to their specific needs and backtest results.

AI Volume SignalsAI Volume Signals
The AI Volume Signals indicator detects significant volume spikes and combines them with trend direction and candle color to generate buy and sell signals. This script utilizes an Exponential Moving Average (EMA) of volume to detect abnormal volume spikes, which could indicate strong market activity. It also filters signals based on the trend direction determined by a 50-period EMA of the price.
Key Features:
Volume Spike Detection: The indicator detects when the current volume exceeds the EMA of volume by a user-defined multiplier, signaling an unusual increase in market activity.
Trend Direction Filter: The 50-period EMA of the price is used to determine the market trend. Buy signals are generated when the price is above the EMA (uptrend), and sell signals occur when the price is below the EMA (downtrend).
Candle Color Filter: The indicator only generates a buy signal when the current candle is bullish (green), and a sell signal when the current candle is bearish (red).
Optional Volume EMA Line: A customizable option allows users to toggle the visibility of the Volume EMA line on the chart. By default, the line is hidden, but can be enabled in the settings.
Signals:
Buy Signal: Generated when a volume spike occurs, the trend is upward, and the current candle is bullish.
Sell Signal: Generated when a volume spike occurs, the trend is downward, and the current candle is bearish.
Alerts:
Buy Alert: Alerts the user when a buy signal is triggered.
Sell Alert: Alerts the user when a sell signal is triggered.
Visualization:
Buy Signal: A green label appears below the bar when the buy conditions are met.
Sell Signal: A red label appears above the bar when the sell conditions are met.
Volume EMA: A line representing the EMA of the volume is plotted on the chart for reference. The visibility of this line can be toggled in the settings.
This indicator can help traders identify potential entry points based on increased volume activity while considering trend direction and candlestick patterns.

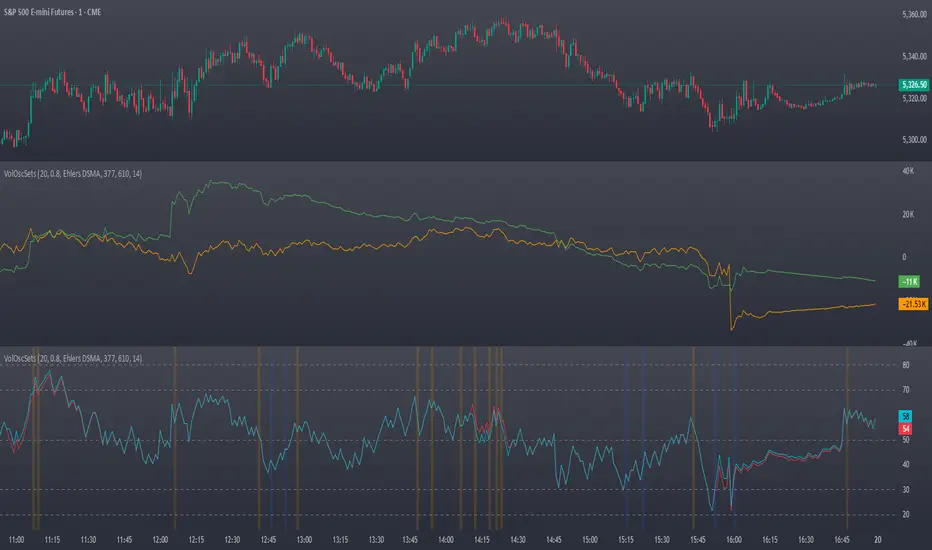
OBV & AD Oscillators with Dual Smoothing OptionsOn Balance Volume and Accumulation/Distribution
Overlaid into 1 and then some,
Now it is an oscillator!
3 customizable moving average types
- Ehlers Deviation Scaled Moving Average
- Volatility Dynamic Moving Average
- Simple Moving Average
Each with customizable periods
And with the ability to overlay a second set too
Default Settings have a longer period MA of 377 using Ehlers DSMA to better capture the standard view of OBV and A/D.
An extra overlay of a shorter period using a Volatility DMA uses Average True Range with its own custom settings, seeks to act more as an RSI
Combined Up down with volumeIndicator Description: "Combined Up/Down with Volume"
This Pine Script indicator combines price momentum and volume spikes to identify potential trend reversals or breakouts. It checks two key conditions:
Price Movement – A minimum percentage change (% check) in closing price.
Volume Spike – Trading volume exceeding a user-defined threshold (Volume above).
How It Works
1. Price Momentum Check
Calculates the 1-period Rate of Change (ROC) of the closing price.
Triggers when the absolute ROC ≥ % check (e.g., 5%).
2. Volume Spike Check
Compares current volume against a threshold (e.g., 1,000,000).
Triggers when volume exceeds this level.
3. Signal Plotting
If use = true:
Plots a purple circle below the bar when both conditions are met.
If use = false:
Plots a circle below the bar for price momentum alone.
Plots a circle (default position) for high volume alone.
