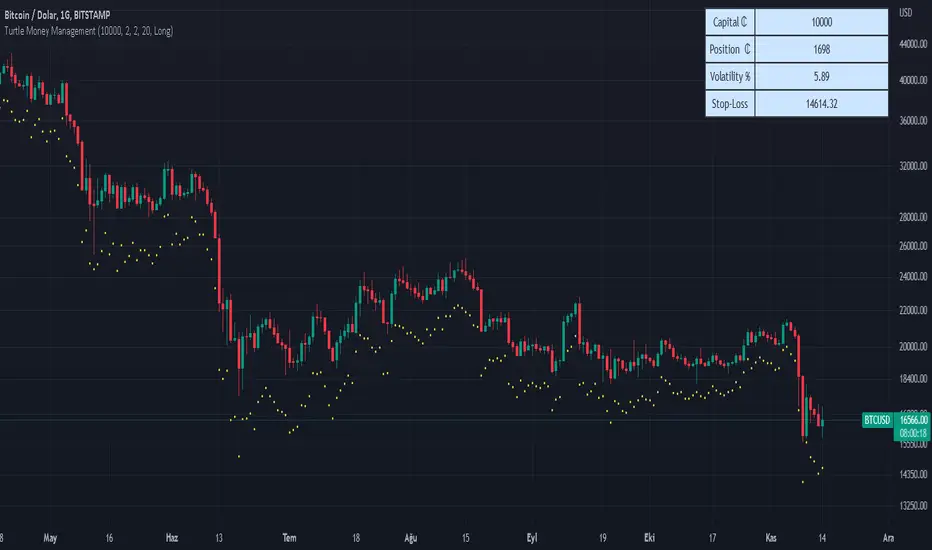
Turtle Money ManagementThe Turtle Trading approach* is a trend following system that uses volatility for position size. *(Richard Dennis & William Eckhardt )
Turtle traders use the N unit system for risk management, which has its own advantages. This indicator offers beginners a simple interface that uses the same logic. Using ATR (Average True Range) to measure volatility.
The indicator shows the suggested position size and stop-loss price. You need to activate position line to see how it behaved in the past. Information about the Turtle system shows that it works in a daily candle. Intraday candles can be misleading (for ATR) because of this indicator use daily ATR by default. I leave the choice to you.
Limits recommended by Turtle Traders
-
Single Trade % 2 Maximum risk
Single Market % 4 Maximum risk
Closely Correlated Markets % 6 Maximum risk
Loosely Correlated Markets % 10 Maximum risk
Single Direction – Long or Short % 12 Maximum risk
Turtle

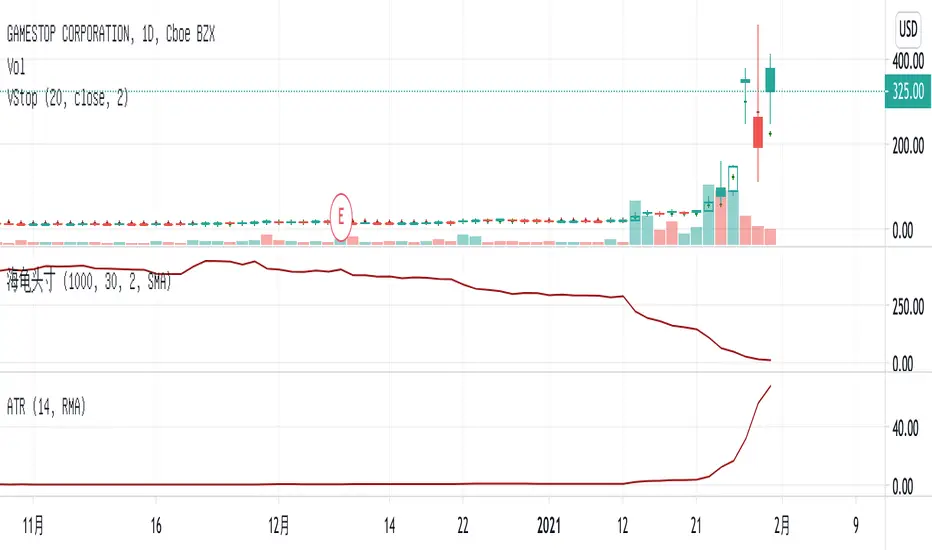
海龟头寸 (turtle position)Determine the position of the product to purchase according to:
1. max loss that you could tolerate
2. max volatility that you could tolerate (defined as the multiple of the current ATR)
For example:
current ATR = $5
max loss = $1000
volatility multiple = 2
The position will be
p = $1000 / $5 / 2 = 100 (shares)
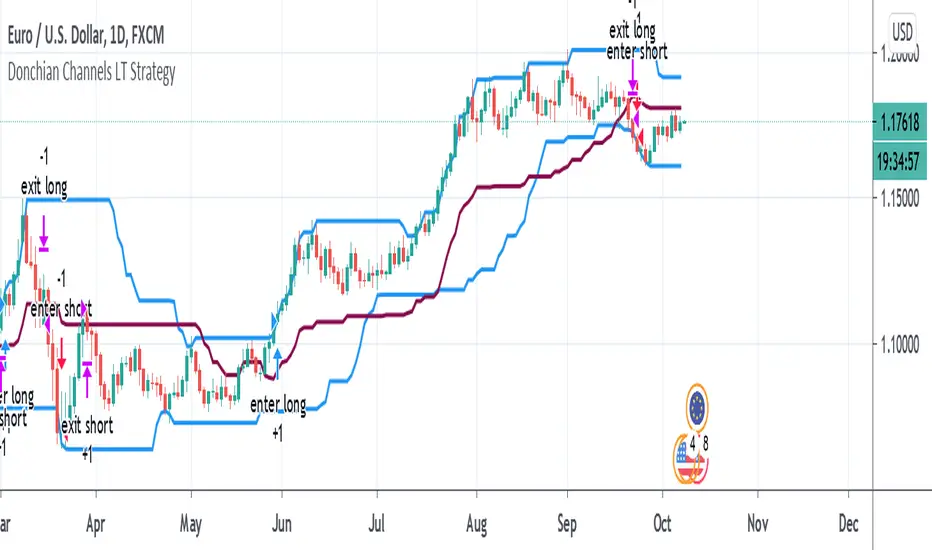
Donchian Channels Strategy - Long Term TrendFor Educational Purposes. Results can differ on different markets and can fail at any time. Profit is not guaranteed.
This only works in a few markets and in certain situations. Changing the settings can give better or worse results for other markets. This is a longer term trend following strategy that uses Donchian Channels for trend following and uses the upper and lower bands to find price breakouts to enter the market and then uses the middle band as a trailing stop to exit. DCs are known as the original trend following strategy made by Richard Donchian.
Usually the middle band uses the same length of the upper and lower bands in its calculation but I included the default option of using a middle band that is double the length of the other bands, but also an option to use the regular input length that most Donchian strategies use if needed. If long term trends are somehow found, this longer middle band lets the profits run longer and lets you see where the long trends were at if the market had any. The double lengthed middle band looks surprisingly very similar to a 3x ATR trailing stop, which is the recommended setting Wilder suggested for trend following. If a good ATR stop or other trailing stop can't be found, this longer middle band can act as a substitute for it.
For some reason I can't seem to find anything related to Donchian strategies on here despite the popularity and simplicity of it, not even a single working one to my liking, so I made my own. It seems this strategy only works in trending markets. I intentionally handpicked a market that the backtest does well on to illustrate the potential it might have for other markets where trending following strategies might work on and what to expect the results in those might be. Trend following strategies are said to have high profits but at the same time lower accuracy due to the failure rate of being able to catch the right trend. If you all got any suggestions or feedback please let me.
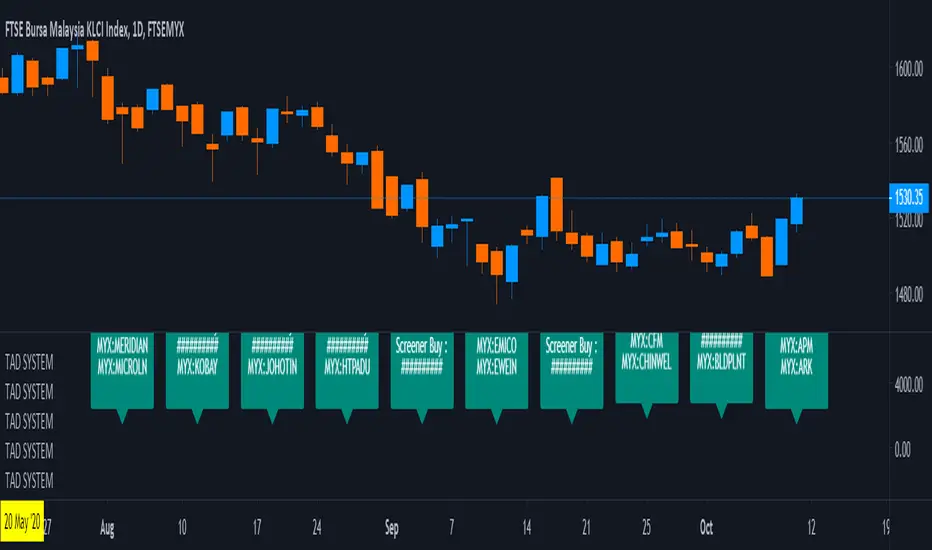
[SCREENER] TAD SYSTEM (Shariah MYX)TAD SYSTEM
TAD stands for TURTLE, ATOM and DUCK
With the three BUY arrows aligned accordingly with the TURTLE, ATOM and DUCK indicators, this triggers BUY signal
With the three SELL arrows aligned accordingly with the TURTLE, ATOM and DUCK indicators, this triggers SELL signal
F1 TURTLE
F1 ATOM
F1 DUCK
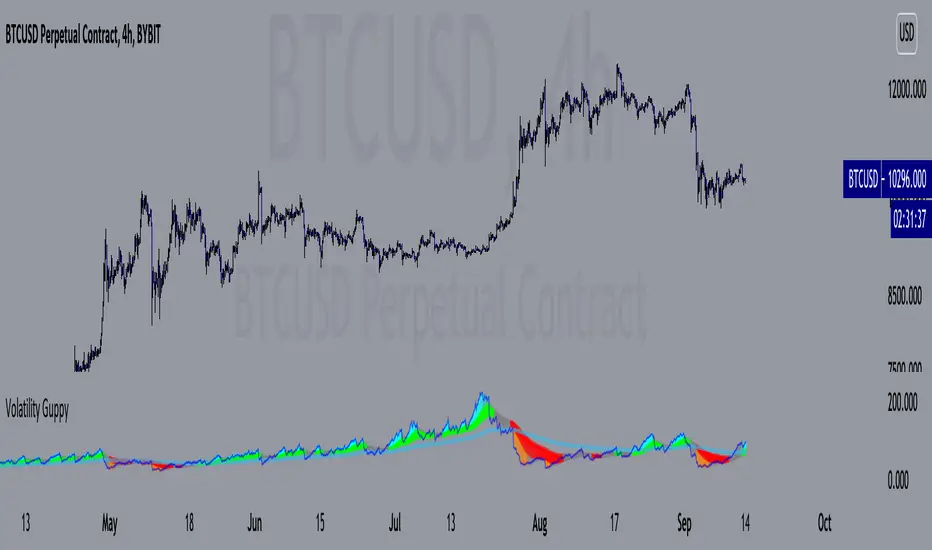
Volatility GuppyBased on my previous script "Turtle N Normalized," this script plots the CM SuperGuppy on the value of N to identify changing trends in the volatility of any instrument.
Turtle rules taken from an online PDF:
"The Turtles used a concept that Richard Dennis and Bill Eckhardt called N to represent the underlying volatility of a particular market.
N is simply the 20-day exponential moving average of the True Range, which is now more commonly known as the ATR. Conceptually, N represents the average range in price movement that a particular market makes in a single day, accounting for opening gaps. N was measured in the same points as the underlying contract.
The Turtles built positions in pieces which we called Units. Units were sized so that 1 N represented 1% of the account equity. Thus, a unit for a given market or commodity can be calculated using the following formula:
Unit = 1% of Account/(N x Dollars per Point)"
To normalize the Unit formula, this script instead takes the value of (close/N). Dollars per point = 1 for stocks and crypto, but will change depending on the contract specifications for individual futures .
"Since the Turtles used the Unit as the base measure for position size, and since those units were volatility risk adjusted, the Unit was a measure of both the risk of a position, and of the entire portfolio of positions."
When the EMA's are green, volatility is decreasing.
When the EMA's are red, volatility is increasing.
When the EMA's are grey, the trend is changing.
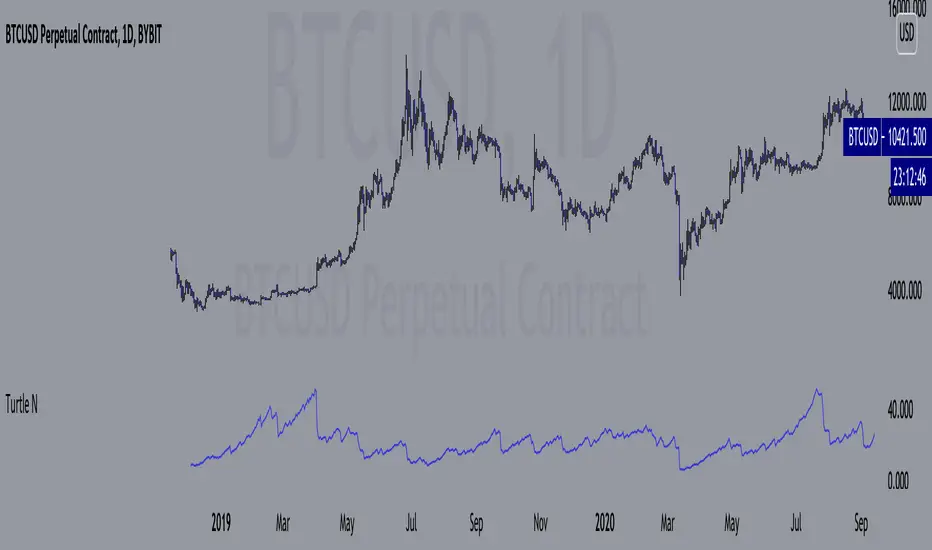
Turtle N NormalizedSimple script that calculates the normalized value of N. Rules taken from an online PDF containing the original Turtle system:
"The Turtles used a volatility-based constant percentage risk position sizing algorithm. The Turtles used a concept that Richard Dennis and Bill Eckhardt called N to represent the underlying volatility of a particular market.
N is simply the 20-day exponential moving average of the True Range, which is now more commonly known as the ATR. Conceptually, N represents the average range in price movement that a particular market makes in a single day, accounting for opening gaps. N was measured in the same points as the underlying contract.
The Turtles built positions in pieces which we called Units. Units were sized so that 1 N represented 1% of the account equity. Thus, a unit for a given market or commodity can be calculated using the following formula:
Unit = 1% of Account/(N x Dollars per Point)"
To normalize the Unit formula, this script instead takes the value of (close/N). Dollars per point = 1 for stocks and crypto, but will change depending on the contract specifications for individual futures.
"Since the Turtles used the Unit as the base measure for position size, and since those units were volatility risk adjusted, the Unit was a measure of both the risk of a position, and of the entire portfolio of positions."
When the value of N is high, volatility is low and you should be more risk-on.
When the value of N is low, volatility is high and you should be more risk-off.
Turtle Donchian ChannelDonchian channel with Turtle trading style: buy long when price is higher than high 20 candles (green up arrow), and sell short when price is lower than low 10 candles (red down arrow).

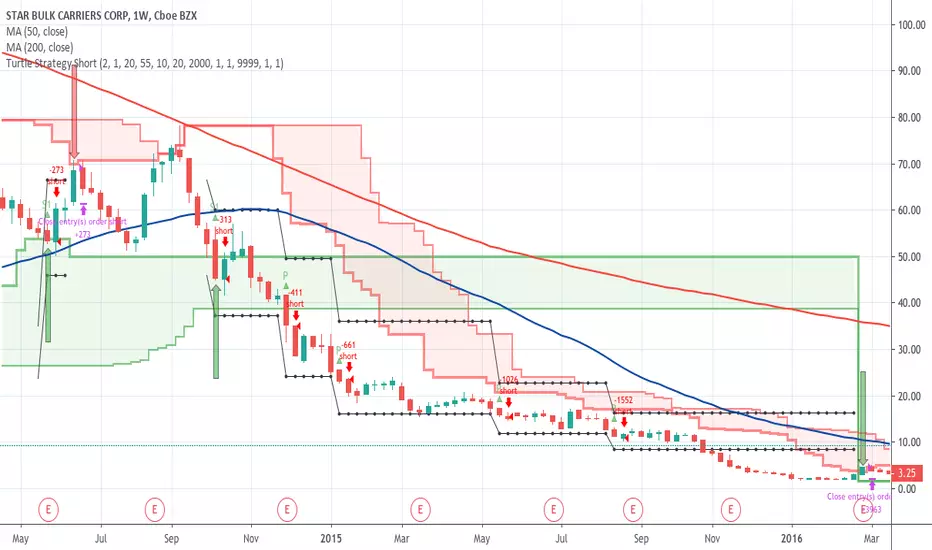
Turtle Strategy Short Sell VersionThis is a short-sell version of the strategy based on the famous turtle system.
www.tradingblox.com
In a nutshell, it a trend trading system where you are shorting on strength (in the downtrend), selling on
weakness (that it might be reversing).
positions should be entered when the price crosses under the 20-day low (S1 low) or 55-day low (S2 low).
positions should be exited when the prices crosses over the 10-day high (S1 high) or 20-day high (S2 high)
you can add positions at every unit (measured by multiple of n, where n=1 ATR)
stops should be placed at 2*n above every position entered, when the stop is hit exit your entire position.
positions should be entered everytime price crosses under S1 or S2, with one exception:
if the last trade was an S1 trade and it was a winning trade, skip the next trade unless the price crosses
under S2, if that is the case, you should take it.
S1 and S2 levels are also configurable for high and lows.
N multiple for stops and pyramid are also configurable
To change this from a strateg to a study:
1) uncomment the next line and comment out the strategy line.
2) at the end of the file comment out the last 2 lines
study(title="Turtle Study Short", overlay=true)
Real TurtleThere are a few different attempts at the turtle strategy on here, but none that I have seen thus far correctly follow the strategy as I know it. This version uses a stop order to trail out of the position by moving the stop order to match the exit channel or stoploss as the N*2( ema of True Range * 2). This version of turtle strategy also uses stop orders for entry on either side in order to enter at optimal time. The ability to specify a backtest period was borrowed from another script, I grabbed it so long ago I no longer remember from whom i borrowed it, if it was yours I will credit you if you PM me.
This version unlike others also allows you to specify a risk % so you only risk that percentage of your equity in a trade, as calculated from your stoploss.
Disclaimer: I have published several scripts in the past when i was first learning pinescript and they are all horrible please ignore those. I would delete them, but TV doesn't allow you to delete.

Turtle SystemFirst pinescript strategy I've ever written so still learning what is possible.
This strategy is based on the famous turtle system and tried to stay true
to the rules within the confines of what pinescript will allow me to do.
Features:
Green lines represents the 20/55 day highs (configurable)
Red lines represent the 10/20 day lows (configurable)
Purple line represents stop (defaults to 2N away configurable)
Pyramids up to 5 long positions (each 1N away configurable).
Arrows:
Up Arrow Green - 20 day long position entered
Up Arrow Purple - 55 day long position entered
Down Arrow Green - Winning trade exited out.
Down Arrow Red - Losing Trade either stopped out or exited out.
Code tracks successful wins as it is only allowed to enter positions if the last trade was not a wining trade.
One limitation, only supports Long trades although wouldn't be a lot of work to also make it support Short. NASDAQ:AAPL
Love to hear feedback on improvements, particularly to make it more robust.

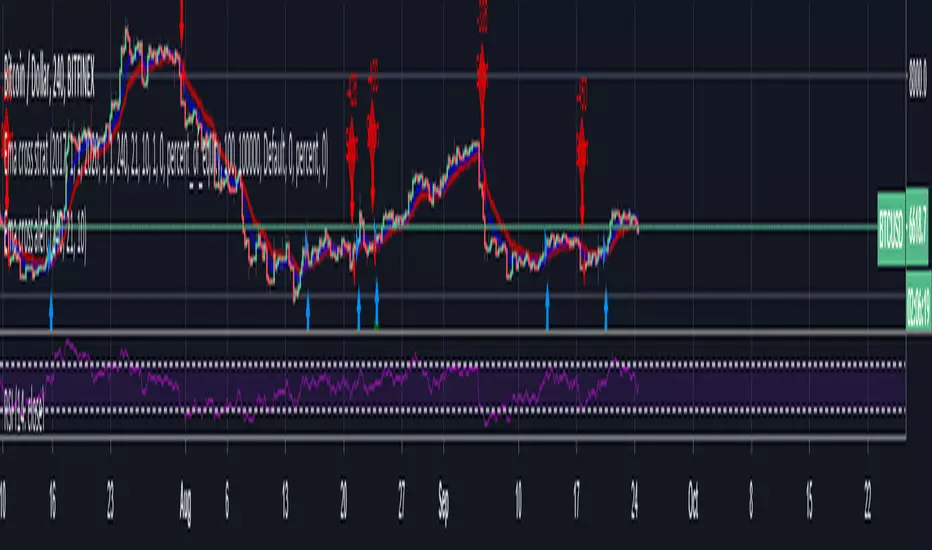
Ema cross strat / Turtle Trading This is just a simple EMA cross strategy which is meant to be similar to Turtle Trading Strategy.
It uses in default 4 Hour 21 / 10 EMA to long or short. This is not perfect but in the long run it will profit. Works best in bull market.
LINK TO ALERT :

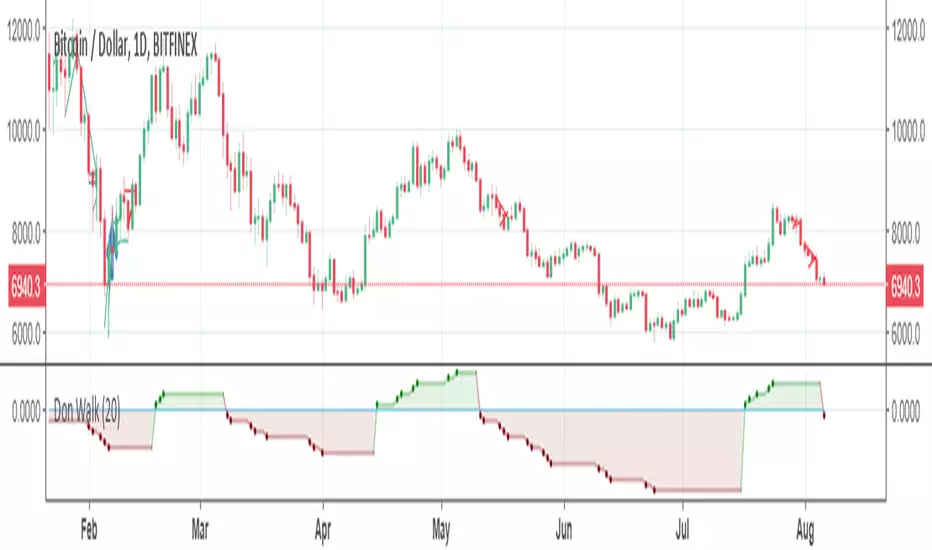
Consecutive Highs/LowsTrack consecutive new highs/lows outside the Donchian range. Fans of the oldschool Turtle Strategy should enjoy the visualization.
Same logic as my "Walking the Bands" script, just with Donchian breaks instead of Bollinger tags.
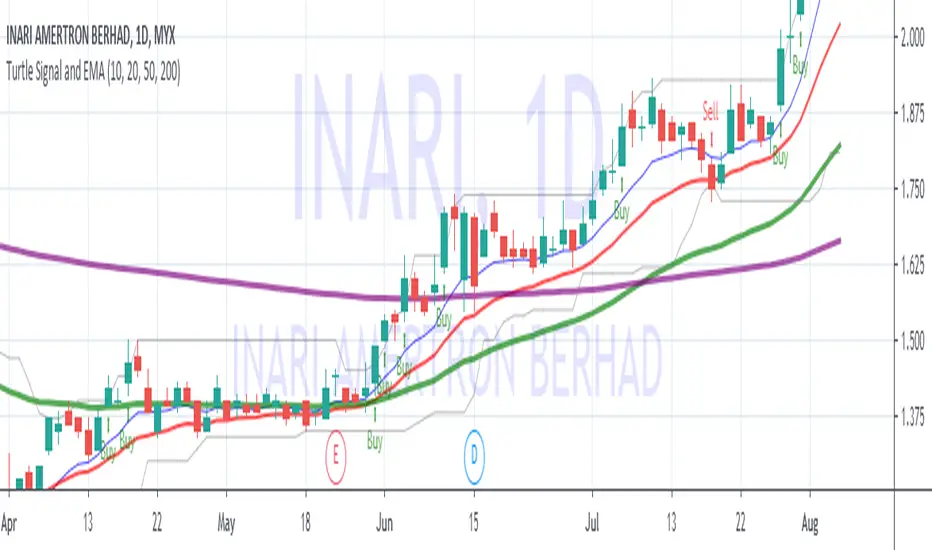
EMA Indicators with BUY sell SignalCombine 3 EMA indicators into 1. Buy and Sell signal is based on
- Buy signal based on 20 Days Highest High resistance
- Sell signal based on 10 Days Lowest Low support
Input :-
1 - Short EMA (20), Mid EMA (50) and Long EMA (200)
2 - Resistance (20) = 20 Days Highest High line
3 - Support (10) = 10 Days Lowest Low line
Price Channel v2Added parameters for source of highest and lowest line.
It's usefull for ultra volatile markets like cryptocurrencies and penny stocks. Using close price as source helps to filter out false breakout signals in turtle trading strategy.
