Altcoin Reversal or Correction DetectionINDICATOR OVERVIEW: Altcoin Reversal or Correction Detection
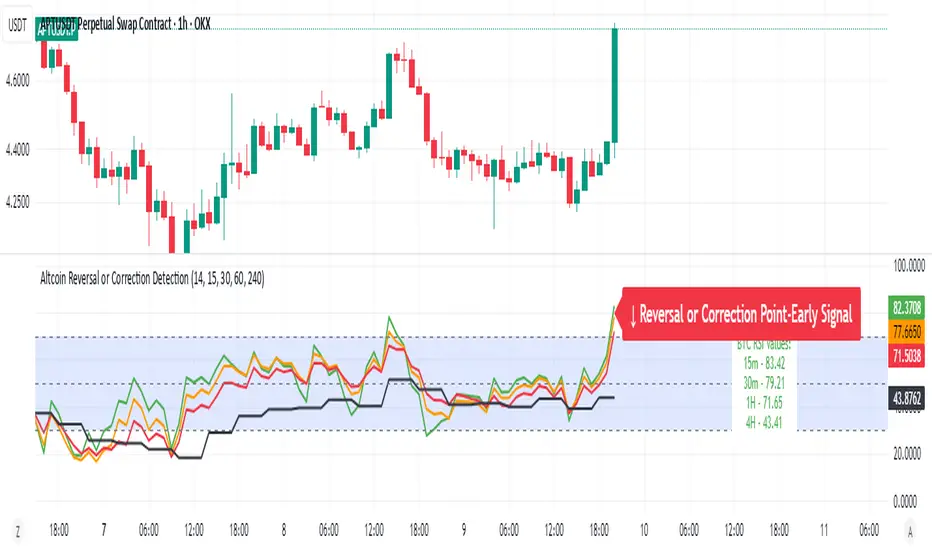
Altcoin Reversal or Correction Detection is a powerful crypto-specific indicator designed exclusively for altcoins by analyzing their RSI values across multiple timeframes alongside Bitcoin’s RSI. Since BTC's price movements have a strong influence on altcoins, this tool helps traders better understand whether a reversal or correction signal is truly reliable or just noise. Even if an altcoin appears oversold or overbought, it may continue trending with BTC—so this indicator gives you the full picture.
The indicator is optimized for CRYPTO MARKETS only. Not suitable for BTC itself—this is a precision tool built only for ALTCOINS only.
This indicator is not only for signals but also serves as a tool for observing all the information from different timeframes of BTC and altcoins collectively.
How the Calculation Works: Algorithm Overview
The Altcoin Reversal or Correction Detection indicator relies on an algorithm that compares the RSI values of the altcoin across multiple timeframes with Bitcoin's RSI values. This allows the indicator to identify key market moments where a reversal or correction might occur.
BTC-Altcoin RSI Correlation: The algorithm looks for the correlation between Bitcoin's price movements and the altcoin's price actions, as BTC often influences the direction of altcoins. When both Bitcoin and the altcoin show either overbought or oversold conditions in a significant number of timeframes, the indicator signals the potential for a reversal or correction.
Multi-Timeframe Confirmation: Unlike traditional indicators that may focus on a single timeframe, this tool checks multiple timeframes for both BTC and the altcoin. When the same overbought/oversold conditions are met across multiple timeframes, it confirms the likelihood of a trend reversal or correction, providing a more reliable signal. The more timeframes that align with this pattern, the stronger the signal becomes.
Overbought/Oversold Conditions & Extreme RSI Values: The algorithm also takes into account the size of the RSI values, especially focusing on extreme overbought and oversold levels. The greater the RSI values are in these extreme regions, the stronger the potential reversal or correction signal. This means that not only do multiple timeframes need to confirm the condition, but the magnitude of the overbought or oversold RSI level plays a crucial role in determining the strength of the signal.
Signal Strength Levels: The signals are classified into three levels:
Early Signal
Strong Signal
Very Strong Signal
By taking into account the multi-timeframe analysis of both BTC and the altcoin RSI values, along with the magnitude of these RSI values, the indicator offers a highly reliable method for detecting potential reversals and corrections.
Who Is This Indicator Suitable For?
This indicator can also be used to detect reversal points, but it is especially effective for scalping. It highlights potential correction points, making it perfect for quick entries during smaller market pullbacks or short-term trend shifts, which is more suitable for scalpers looking to capitalize on short-term movements
Integration with other tools
Use this tool alongside key Support and Resistance zones to further enhance your trade by filtering for even better quality entries and focusing only on high-quality reversal or correction setups. It can be also used with other indicators and suitable with other personalised strategies.
Трендовый анализ
Multi-Oscillator Adaptive KernelMulti-Oscillator Adaptive Kernel
Introduction
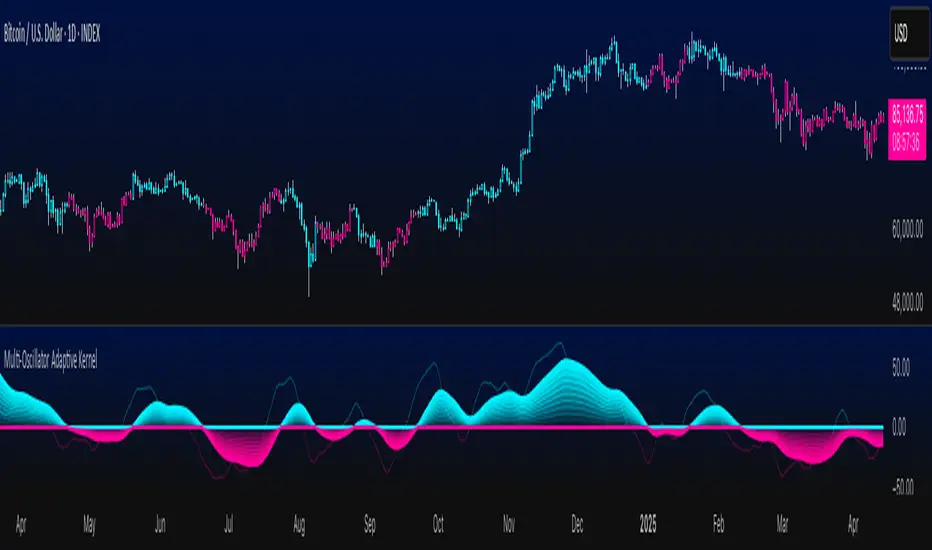
The Multi-Oscillator Adaptive Kernel (MOAK) is a powerful momentum-based indicator that fuses multiple popular oscillators RSI, Stochastic, MFI, and CCI into a single, adaptive tool. Through advanced kernel smoothing techniques, MOAK is engineered to filter out market noise and deliver clearer, more consistent trend signals. Whether in trending or ranging markets, MOAK equips traders with a holistic perspective on momentum across multiple timeframes.
Key Features
Oscillator Fusion: Combines normalized values from RSI, Stochastic, Money Flow Index, and Commodity Channel Index to capture broader momentum shifts.
Advanced Kernel Smoothing: Utilizes three kernel smoothing algorithms—Exponential, Linear, and Gaussian—to refine raw oscillator data and minimize false signals.
Customizable Sensitivity: Traders can tailor the indicator's responsiveness by adjusting lookback periods, kernel lengths, and smoothing sensitivity.
Clear Visual Signals: Features a color-coded signal line—cyan for bullish, magenta for bearish—with gradient fills to reflect trend intensity and direction.
Overbought/Oversold Zones: A central zero line helps identify momentum extremes, with layered gradients to indicate the strength of potential reversals or continuations.
Adaptive Signal Design: Dynamically adjusts its output to align with changing market conditions, offering reliable performance across diverse market environments.
How It Works
MOAK starts by calculating and normalizing input from four widely used momentum oscillators: Relative Strength Index (RSI), Stochastic Oscillator, Money Flow Index (MFI), and Commodity Channel Index (CCI). These values are then aggregated to form a composite momentum reading.
To reduce market noise and enhance signal clarity, the composite reading is passed through one of three user-selectable kernel smoothing filters—Exponential, Linear, or Gaussian. These algorithms shape the data curve, softening abrupt fluctuations while preserving meaningful trends.
The resulting smoothed output is rendered visually as a central signal line, colored cyan for upward momentum and magenta for downward momentum. A series of gradient fills around this line illustrates the intensity of the underlying momentum, with the zero line acting as a visual boundary between overbought and oversold regions. Users can customize key parameters such as lookback window, kernel length, and sensitivity level, ensuring the indicator can be optimized for different assets and trading styles.
Examples
MOAK is able to provide clear trend detection on large cap token such as Bitcoin in the example shown below and resistant to noise during consolidation period.
Downside positions are also handled by the indicator, this time on Solana which is more volatile than Bitcoin but even with more volatility MOAK was able to catch an early entry in the downside move.
Below an example on a lower timeframe with a low cap token Fartcoin where MOAK triggered an early entry on a positive uptrend.
Conclusion
MOAK is a sophisticated yet intuitive momentum indicator, merging the strengths of multiple oscillators into a cohesive and adaptive signal. Its kernel-based smoothing and customizable parameters make it a valuable tool for traders seeking to identify trend direction, assess momentum strength, and filter out short-term noise with precision. Ideal for both trend-following and range-trading strategies, MOAK offers a versatile edge in dynamic market conditions.
Disclaimer
This indicator is provided for informational and educational purposes only. It does not constitute financial advice, nor does it guarantee specific results. Always perform your own analysis and consult a licensed financial advisor before making any trading decisions. Use at your own risk.
Dynamic Volume Profile OscillatorDynamic Volume Profile Oscillator
Introduction
The Dynamic Volume Profile Oscillator (DVPO) is an advanced technical analysis tool that merges volume profiling with price action dynamics to enhance trend identification and improve trade entry precision. Unlike conventional oscillators that rely solely on price-based metrics, DVPO incorporates adaptive volume-weighted mean deviations to present a more responsive and insightful perspective on market behavior. This makes it a powerful instrument for traders seeking refined momentum insights and context-aware overbought/oversold detection.
Key Features
Adaptive Volume Profiling: Utilizes real-time volume data to adjust the oscillator’s sensitivity to prevailing market activity, enabling more accurate trend and exhaustion zone identification.
Mean Reversion Mode: Highlights potential reversion points when price deviates significantly from volume-weighted norms, ideal for contrarian and range-bound strategies.
Oscillator Smoothing: Integrates optional smoothing filters to reduce noise and provide clearer directional signals without sacrificing responsiveness.
Dynamic Midline & Zones: Features an evolving midline calibrated to the current volume-weighted context, along with dynamically adjusting overbought and oversold zones.
Signal Crossovers: Generates actionable momentum signals when the oscillator crosses key thresholds or the midline, aiding in timing entries and exits.
Gradient Zone Visualization: Visually represents intensity and directional bias through gradient color zones, helping users quickly assess momentum strength and market condition shifts.
How It Works
The DVPO calculates deviations from a volume-weighted average price baseline across a defined lookback period. These deviations are then transformed into an oscillator that fluctuates above and below a dynamic midline, which represents the fair value zone based on recent volume distribution.
To enhance interpretability, the indicator introduces:
Dynamic Zones that expand or contract based on current volatility and volume skewness.
Smoothing algorithms (optional) that can be applied to reduce erratic movements caused by sudden spikes in volume.
Gradient coloring to reflect the strength and direction of the momentum — darker tones indicate stronger trends, while lighter ones suggest potential reversals or weakening trends.
Crossover logic that detects when the oscillator line crosses above or below the midline or critical thresholds, often coinciding with trend initiations or reversals.
Conclusion
The Dynamic Volume Profile Oscillator offers a significant enhancement to traditional momentum indicators by intelligently adapting to both price and volume shifts. Whether used for trend following, mean reversion, or breakout confirmation, its comprehensive design provides traders with an intuitive yet powerful edge in identifying actionable market signals across varying conditions.
Disclaimer
This indicator is intended for educational and informational purposes only. It does not constitute financial advice or a recommendation to buy or sell any financial instrument. Users should perform their own due diligence and consult a qualified financial advisor before making any trading decisions.

Dynamic Momentum BandsDynamic Momentum Bands
Introduction
The Dynamic Momentum Bands indicator is a powerful analytical tool designed to help traders identify the strength and direction of market momentum with greater precision. By combining key technical methodologies such as Relative Strength Index (RSI), adaptive volatility analysis, and customizable moving averages this indicator offers a multi-dimensional perspective on evolving market conditions. Whether in trending or ranging environments, Dynamic Momentum Bands aim to deliver actionable insights that enhance decision-making and risk management.
Key Features
Adaptive Band Calculation: The bands adjust dynamically in response to market conditions, allowing them to expand during volatile periods and contract during consolidation phases.
RSI-Driven Volatility Scaling: Integrates RSI analysis to scale the width of the bands based on momentum strength, creating a responsive and context-aware framework for trend evaluation.
Multiple Moving Average Options: Offers flexibility with various smoothing techniques, enabling users to tailor the indicator to their preferred strategies (e.g., EMA, SMA, WMA).
Smooth Gradient-Based Visualization: Enhances visual clarity with color gradients that reflect momentum intensity and directional bias, supporting intuitive interpretation of the market state.
How It Works
The Dynamic Momentum Bands indicator operates by combining three core components:
Adaptive Moving Averages: A central baseline is calculated using a selected moving average type. This baseline reflects the general price trend over a user-defined lookback period.
Volatility-Scaled Band Widths: Band distances from the central average are determined using an RSI-based volatility model. Higher RSI values and volatility readings cause the bands to widen, signaling stronger price momentum or potential breakouts.
Gradient Visualization: The bands are color-coded with gradient fills to reflect changes in momentum strength, providing real-time visual cues about potential trend shifts or exhaustion points.
This integration of methodologies allows the indicator to remain responsive to price action while maintaining a smooth, noise-filtered representation of market dynamics.
Conclusion
The Dynamic Momentum Bands indicator offers a versatile and insightful approach to tracking market momentum and volatility. Its adaptive design and multifactor methodology make it suitable for traders who seek a deeper understanding of price behavior beyond conventional moving average envelopes. By delivering a visually rich and responsive analysis tool, it empowers users to make more informed trading decisions across various market environments.
Disclaimer
This indicator is intended for educational and informational purposes only. It does not constitute financial advice or a recommendation to buy or sell any financial instrument. Users are advised to conduct their own analysis and consult with a licensed financial advisor before making any trading decisions.

DEMA SuperTrendDEMA SuperTrend
Introduction
The DEMA SuperTrend is a sophisticated trend-following indicator that integrates the speed and smoothness of the Double Exponential Moving Average (DEMA) with the classic SuperTrend methodology. Designed for traders seeking a more responsive alternative to standard trend indicators, the DEMA SuperTrend helps identify the prevailing market direction with minimal lag. It plots directly on the price chart, making it intuitive and accessible for real-time analysis across various timeframes and trading instruments.
Key Features
DEMA-Based Smoothing: Enhances traditional SuperTrend signals by applying DEMA, reducing signal lag and improving responsiveness to market changes.
Dynamic Trend Visualization: Clearly marks uptrend and downtrend phases with adaptive bands that follow price action.
Customizable Inputs: Users can tailor the ATR period, multiplier, and DEMA length to suit their strategy and trading style.
Visual Themes: Custom color schemes and line styles offer a personalized charting experience, supporting better clarity and decision-making.
How It Works
The DEMA SuperTrend calculates the Average True Range (ATR) to measure market volatility and applies a multiplier to determine the band offset. Instead of using a standard moving average, it employs the Double Exponential Moving Average to smooth the price series. The result is a responsive overlay that adjusts more quickly to market shifts compared to the traditional SuperTrend.
Uptrend: Triggered when the price closes above the DEMA-adjusted upper band.
Downtrend: Triggered when the price closes below the DEMA-adjusted lower band.
Band Switching: When a crossover occurs, the indicator switches the band to the opposite side of the price, signaling a potential change in trend direction.
Visual cues and color-coded zones on the chart enhance interpretability, making it easier for traders to react promptly to shifts in momentum.
Conclusion
The DEMA SuperTrend indicator combines the best of both worlds—robust trend-following logic and advanced smoothing—offering traders a powerful tool for identifying and tracking market trends with enhanced accuracy. Its versatility, responsiveness, and customization features make it suitable for both intraday and swing trading strategies.
Disclaimer
This indicator is intended for educational and informational purposes only. It does not constitute financial advice or a recommendation to buy or sell any financial instrument. Users should conduct their own research and risk assessment before making trading decisions.

MA Smoothed RSI For LoopMA Smoothed RSI For Loop
Introduction
The MA Smoothed RSI For Loop is a refined momentum indicator that enhances the classic Relative Strength Index (RSI) through advanced smoothing techniques and intelligent visual cues. By applying a moving average smoothing process within a for loop structure and integrating upper and lower threshold logic, this tool enables traders to detect trends with greater clarity and robustness. It is specifically built for traders who seek high-confidence signals through smoothed momentum analysis and contextual visual feedback.
Key Features
For Loop RSI Smoothing: Applies iterative moving average smoothing to the RSI using a for loop, reducing false signals and improving overall trend accuracy.
Threshold-Based Trend Detection: Incorporates upper and lower RSI thresholds to filter out weak signals and confirm strong momentum-driven trends.
Customizable Moving Averages: Supports a variety of moving average types (such as SMA, EMA, WMA) and lengths for tailored responsiveness.
Dynamic Color Feedback: Colors adapt based on RSI position and momentum, making it easy to interpret strength, reversal zones, or trend continuations.
Real-Time Trend Table: Trend Direction (uptrend/downtrend), Strength of Trend (based on RSI slope and threshold behavior) and Duration (number of bars in the current trend phase).
Weighted Loop Control: Allows users to apply weights during the smoothing loop, fine-tuning the indicator’s sensitivity.
How It Works
The indicator begins by computing the RSI from price data. It then enters a for loop where the RSI is repeatedly smoothed with a chosen moving average. This recursive process stabilizes the signal, minimizing the effects of short-term noise.
Upper and lower RSI thresholds are applied to define meaningful zones of momentum. Only when the smoothed RSI crosses and sustains beyond these thresholds is a trend considered significant. The direction and persistence of these movements are visually encoded using dynamic color schemes and captured numerically in the trend table.
This dual-layered method smoothing and threshold filtering provides a robust structure for identifying and monitoring meaningful price momentum.
Use Case
In the example described above we have one long and short positions early triggered once the momentum signal crossed its related threshold up in the case of bullish trend and down for the bearish one.
Conclusion
The MA Smoothed RSI For Loop offers a sophisticated approach to trend analysis by blending smoothed RSI logic with threshold-based confirmation and rich visual interpretation.
Disclaimer
This indicator is designed for educational and informational use only. It should not be construed as financial advice or a recommendation to trade. Always perform your own analysis and consult a qualified financial advisor before making investment decisions. Use at your own risk.

Magnetic Zones - Multi TimeframeKey Features and Benefits:
1. Multiple Timeframe Analysis
- Daily (D) timeframe for primary trend
- Weekly (W) for longer-term perspective
- Monthly (M) for major structural levels
2. Support/Resistance Levels
- PDHL (Previous Day High/Low)
- Pivot Points (P)
- Multiple SR levels (SR1-SR6)
- Color-coded for easy identification
3. Trading Applications:
- Identify key support/resistance zones
- Find potential reversal areas
- Plan entries and exits
- Set stop-loss levels
How to Use:
1. Zone Analysis
- Green zones indicate support areas
- Red zones show resistance levels
- Gray zones represent subsidiary levels
2. Multiple Timeframe Strategy
- Use Daily zones for intraday trading
- Weekly zones for swing trading
- Monthly zones for position trading
3. Moving Average Integration
- Optional EMA/SMA for trend confirmation
- Customize MA settings for your strategy
- Use MA crossovers with zones
4. Best Practices:
- Look for price reaction at zone intersections
- Higher probability trades when multiple zones align
- Use box transparency to gauge zone strength
- Combine with volume for better confirmation
5. Risk Management:
- Place stops beyond relevant zones
- Scale positions based on zone strength
- Use zone boundaries for position sizing

Smart Technical Matrix v6 - Display OnlySmart Technical Matrix Analyzer - This script analyzes 32 technical signals from 8 indicators across 4 timeframes (15m, 1H, 4H, 1D). It generates long/short trade signals with strength level, entry and target levels. Fully compatible with the Smart Matrix Display.

Parabolic RSI [ChartPrime]The Parabolic RSI indicator applies the Parabolic SAR directly to the Relative Strength Index (RSI) . This combination helps traders identify trend shifts and potential reversal points within the RSI framework. The indicator provides both regular and strong signals based on whether the Parabolic SAR crosses above or below key RSI thresholds.
⯁ KEY FEATURES
Parabolic SAR Applied to RSI – Tracks momentum shifts within the RSI indicator.
Dynamic SAR Dots – Plots SAR levels directly on the RSI for visual clarity.
Threshold-Based Signal Filtering – Uses upper (70) and lower (30) RSI levels to determine strong signals.
Simple and Strong Signal System :
Big Diamonds (Strong Signals) – Appear when Parabolic SAR crosses above 70 or below 30 RSI, indicating potential reversals.
Small Diamonds (Regular Signals) – Appear when Parabolic SAR flips inside the RSI range, signaling weaker trend shifts.
Chart Overlay Signals – Highlights strong RSI-based trend shifts directly on the price chart.
Fully Customizable – Modify RSI length, SAR parameters, colors, and signal displays.
⯁ HOW TO USE
Look for strong signals (big diamonds) when SAR flips above 70 RSI (overbought) or below 30 RSI (oversold) for potential reversals.
Use regular signals (small diamonds) for minor trend shifts within the RSI range.
Combine with price action and other indicators to confirm entry and exit points.
Adjust the SAR acceleration factors to fine-tune sensitivity based on market conditions.
⯁ CONCLUSION
The Parabolic RSI indicator merges trend-following and momentum-based analysis by applying the Parabolic SAR to RSI. This allows traders to detect trend shifts inside the RSI space with an intuitive diamond-based signal system . Whether used alone or as part of a broader trading strategy, this indicator provides a clear and structured approach to identifying momentum reversals and potential trading opportunities.

Gradient Range [BigBeluga]
This indicator highlights range-bound market conditions by dynamically plotting gradient-colored candlesticks within a defined price box. It detects whether the market is ranging or trending using ADX and can identify mean reversion points when price steps outside the established range.
🔵KEY FEATURES:
Range Detection Box:
➣ A transparent box is drawn based on the highest and lowest price close over a user-defined period.
➣ Helps visualize range boundaries and the midline for support/resistance reference.
Gradient Candlestick Coloring:
➣ Candles inside the range are colored with a gradient from top to bottom based on proximity to the midline.
➣ Top range candles are shaded with bearish tones, while bottom range candles use bullish tones.
Ranging/Trending State Detection:
➣ Uses ADX to determine if the market is currently in a ranging or trending state.
➣ A label in the bottom right corner shows a real-time status (🟢 Ranging / 🟡 Trending).
Mean Reversion Signal Circles:
➣ When the market is ranging, white circles are plotted at highs/lows that breach the box boundary, indicating potential mean reversion points.
➣ These levels can act as fade trade setups or exhaustion markers.
🔵USAGE:
Range Trading: Trade between the upper and lower boundaries during range-bound conditions with clearer visual feedback.
Mean Reversion Plays: Use circle signals as early alerts to identify when price extends beyond the range and may revert to the mean.
Visual Trend Strength: Instantly recognize where price is concentrated inside the range via the color gradient system.
Ranging Filter: Use the ADX label to avoid false setups during strong trending periods.
Gradient Range provides an elegant and data-driven approach to range-bound market analysis. With its gradient visualization and smart reversion detection, it empowers traders to better time entries and exits within consolidation zones.

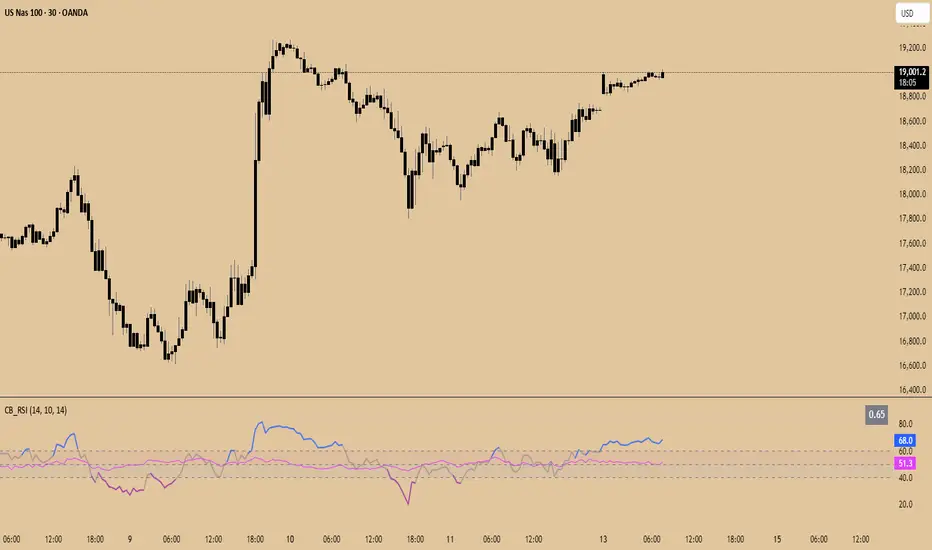
Constance Brown RSI with Composite IndexConstance Brown RSI with Composite Index
Overview
This indicator combines Constance Brown's RSI interpretation methodology with a Composite Index and ATR Distance to VWAP measurement to provide a comprehensive trading tool. It helps identify trends, momentum shifts, overbought/oversold conditions, and potential reversal points.
Key Features
Color-coded RSI zones for immediate trend identification
Composite Index for momentum analysis and divergence detection
ATR Distance to VWAP for identifying extreme price deviations
Automatic divergence detection for early reversal warnings
Pre-configured alerts for key trading signals
How to Use This Indicator
Trend Identification
The RSI line changes color based on its position:
Blue zone (RSI > 50): Bullish trend - look for buying opportunities
Purple zone (RSI < 50): Bearish trend - look for selling opportunities
Gray zone (RSI 40-60): Neutral/transitional market - prepare for potential breakout
The 40-50 area (light blue fill) acts as support during uptrends, while the 50-60 area (light purple fill) acts as resistance during downtrends.
// From the code:
upTrendZone = rsiValue > 50 and rsiValue <= 90
downTrendZone = rsiValue < 50 and rsiValue >= 10
neutralZone = rsiValue > 40 and rsiValue < 60
rsiColor = neutralZone ? neutralRSI : upTrendZone ? upTrendRSI : downTrendRSI
Momentum Analysis
The Composite Index (fuchsia line) provides momentum confirmation:
Values above 50 indicate positive momentum
Values below 40 indicate negative momentum
Crossing above/below these thresholds signals potential momentum shifts
// From the code:
compositeIndexRaw = rsiChange / ta.stdev(rsiValue, rsiLength)
compositeIndex = ta.sma(compositeIndexRaw, compositeSmoothing)
compositeScaled = compositeIndex * 10 + 50 // Scaled to fit 0-100 range
Overbought/Oversold Detection
The ATR Distance to VWAP table in the top-right corner shows how far price has moved from VWAP in terms of ATR units:
Extreme positive values (orange/red): Potentially overbought
Extreme negative values (purple/red): Potentially oversold
Near zero (gray): Price near average value
// From the code:
priceDistance = (close - vwapValue) / ta.atr(atrPeriod)
// Color coding based on distance value
Divergence Trading
The indicator automatically detects divergences between the Composite Index and price:
Bullish divergence: Price makes lower low but Composite Index makes higher low
Bearish divergence: Price makes higher high but Composite Index makes lower high
// From the code:
divergenceBullish = ta.lowest(compositeIndex, rsiLength) > ta.lowest(close, rsiLength)
divergenceBearish = ta.highest(compositeIndex, rsiLength) < ta.highest(close, rsiLength)
Trading Strategies
Trend Following
1. Identify the trend using RSI color:
Blue = Uptrend, Purple = Downtrend
2. Wait for pullbacks to support/resistance zones:
In uptrends: Buy when RSI pulls back to 40-50 zone and bounces
In downtrends: Sell when RSI rallies to 50-60 zone and rejects
3. Confirm with Composite Index:
Uptrends: Composite Index stays above 50 or quickly returns above it
Downtrends: Composite Index stays below 50 or quickly returns below it
4. Manage risk using ATR Distance:
Take profits when ATR Distance reaches extreme values
Place stops beyond recent swing points
Reversal Trading
1. Look for divergences
Bullish: Price makes lower low but Composite Index makes higher low
Bearish: Price makes higher high but Composite Index makes lower high
2. Confirm with ATR Distance:
Extreme readings suggest potential reversals
3. Wait for RSI zone transition:
Bullish: RSI crosses above 40 (purple to neutral/blue)
Bearish: RSI crosses below 60 (blue to neutral/purple)
4. Enter after confirmation:
Use candlestick patterns for precise entry
Place stops beyond the divergence point
Four pre-configured alerts are available:
Momentum High: Composite Index above 50
Momentum Low: Composite Index below 40
Bullish Divergence: Composite Index higher low
Bearish Divergence: Composite Index lower high
Customization
Adjust these parameters to optimize for your trading style:
RSI Length: Default 14, lower for more sensitivity, higher for fewer signals
Composite Index Smoothing: Default 10, lower for quicker signals, higher for less noise
ATR Period: Default 14, affects the ATR Distance to VWAP calculation
This indicator works well across various markets and timeframes, though the default settings are optimized for daily charts. Adjust parameters for shorter or longer timeframes as needed.
Happy trading!
VOLD IndicatorVOLD-Indicator can show us the trend of the day. The indicator shows us the value of the VOLD that is a ratio of the volume flowing in up-stocks divided by the volume flowing in down stocks. Readings above 3 and below -3 can be seen as relevant for a trend day.

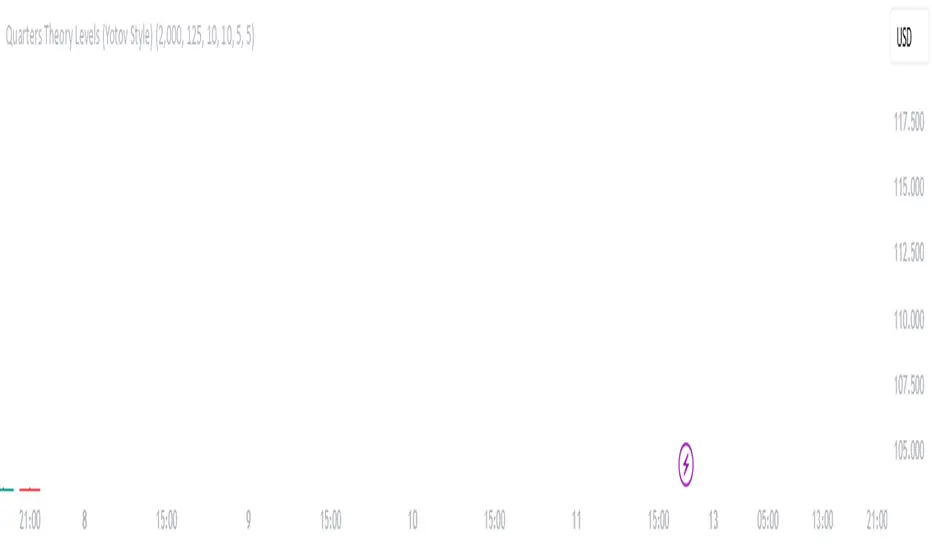
Quarters Theory Levels (Yotov Style)John Alex Sagwe's Quarters Theory Levels Script
This Pine Script, developed by John Alex Sagwe, is based on the concept of the "Quarters Theory" popularized by Illan Yotov. It aims to help traders identify key levels in the market using whole, half, and quarter-level calculations. The script plots major whole levels, half levels, and quarter levels above and below the current price, allowing traders to visualize potential price points where significant market action might occur.
The customizable parameters allow you to:
Set the base level and step size (for quarter levels),
Adjust the number of levels above and below the current price to be displayed,
Toggle between showing whole, half, or quarter levels,
Use price alerts when the market price nears these levels.
Whether you’re a novice or an experienced trader, this script can help you integrate the Quarters Theory into your trading strategy. It’s designed to be flexible and user-friendly, helping you visualize key market levels with ease.
Developed by: John Alex Sagwe, an avid trader and Pine Script enthusiast.
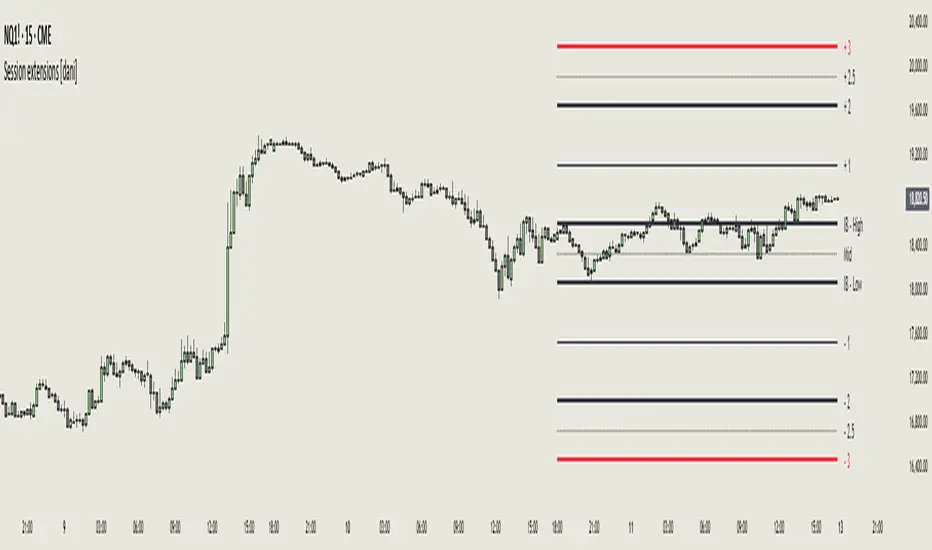
Session extensions [dani]Session Extension
Indicator Description
The Session Extensions indicator is a customizable tool designed to visually represent key price levels during a specified trading session. It calculates and displays the high, low, and midpoints of the session, along with extension levels based on user-defined multipliers. These extensions help traders identify potential support and resistance zones beyond the initial session range.
This indicator is particularly useful for intraday traders who rely on session-based analysis to make informed decisions. It overlays directly on the chart, ensuring seamless integration with price action.
Key Features
Session-Based Analysis : Tracks and highlights key price levels (high, low, midpoint) during a specific trading session.
Customizable Extension Levels : Allows users to define up to six extension levels (both above and below the session range) with unique multipliers, colors, styles, and widths.
Real-Time Updates : Automatically updates during the active session and resets at the start of a new session.
Usage Guidelines
Add the Indicator to Your Chart : Apply the Session Extensions indicator to your chart to visualize key session-based levels.
Intraday Focus : This indicator is optimized for intraday trading. Ensure that the chart's timeframe is set to an intraday interval (e.g., 1-minute, 5-minute).
Session Alignment : Verify that the session time aligns with your trading schedule and timezone. Misalignment may result in incorrect session detection. (This indicator use America - New York timezone)
Avoid Overcrowding : While the indicator supports multiple extension levels, enabling too many levels simultaneously may clutter the chart. Use discretion when configuring extension levels.
Customize Line Styles and Colors : Tailor the appearance of lines and labels to align with your trading style. Use solid, dashed, or dotted lines, and choose colors that enhance visibility without cluttering the chart.
Combine with Other Tools : Pair this indicator with other technical analysis tools (e.g., moving averages, volume profiles) to enhance decision-making.
Disclaimer & Chat
The Session Extensions indicator is intended for educational and analytical purposes only. It does not provide financial advice or guarantee trading success. Users are responsible for verifying the accuracy of session times and ensuring proper configuration before using the indicator in live trading. This indicator is not a trading signal generator.
Thank you for choosing this indicator! I hope it becomes a valuable part of your trading toolkit. Remember, trading is a journey, and having the right tools can make all the difference. Whether you're a seasoned trader or just starting out, this indicator is designed to help you stay organized and focused on what matters most—price action. Happy trading, and may your charts be ever in your favor! 😊
From, Dani.
6 EMA CryptoThis script plots six customizable Exponential Moving Averages (EMA) with default lengths of 9, 12, 21, 50, 100, and 200 periods.
It is designed for traders who want to track both short-term momentum and long-term trends on any asset, including crypto, forex, and stocks.
Each EMA can be individually enabled or disabled and customized with different colors.
Ideal for identifying trend strength, pullbacks, and potential reversals across multiple timeframes.

Liquidity Sweep & Reversal ZonesLiquidity Sweep & Reversal Zones by Maaz
This indicator detects high-probability liquidity sweep and reversal setups based on institutional smart money behavior. It identifies areas where price wicks above/below equal highs or lows to hunt stop orders, then closes back in range to signal a potential reversal.
Core Features:
✅ Detection of equal highs and lows
✅ Confirmed stop hunts using wick break + reversal close
✅ Visual labeling of “Sweep High” / “Sweep Low” events
✅ Optional FVG (Fair Value Gap) confirmation
✅ Sweep zones drawn as smart money trap boxes
This tool is perfect for traders using:
Smart Money Concepts (SMC)
ICT-inspired entry models
Reversal setups after liquidity grabs
Price Action + Order Block strategies
Ideal for confluence with:
Order Blocks
FVGs / Imbalance
Session highs/lows
Volume spikes
For freelance algorithmic trading, custom indicators, or custom trading and investment tools development, contact Maaz at maazshulli@gmail.com. Specializing in Python, PineScript and trading systems development.

Advanced SMC Toolkit by MaazAdvanced SMC Toolkit by Maaz
The Advanced Smart Money Concepts (SMC) Toolkit is a comprehensive trading indicator designed to visualize key price action elements used by institutional traders. This powerful tool helps retail traders identify important market structures and potential reversal zones with precision.
Key Features:
Break of Structure (BOS) - Clearly identifies when price breaks previous swing points, signaling potential trend changes
Order Blocks - Highlights institutional entry areas that often become support and resistance
Fair Value Gaps (FVG) - Detects imbalances in price action where markets move too quickly, leaving unfilled gaps
Premium/Discount Zones - Divides the chart into value areas to identify when price is trading at premium or discount levels
Liquidity Levels - Shows both internal and external liquidity zones where stop orders accumulate
Customizable Settings - Adjust swing sensitivity, minimum FVG size, and toggle various display elements to suit your trading style
This indicator combines multiple SMC concepts into one powerful overlay, helping you visualize institutional order flow and make more informed trading decisions. Perfect for traders focused on price action, market structure, and institutional trading concepts.
Contact for Custom Development
For freelance algorithmic trading, custom indicators, or custom trading and investment tools development, contact Maaz at maazshulli@gmail.com. Specializing in Python, PineScript and trading systems development.

Consecutive Small CandlesThis script identifies relatively "small" candles based on their being smaller than a maximum size you set based on the instrument and your own criteria. Default is 5, as I use this indicator largely on CL which rarely has candles smaller than 3 ticks but frequently greater than 5.
It identifies 2 or more consecutive candles to help identify patterns similar to Bob Volman's Double Doji Break methodolgy. Written by Grok 3.

Moving Averages & RSIThis TradingView Pine Script plots multiple moving averages (EMAs, SMAs) and multi-timeframe RSI values for trend analysis.
It includes a regime filter based on sector and index trends (e.g., SPX, XLF, XLK) to highlight market conditions.
Bullish and bearish RSI divergences are detected and visually flagged on the chart.
Several UI tables display RSI values, sector info, market trend status, and share float, with optional watermark labeling.

Candlestick Pattern Indicator – Doji, Harami, More [algo_aakash]This Candlestick Pattern Indicator is designed to help traders identify key price action patterns like Bullish Engulfing, Bearish Engulfing, Doji, Hammer, Morning Star, Evening Star, and many more directly on your TradingView chart. With customizable options to display both bullish and bearish patterns , this indicator provides real-time visual markers and labels, helping you make informed trading decisions.
Key features of the indicator include:
Detects popular candlestick patterns such as Bullish Engulfing, Bearish Engulfing, Hammer, Morning Star, Tweezer Tops, and more.
Customizable settings for displaying pattern shapes, labels, and opacity, tailored to your trading preferences.
Option to plot signals only after a candle closes, ensuring accuracy.
Alerts for immediate notification of detected patterns.
Visual markers on the chart, including arrows and labels, for quick recognition of potential trade setups.
This indicator is ideal for traders who rely on candlestick patterns for technical analysis and want an automated tool to highlight these setups for easier decision-making.
Whether you're a beginner or an experienced trader, this tool will help you spot important patterns in real-time without cluttering your chart.

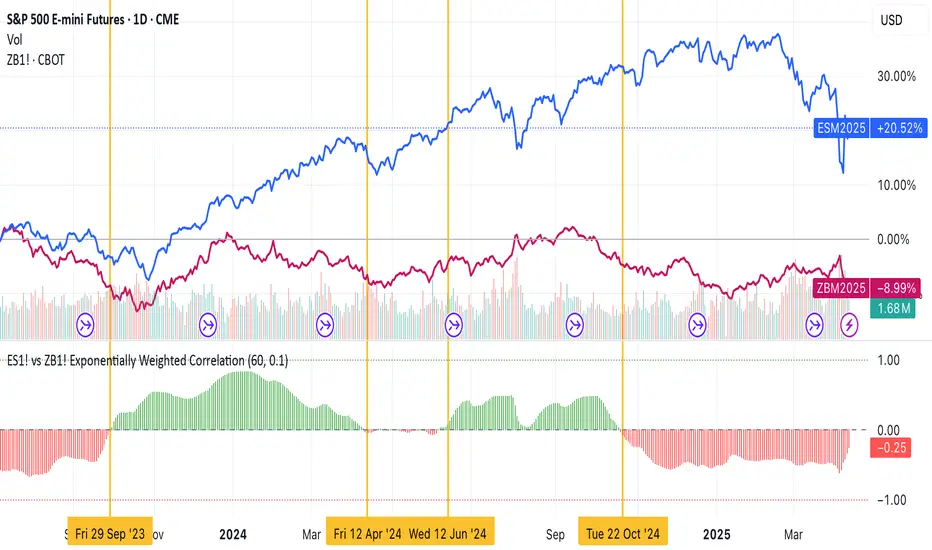
ES1! vs ZB1! Exponentially Weighted CorrelationES1! vs ZB1! Exponentially Weighted Correlation
This indicator calculates and visualizes the exponentially weighted correlation between the S&P 500 E-mini futures (ES1!) and the 30-Year U.S. Treasury Bond futures (ZB1!) over a user-defined lookback period. By using an exponential moving average (EMA) approach, it emphasizes recent price movements, providing a dynamic view of the relationship between these two key financial instruments.
Features:
- Customizable Inputs: Adjust the lookback length (default: 60) and alpha (default: 0.1) to fine-tune the sensitivity of the correlation calculation.
- Exponentially Weighted Correlation: Measures the strength and direction of the relationship between ES1! and ZB1! prices, with more weight given to recent data.
- Visual Clarity: Displays correlation as colored bars (green for positive, red for negative) for quick interpretation, with reference lines at 0, +1, and -1 for context.
- Non-Overlay Design: Plotted in a separate panel below the chart to avoid cluttering price data.
How It Works:
The indicator fetches closing prices for ES1! and ZB1!, applies an EMA to smooth the data, and computes the exponentially weighted covariance and variances. The correlation is then derived and plotted as a histogram, helping traders identify whether the two markets are moving together (positive correlation), in opposite directions (negative correlation), or independently.
Use Cases:
- Market Analysis: Gauge the relationship between equity and bond markets to inform trading strategies.
- Risk Management: Monitor correlation shifts to adjust portfolio exposure.
- Intermarket Insights: Identify trends or divergences in the stock-bond dynamic for macroeconomic analysis.
Ideal for traders and analysts tracking intermarket relationships, this indicator offers a clear, responsive tool for understanding ES1! and ZB1! correlation in real-time.
Candle Trend PowerThe Candle Trend Power is a custom technical indicator designed for advanced trend analysis and entry signal generation. It combines multiple smoothing methods, candle transformations, and volatility bands to visually and analytically enhance your trading decisions.
🔧 Main Features:
📉 Custom Candle Types
It transforms standard OHLC candles into one of several advanced types:
Normal Candles, Heikin-Ashi, Linear Regression, Rational Quadratic (via kernel filtering), McGinley Dynamic Candles
These transformations help traders better see trend continuations and reversals by smoothing out market noise.
🧮 Smoothing Method for Candle Data
Each OHLC value can be optionally smoothed using:
EMA, SMA, SMMA (RMA), WMA, VWMA, HMA, Mode (Statistical mode) Or no smoothing at all.
This flexibility is useful for customizing to different market conditions.
📊 Volatility Bands
Volatility-based upper and lower bands are calculated using:
Band = price ± (price% + ATR * multiplier)
They help identify overbought/oversold zones and potential reversal points.
📍 Candle Color Logic
Each candle is colored:
Cyan (#00ffff) if it's bullish and stronger than the previous candle
Red (#fd0000) if it's bearish and weaker
Alternating bar index coloring improves visual clarity.
📈 Trend Momentum Labels
The script includes a trend strength estimation using a smoothed RSI:
If the candle is bullish, it shows a BUY label with the overbought offset.
If bearish, it shows a SELL label with the oversold offset.
These labels are dynamic and placed next to the bar.
📍 Signal Markers
It also plots triangles when the price crosses the volatility bands:
Triangle up for potential long
Triangle down for potential short
✅ Use Case Summary
This script is mainly used for:
Visual trend confirmation with enhanced candles
Volatility-based entry signals
RSI-based trend momentum suggestions
Integrating different smoothing & transformation methods to fine-tune your strategy
It’s a flexible tool for both manual traders and automated system developers who want clear, adaptive signals across different market conditions.
💡 What's Different
🔄 Candle Type Transformations
⚙️ Custom Candle Smoothing
📉 Candle's Multi-level Volatility Bands
🔺 Dynamic Entry Signals (Buy/Sell Labels)
❗Important Note:
This script is provided for educational purposes and does not constitute financial advice. Traders and investors should conduct their research and analysis before making any trading decisions.

Candle vs 8 SMA - Red & Green📈 Script Name: Candle vs 8 SMA – Red & Green
This TradingView Pine Script visually compares each candle's close price to the 8-period Simple Moving Average (SMA) and highlights the chart accordingly:
🔍 What It Does:
Calculates the 8-period SMA
sma8 = ta.sma(close, 8)
This line computes the average of the last 8 closing prices to smooth out short-term fluctuations.
Plots the SMA Line
Orange line shown on the chart.
Helps you visually track the short-term trend.
Identifies Candle Position
candleAbove: true if the candle’s close is above the SMA
candleBelow: true if the candle’s close is below the SMA
Highlights Background
If the close is above the 8 SMA → Green background (indicating bullish behavior)
If the close is below the 8 SMA → Red background (indicating bearish behavior)
Plots Triangle Shapes
Green triangle below candle when above the SMA
Red triangle above candle when below the SMA
Helps quickly identify conditions at a glance
🧠 Why Use It?
This script is useful for:
Intraday trend confirmation
Spotting momentum shifts
Visual clarity on how price reacts to a dynamic support/resistance (SMA)
Aiding quick decisions for scalping or intraday trades