🔥 PratikMoneyCPTY – AI Crypto Swing SignalCreated by Pratik Patel, this advanced crypto trading tool fuses AI logic with technical indicators—EMA, SuperTrend, MACD, RSI, and candlestick patterns—to identify profitable swing entries. Built for crypto markets like BTC, ETH, and top altcoins on 4H/1D charts. Includes smart alerts, BUY/SELL tags, and popup notifications for actionable insights.
Трендовый анализ

ICT Turtle Soup (Liquidity Reversal)ICT Turtle Soup — Liquidity Reversal Detection
Classic Liquidity Trap Reversal Strategy for Smart Money Traders
This indicator implements the ICT Turtle Soup concept — a classic liquidity-based reversal pattern — which occurs when price runs above or below a recent swing level to grab liquidity, then sharply reverses. This pattern is commonly used in Smart Money Concepts (SMC) and Inner Circle Trader (ICT) strategies to anticipate false breakouts and high-probability reversals.
🔍 What This Script Does:
Identifies Swing Highs & Lows
Detects recent swing highs and lows using a customizable lookback period.
Tracks Liquidity Grabs
A bearish Turtle Soup setup is triggered when price breaks above a recent swing high but closes back below it.
A bullish Turtle Soup setup is triggered when price breaks below a recent swing low but closes back above it.
These conditions often signal liquidity traps, where price sweeps resting orders before reversing.
Plots Signals Directly on the Chart
Turtle Soup setups are marked with 🐢🔻 (bearish) and 🐢🔺 (bullish) labels.
Optional full-text labels can also be displayed for clarity and journaling.
Includes Alert Conditions
Alerts can be enabled to notify you of bullish or bearish Turtle Soup reversals in real-time.
⚙️ Customization Features:
Adjustable swing lookback period
Enable/disable Turtle Soup labels
Set label font size
Choose your preferred bullish/bearish signal colors
💡 How to Use:
Add this script to your chart (ideally on intraday timeframes such as 5m–15m).
Wait for a Turtle Soup signal near a key swing high/low or liquidity zone.
Combine with other confirmation tools (e.g., FVGs, Order Blocks, OTE) for stronger setups.
Use alerts to stay ahead of fast-moving reversals.
🧠 Why It Works:
Turtle Soup setups are rooted in liquidity theory — they exploit the market’s tendency to sweep obvious swing levels before reversing. These moves often trap retail traders and mark the beginning of Smart Money entries.
🔗 Best Used With:
Maximize the edge by combining this with other SMC tools:
✅ First FVG — Opening Range Fair Value Gap Detector
✅ ICT SMC Liquidity Grabs + OB + Fibonacci OTE Levels
✅ Liquidity Levels — Smart Swing Lows
Together, they create a complete ecosystem for identifying, confirming, and executing liquidity-driven trade setups with precision.

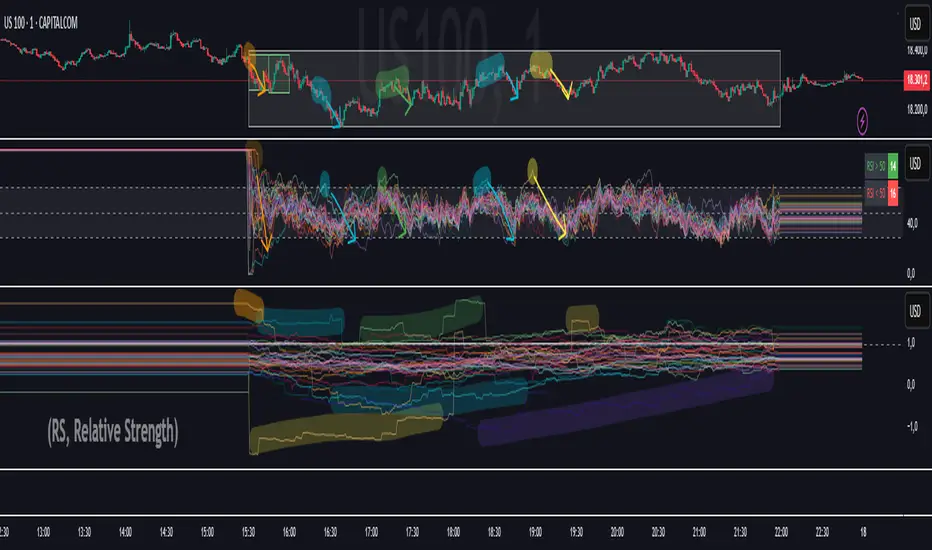
30 custom RSThis is an indicator that calculates and plots the Relative Strength (RS) between the price of a given stock and 30 others tikers of your choice. It is fully customizable depending on the market you prefer to follow. Personally, I’ve set it up with the top 30 Nasdaq tickers and used the NASDAQ itself as the benchmark title.
This script is extremely useful for understanding how many companies have a positive correlation and how many have a negative one. If many companies show a negative correlation, it could indicate the beginning (not yet evident) of a bear phase. On the other hand, if many companies show a positive correlation, it could indicate the beginning (not yet evident) of a bull phase.
Regardless of whether the correlation is positive or negative, the lower the correlation, the more likely it is that the given symbol won't produce fake signals on indicators like the RSI or CCI.
So essentially, this indicator shows a composite RS
This indicator is designed to be used in combination with other similar tools I've published, which track the RSI,CCI, ATR, MACD, etc., of the top 30 NASDAQ companies
In particular, I recommend using this script if you plan to use any other indicators from the 'Composite 30' series, as it is the one that most validates any signals received from the composite charts. This is because it allows you to determine the level of correlation between the BENCHMARK and the others that make up the composite.
Volumen Extremo + SRThis indicator detects high-impact trading moments by combining:
Volume spikes (3x or 5x above average)
Strong candle bodies
Dynamic support/resistance zones (based on recent highs/lows)
It highlights key turning points in the market—whether due to whale take-profits, institutional exits, or breakout confirmations.
🔺 Green/Red Arrows:
Appear when volume is 3× the average and the candle has a significant body
→ Confirms strong market conviction (buy/sell)
🌟 Fuchsia Star:
Appears when volume exceeds 5× average with a large-bodied candle
→ Signals extreme moves, whale actions or liquidation spikes
🟩 Support Line (green):
Dynamic recent lowest price (lookback configurable)
→ Identifies zones where buyers previously stepped in
→ Identifies zones where buyers previously stepped in
🟥 Resistance Line (red):
Dynamic recent highest price (lookback configurable)
→ Shows zones where sellers previously dominated
Alerts Included:
Bullish breakout with volume
Bearish rejection with volume
Volume explosion alerts for extreme moves
Don't guide yourself by man uptrend if it doesn't have exceptional volume.
By Teo Mariscal


Trend-Following Strategy with Keltner ChannelsTrend Filter ( All Timeframes):
Price must be above the 200 EMA for a bullish setup
Price must be below the 200 EMA for a bearish setup
Keltner Channels for dynamic support/resistance
Buy when price pulls back to the midline or lower channel in an uptrend
Sell when price pulls back to the midline or upper channel in a downtrend
Entry trigger: Price pulls back to Keltner midline then crosses it
Exits: ATR-based SL & TP with optional trailing stops

🎨 Volume Tuy Chinh - Super High Red//@version=5
indicator("🎨 Volume Tuy Chinh - Super High Red", overlay=false)
avgLength = input.int(20, "So nen tinh volume trung binh")
threshold = input.float(2.0, "Nguong volume sieu cao (x lan)")
avgVol = ta.sma(volume, avgLength)
isSuperHigh = volume > avgVol * threshold
plot(volume, style=plot.style_columns, color=isSuperHigh ? color.red : color.gray, title="Volume Tuy chinh")

Gold Smart Scanner [EMA/Wick/Volume/RSI/VWAP] +Live Dashboard Smart Scanner indicator for Gold (XAUUSD) to get the best high-probability trade setups using EMA 200, wick exhaustion, volume drop, RSI divergence and VWAP — all shown in one visual dashboard.
🧠 What This Indicator Does
This indicator helps you detect potential tops and bottoms with high probability by combining:
EMA 200 trend direction
Wick exhaustion logic (long upper/lower wicks)
Volume drop detection
RSI divergence
VWAP confirmation
These are the building blocks of professional price action + smart money trading strategies.
📊 How to Use It – Step by Step
1. Determine Market Bias (Trend Filter)
Check the Dashboard > EMA 200 Trend
💚 "Bullish": Only look for buy setups
❤️ "Bearish": Only look for sell setups
Confirm price is above or below the bright yellow EMA 200 line on the chart.
2. Look for Exhaustion Signals
Watch for red or green "Exh" arrows above/below candles:
🔴 Red Exh arrow = possible top (sell exhaustion)
🟢 Green Exh arrow = possible bottom (buy exhaustion)
These show when wicks are long and volume drops, with RSI divergence.
3. Confirm With the Dashboard (Top Right Corner)
This tells you everything at a glance:
Field - What It Means - What to Do
EMA 200 Trend - Market direction - Trade in this direction
Wick Signal - Long wick detected - Reversal zone clue
Volume Drop - Low volume = less momentum - Signals exhaustion
RSI Divergence - Bullish/Bearish divergence - Confirms hidden strength/weakness
VWAP Position - Where price is vs VWAP - Use as dynamic S/R filter
Use this to wait for all pieces to align for a high-probability setup
Timeframes
Designed for 1H and 15M (or you can use 4H for confirmation)
Works great on Gold (XAUUSD) but you can use on any asset
🛑 Don’t Forget:
This is not a "buy/sell now" tool, it’s a scanner to help you build confidence in trade setups.
Combine it with your own entry/exit strategy (e.g., break of a structure, order blocks, stop-loss below wick).
Like this indicator? Boost it ❤️


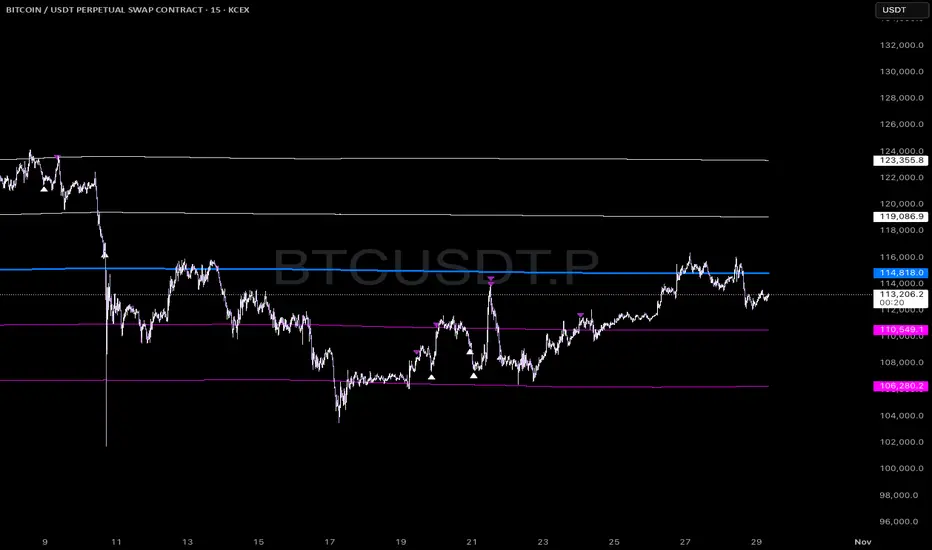
Auto Step Horizontal LinesAuto Step Horizontal lines by custom range
Create automatic horizontal lines by specifying the price range for each line, with each line serving as an observation point for support and resistance levels.

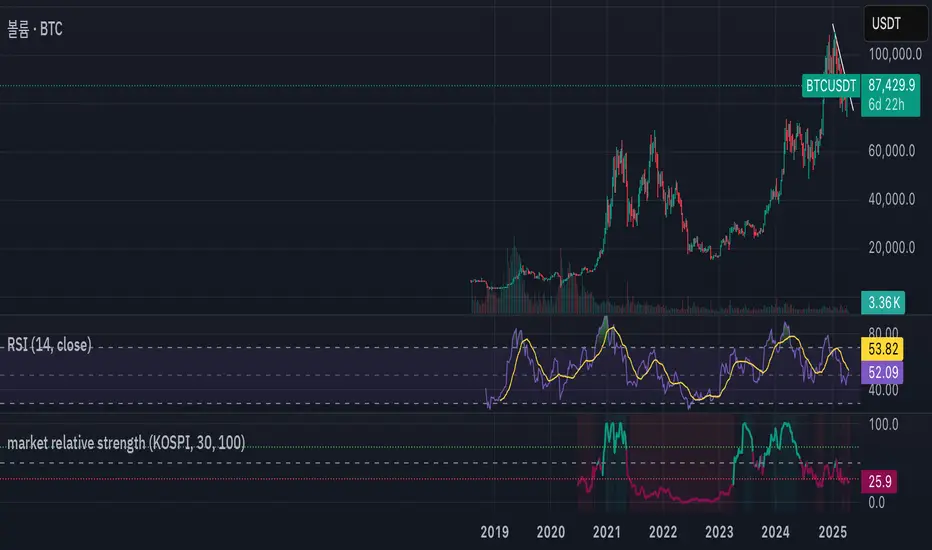
market relative strengthOverview
market relative strength is a custom indicator that visualizes how strong or weak a given asset is compared to a selected market benchmark — such as KOSPI, NASDAQ100, BTC dominance, or total crypto market cap.
How It Works
The indicator calculates the relative return between the current asset and the selected benchmark over a user-defined period. It then normalizes the difference into a 0–100 score:
Above 50 = outperforming the market
Below 50 = underperforming the market
Above 70 / Below 30 = strong divergence from market trend
Use Case
This is ideal for identifying assets with strong relative performance, detecting trend leaders or laggards, and rotating positions between sectors or assets based on strength.
Customization
Choose from a list of market indexes or crypto metrics
Set the comparison period and normalization range
Visual cues with background shading for strong/weak zones
Note
This is not the same as RSI. This indicator is based on relative performance to a benchmark, not price momentum.
Multi-Timeframe EMA Signal - StyledTrend reminder, what is based on the 39 MA. Looking after 14 CLOSED candles. The minute TF is calculated from the 1m chart, the 1H, 4h, 1D is calculated from the 1h TF.
If you go higher on the minute TF you see that the calculation goes bad, so you dont see the minute TF-s trend if you are on the 5m or on the 15M or higher TF. It's ok for my needs i usualy trade on the 1m chart so i see everything.
It's simple.
I was looking for a srcipt like this, and did not find anything.
It's not my work, its Veronika's script from chatGPT based on my needs. :)

20 & 50 EMA + ATR, TR & DATRIndicator Name: 20 & 50 EMA + ATR, TR & DATR
This custom indicator combines trend and volatility analysis into a single tool, helping you make smarter trading decisions with fewer indicators on your chart.
---
1. 20 & 50 Exponential Moving Averages (EMAs)
EMA 20 (Blue Line): A short-term trend indicator that reacts quickly to price changes.
EMA 50 (Orange Line): A medium-term trend indicator that smooths out more of the noise.
How to Use:
Bullish signal: EMA 20 crosses above EMA 50
Bearish signal: EMA 20 crosses below EMA 50
Use crossovers or distance between EMAs to confirm trends or potential reversals
---
2. True Range (TR)
Definition: The greatest of the following:
High - Low
High - Previous Close
Previous Close - Low
Use: Shows how much the asset moved during the candle. Useful for understanding raw price movement.
---
3. Average True Range (ATR)
Definition: The average of the True Range over a 14-bar period
Line color: Red (shown in the status line above your chart)
How to Use:
High ATR = High volatility
Low ATR = Low volatility
Use ATR to help determine stop-loss and take-profit levels, or to avoid low-volatility periods
---
4. Daily ATR (DATR)
Definition: ATR calculated from the daily timeframe, regardless of the chart's current timeframe
Line color: Green (also shown in the status line)
How to Use:
Know how much the asset typically moves in a full day
Helps intraday traders set realistic targets or detect when the market is unusually quiet or active

compare strength
---
Compare Strength – Multi-Timeframe Relative Strength Indicator
**Author:** @martin_alpha
**License:** Mozilla Public License 2.0
**Script version:** Pine Script™ v6
What does this indicator do?
This indicator is designed to **compare the relative strength of any asset against a chosen benchmark**. It provides traders and analysts with a clear visual representation of how one asset is performing compared to another over different time horizons.
Key Features:
- **Benchmark Comparison**: Compares the current asset’s price action against a user-defined symbol (default: `BTCUSDT` from Binance).
- **Relative Strength Ratio**: Calculates a scaled ratio of the asset’s price relative to the benchmark.
- **Multi-EMA Smoothing**: Applies three Exponential Moving Averages (EMAs) with user-defined lengths to smooth the strength ratio and highlight trends.
- **Customizable Inputs**: Allows traders to input their own benchmark symbol and EMA lengths for full flexibility.
How it works:
1. **Relative Ratio Calculation**:
```
ratio = (close / benchmark close) * 1000
```
This gives a scaled value showing how strong the current asset is relative to the benchmark.
2. **EMAs of the Ratio**:
- `ratio_ma1`: Fast smoothing (default length 10)
- `ratio_ma2`: Medium smoothing (default length 20)
- `ratio_ma3`: Long-term smoothing (default length 100)
3. **Plotting**:
- The raw ratio is plotted as a dynamic line.
- The smoothed ratios are plotted in **Red**, **Green**, and **Blue**, respectively.
How to Use:
- Choose any benchmark to compare strength — for example, `BINANCE:ETHUSDT` or a sector ETF like `SPY` if using on stocks.
- Observe **crossovers** between the ratio and its moving averages:
- When the ratio is above the moving averages, it indicates **relative outperformance**.
- When it is below, it may indicate **relative weakness**.
- Great for **pair trading**, **sector rotation**, or identifying **leading assets** in a trend.
Inputs:
- `length` (default 10): EMA length for short-term strength smoothing.
- `length2` (default 20): EMA length for medium-term strength.
- `length3` (default 100): EMA length for long-term trend view.
- `s01`: Symbol to use as a benchmark (default: `BINANCE:BTCUSDT`).
Notes:
- The benchmark is normalized by dividing by 100 to improve visual scaling.
- The final ratio is scaled by 1000 for better chart readability — this has no impact on actual strength interpretation.
- Best used on **higher timeframes** for macro trend comparison or on **shorter timeframes** for intra-day relative strength setups.
---

XAUUSD IST SessionsThe script is designed to highlight specific time zones on your chart based on Indian Standard Time (IST):
✅ Morning session: 5:30 AM to 7:30 AM IST
✅ Evening session: 7:00 PM to 9:00 PM IST
Since TradingView scripts work on UTC (Coordinated Universal Time), we convert IST to UTC first.
📦 Breakdown of the Code:
🟦 indicator("XAUUSD IST Sessions", overlay=true)
This line tells TradingView to create a custom indicator and draw it on the price chart (overlay=true).


EMA Crossover Strategy with Trailing Stop and AlertsPowerful EMA Crossover Strategy with Dynamic Trailing Stop and Real-Time Alerts
This strategy combines the simplicity and effectiveness of EMA crossovers with a dynamic trailing stop-loss mechanism for robust risk management.
**Key Features:**
* **EMA Crossover Signals:** Identifies potential trend changes using customizable short and long period Exponential Moving Averages.
* **Trailing Stop-Loss:** Automatically adjusts the stop-loss level as the price moves favorably, helping to protect profits and limit downside risk. The trailing stop percentage is fully adjustable.
* **Visual Buy/Sell Signals:** Clear buy (green upward label) and sell (red downward label) signals are plotted directly on the price chart.
* **Customizable Inputs:** Easily adjust the lengths of the short and long EMAs, as well as the trailing stop percentage, to optimize the strategy for different assets and timeframes.
* **Real-Time Alerts:** Receive instant alerts for buy and sell signals, ensuring you don't miss potential trading opportunities.
**How to Use:**
1. Add the strategy to your TradingView chart.
2. Customize the "Short EMA Length," "Long EMA Length," and "Trailing Stop Percentage" in the strategy's settings.
3. Enable alerts in TradingView to receive notifications when buy or sell signals are generated.
This strategy is intended to provide automated trading signals based on EMA crossovers with built-in risk management. Remember to backtest thoroughly on your chosen instruments and timeframes before using it for live trading.
#EMA
#Crossover
#TrailingStop
#Strategy
#TradingView
#TechnicalAnalysis
#Alerts
#TradingStrategy

SignalCore Widodo Budi v1.0SignalCore Widodo Budi v1.0 is an all-in-one breakout and trend signal suite, designed to help traders detect high-probability trade setups using a fusion of price action, momentum, and volume.
✅ Combines breakout & breakdown detection using:
Donchian Channel (20)
Moving Averages (SMA 20 & 50)
MACD momentum confirmation
Volume spike detection
ADX trend strength
Heikin Ashi trend filter
🧠 Additional tools:
Conditional Stochastic %K/%D
RSI (Overbought/Oversold levels)
ADX visual + DI+/DI- alerts
Auto labels for breakout and pre-breakdown levels
🔔 Built-in alerts:
Breakout & Pre-Breakout
Breakdown & Pre-Breakdown
RSI signals
Stochastic crossovers
ADX directional strength
🎯 Best used on liquid instruments with defined ranges or trending behavior. Suitable for swing traders, momentum traders, and intraday scalpers alike.
Created by: Widodo Budi, 2025
Version: v1.0

VPSRVP Sovereign Reign (VPSR) - Advanced Volume Profile Analysis
A sophisticated volume analysis tool that provides deep insights into market participation and momentum through an intuitive visual interface. This indicator helps traders identify significant market moves, potential reversals, and institutional activity.
Key Features:
1. Smart Volume Analysis
• Dynamic volume profiling
• Institutional participation detection
• Abnormal volume identification
• Real-time momentum tracking
2. Advanced Visual System
• Color-coded volume bars
• Adaptive cloud formation
• Reversal pattern detection
• Fake-out warning system
Visual Components:
1. Volume Bars
• Green: Bullish pressure with normal volume
• Purple: Bearish pressure with normal volume
• White: Significant bullish participation
• Pink: Significant bearish participation
• Orange: High-probability reversal zones
2. Dynamic Cloud
• White Cloud: Bullish control zone
• Purple Cloud: Bearish control zone
• Cloud density indicates participation strength
• Adaptive to market conditions
Signal Interpretation:
1. Normal Market Conditions
• Green/Purple bars show directional pressure
• Cloud color indicates dominant force
• Cloud height shows average participation
2. Significant Events
• White/Pink bars signal major moves
• Orange bars highlight potential reversals
• Cloud expansion shows increasing activity
• Cloud contraction indicates consolidation
Customization Options:
• Volume MA Length: Smoothing factor
• Abnormal Volume Threshold: Sensitivity
• Cloud Display: Toggle visualization
• Color scheme optimization
Best Practices:
1. Multiple Timeframe Analysis
• Start with higher timeframes
• Confirm on lower timeframes
• Watch for confluence
2. Volume Analysis
• Compare to historical levels
• Monitor abnormal spikes
• Track participation trends
3. Trade Management
• Use as confirmation tool
• Wait for clear signals
• Monitor fake-out warnings
• Combine with price action
Trading Applications:
1. Trend Analysis
• Identify strong moves
• Spot weakening trends
• Detect consolidation
2. Reversal Detection
• Spot potential turning points
• Identify fake-outs
• Monitor institutional activity
3. Risk Management
• Volume-based position sizing
• Stop loss placement
• Profit target selection
The VP Sovereign Reign indicator excels at:
• Identifying significant market moves
• Detecting institutional participation
• Warning of potential reversals
• Highlighting fake-outs
• Providing clear market context
Risk Warning:
This indicator is designed as a technical analysis tool and should be used as part of a complete trading strategy. Past performance does not guarantee future results. Always employ proper risk management techniques.
Note: For optimal results, use in conjunction with price action analysis and other complementary indicators.

Head Hunter HHHead Hunter HH - Advanced Market Structure & Volume Analysis Indicator
This indicator combines volume analysis, price action, and VWAP to identify high-probability trading opportunities across multiple timeframes.
Key Features:
• Smart Volume Analysis: Detects institutional volume patterns using dynamic thresholds
• VWAP-Based Market Structure: Multiple standard deviation bands for precision entry/exit
• Daily Level Integration: Previous day's high, low, close, and current day's open
• Advanced Signal Classification: Regular, Super Strong, and Scalp signals
Signal Types:
1. Regular Signals (White/Purple Triangles)
• Volume-confirmed reversals
• Institutional price levels
• Technical momentum alignment
2. Super Strong Signals (Green/Red Diamonds)
• High-volume breakouts
• Strong momentum confirmation
• Multiple timeframe alignment
3. Scalp Signals (Green/Magenta Circles)
• Quick reversal opportunities
• VWAP deviation analysis
• Volume surge confirmation
Visual Components:
• VWAP with Standard Deviation Bands
• 50 MA (optional)
• Daily Reference Levels
• Color-coded signals based on strength
• Bar color changes on confirmed signals
Best Practices:
• Most effective on higher timeframes (1H+)
• Use with major pairs/instruments
• Combine signals with support/resistance
• Monitor volume confirmation
• Wait for candle close confirmation
This indicator helps identify institutional order flow and high-probability reversal zones by analyzing volume patterns, price action, and market structure, providing traders with multiple confirmation layers before entry.
Note: Results may vary based on market conditions and timeframe selection. Always use proper risk management.

Anchored VWAP - RTH + ON + Previous VWAPRegular Trading Hours Anchored VWAP, Overnight Anchored VWAP, Prior Day's VWAP as Price Level

📊 Wyckoff - Spring + UT + Khang cu//@version=5
indicator("📊 Wyckoff - Spring + UT + Khang cu", overlay=true)
// === Tham so nguoi dung ===
lookback = input.int(50, "Tim ho tro/khang cu trong X nen", minval=5)
rangePerc = input.float(0.005, "Nguong gan ho tro/khang cu (%)", step=0.001)
volMultiplier = input.float(1.5, "Nguong Volume cao", step=0.1)
wickRatio = input.float(2.0, "Ty le bong/than", step=0.1)
avgVolLength = input.int(20, "So nen tinh volume trung binh", minval=1)
showLabel = input.bool(true, "Hien thi nhan")
showResLine = input.bool(true, "Hien thi duong khang cu")
// === Tinh toan volume va vung gia ===
avgVol = ta.sma(volume, avgVolLength)
resistance = ta.highest(high, lookback)
support = ta.lowest(low, lookback)
candleBody = math.abs(close - open)
upperWick = high - math.max(open, close)
lowerWick = math.min(open, close) - low
// === Phat hien UpThrust (UT) ===
isNearRes = high >= resistance * (1 - rangePerc)
isUT = upperWick > wickRatio * candleBody and close < open and volume > avgVol * volMultiplier and isNearRes
// === Phat hien Spring ===
isNearSup = low <= support * (1 + rangePerc)
isSpring = lowerWick > wickRatio * candleBody and close > open and volume > avgVol * volMultiplier and isNearSup
// === Hien thi nhan tren bieu do ===
plotshape(isUT and showLabel, title="UT", location=location.abovebar, color=color.red, style=shape.labeldown, text="UT", textcolor=color.white)
plotshape(isSpring and showLabel, title="Spring", location=location.belowbar, color=color.green, style=shape.labelup, text="Spring", textcolor=color.white)
// === To mau nen: do cho UT + Spring, xam cho nen khac ===
barcolor(isUT or isSpring ? color.rgb(255, 0, 0) : color.new(color.gray, 60))
// === Ve duong khang cu ===
var line resLine = na
if (showResLine)
if na(resLine)
resLine := line.new(x1=bar_index, y1=resistance, x2=bar_index + 1, y2=resistance, extend=extend.right, color=color.orange, style=line.style_dashed)
else
line.set_xy1(resLine, bar_index, resistance)
line.set_xy2(resLine, bar_index + 1, resistance)
