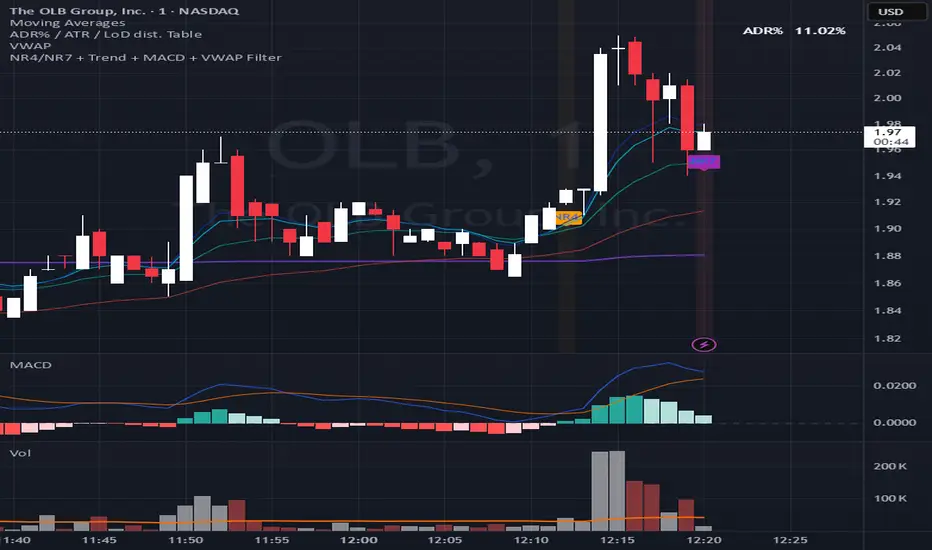
NR4/NR7 + Trend + MACD + VWAP FilterThe Ultimate Momentum-Compression Strategy
This strategy merges the power of price compression and trend confirmation, ensuring you're trading when the market is coiled and ready to move. By combining multiple filters—NR4/NR7, trend alignment, MACD momentum, and VWAP support—this setup identifies high-probability trade opportunities in dynamic, trending stocks. Here's how it works:
NR4/NR7 Patterns: These are narrow-range days where the current price range is smaller than the previous 4 or 7 days. This signals potential breakout or continuation setups, as the market is compressing before making a move.
Trend Confirmation: To ensure you're not trading against the current trend, the price must be above the 20 EMA, and the 10 EMA must be above the 20 EMA. This confirms a bullish structure, with the price trending in your favour.
MACD Momentum: The fast MACD line must be above the slow MACD line, confirming the trend is not only intact but also gaining momentum.
VWAP Filter: Price must be above the VWAP (Volume Weighted Average Price). This is the final confirmation that the market is in a strong, bullish phase, with buyers dominating the market.
By requiring all these conditions to align, this strategy takes the guesswork out of day trading. It ensures you're trading within a well-established trend, with compression patterns and momentum backing your trade. The result? You’re entering positions with confidence and clarity, poised to ride strong, sustained moves.
This strategy is for the trader who values both flexibility and discipline—able to capture dynamic moves while staying aligned with market structure and momentum. It’s a refined, systematic approach that makes decisions clear, without the emotional second-guessing.
Трендовый анализ
Custom Performance TableThis script generates a table designed to provide a concise yet highly customizable overview of the performance of multiple financial instruments, displayed directly on the chart. The table can include up to 40 tickers, each individually configurable, with values updated in real time based on either the current chart timeframe or a specific user-selected timeframe.
NOTE : The update frequency of the table values depends on the refresh rate of the chart's main ticker to which the indicator is applied. To ensure a consistent and reliable data feed, especially when monitoring heterogeneous instruments, it is recommended to apply the indicator to a highly liquid and continuously traded asset, such as BTCUSD.
PERFORMANCE CALCULATION MODES
You can choose from three different performance calculation modes:
1) Change % (Percentage Change)
Displays the percentage change of the current price compared to the previous candle within the selected timeframe.
(Current Price - Previous Price) / Previous Price * 100
This mode provides an immediate and straightforward measure of each instrument's percentage movement, useful for quick visual comparisons of relative strength among assets.
2) Z-Score
The Z-Score measures how much the current price variation deviates from the historical average variation, relative to the standard deviation of those variations.
(Current Variation - Average Variation) / Standard Deviation of Variations
The result indicates how statistically unusual a movement is:
- Values near 0 suggest normal variations.
- Values above ±2 indicate statistically significant deviations.
This is a valuable tool for identifying overbought/oversold conditions or market stress events and is often used in mean reversion strategies.
NOTE : Due to technical constraints, Z-Score can only be calculated when the selected timeframe matches the chart's timeframe exactly.
3) RAROC (Risk-Adjusted Return on Capital)
RAROC expresses an asset's performance in relation to the risk taken, measured through its volatility (standard deviation of price).
Percentage Change / Standard Deviation of Price
It allows for an assessment of return efficiency in relation to volatility.
A high RAROC value indicates a high return relative to the risk, making it a useful tool for comparing assets with different risk profiles. It is especially suitable for portfolio selection and allocation purposes.
TABLE CONFIGURATION
Each ticker can be customized with its own label, colors, and position in the table.
Each row can display the ticker name or a custom label, which, at the user's discretion, can either replace the name or be shown as an informational tooltip.
The table can be placed anywhere on the chart using horizontal and vertical offset parameters. Thanks to offset support, you can, for example, create financial market overview layouts. This can be done by completely “cleaning” the chart from price and indicators using TradingView settings, and then displaying multiple tables simultaneously (see the example chart published here).
Advanced customization options are also available for the table's appearance, including font settings, colors, borders, and more.
CALCULATION TIMEFRAME
The indicator allows the user to force a specific timeframe (Daily, Weekly, Monthly, Yearly) when applied to intraday charts.
However, for Z-Score mode, the selected timeframe must match the chart's timeframe exactly to ensure correct computation. Otherwise, the script will halt until settings are properly adjusted.
USAGE NOTES
Custom Performance Table is a flexible and adaptable tool, suitable for both intraday operations and medium- to long-term analysis. It is designed for traders and analysts who need to compare assets based on quantitative metrics, whether simple (like percentage change) or more advanced and risk-adjusted (such as Z-Score and RAROC).

Swing Trade EMA StrategyJust a good old EMA5 cross up/down EMA15 system ; great with EMA200 Trend Filter. Simple as that.

Session-Based +/-% LinesSimple Script Just to Draw Lines Above 0.09 and Below 0.09 % based on Close Price

BetterVolumeAvgEste Script esta destinado a mostrar las barras de volume and un promedio de venta y compra de precio en cada vela. Basicamente este tambien contiene una media para poder ver la compra o venta usando este script. Los creditos son para el Programador @sonnyparlin solo que es una version en los traders de habla hispana
This script is intended to display volume bars and an average of the buy and sell price for each candle. It also basically contains an average so you can see the buy or sell using this script. Credit goes to programmer @sonnyparlin (Thank you Sir), but this is a version for Spanish-speaking traders.
.

12 Hour Heikin AshiThis is a Pine Script (version 6) indicator that creates 12-hour Heikin Ashi candles. Heikin Ashi candles smooth out price data to help identify trends by using modified formulas for open, high, low, and close prices. We’ll use a higher timeframe aggregation approach to calculate the Heikin Ashi values based on 12-hour periods.

Prev Day High/Low + First 5-Min Candle RangeThis will draw a a line for previous day high and low and will also draw out the high and the low of the first five minute candle of the daytime session.

CATS Freak Volume MA % Bands with ShiftThis is a riff on Freak Volume by UniqueCharts. You should probably start there to understand what is happening here. Basically you look for a high volume "freak" volume bar using a set lookback period and a certain standard deviation thresehold. Pretty cool. You can then highlight that bar and show it's range… What has been added here is allowing multiples of the range of that freak bar to be shown. (Sometimes when volume comes into the market there will be a measured move of 2x or 3x of the volume bar.) Also have turned the midpoints of the freak volume bars into a moving average of sorts by connecting those levels with various MA choices and a smothing factor. This MA by itself is very interesting since it can plateau and flatten like a kaufmann ma. Also added the abilty for there to be an envelope around this volume MA. The envelope choices can be a fixed percentage, or a multiple of the freak bar (the before mentioned 2x or other multiples), or a volatility based envelope which you may find interesting. The volatility envelope works in a unique way but you can choose smoothing, steps, % capture, etc. Also added an atr stop loss and the indicator is multi timeframe. There is a lot to play with here...

NR4/NR7 + Trend + Refined MACD + VWAP FilterRefined Trend-Following Strategy with NR4/NR7, MACD, and VWAP Filters
This trading strategy combines multiple technical filters to identify high-probability momentum setups, using a refined approach to the MACD for added precision. It’s designed for active traders looking to capitalise on strong trends while avoiding false signals.
Key Features:
Narrow Range Days (NR4/NR7): The strategy first looks for stocks with a narrow range, either NR4 (lowest range of the last four days) or NR7 (lowest range of the last seven days). This identifies stocks that have consolidated and may be preparing for a breakout or strong move.
Trend Analysis with EMAs: Price must be above the 20-period EMA, confirming a bullish trend. Additionally, the 10-period EMA must be above the 20-period EMA, ensuring that the short-term trend is aligned with the longer-term trend, adding to the setup’s strength.
Refined MACD Filter:
If the fast MACD line (12-period) is above the slow MACD line (26-period), the strategy accepts any difference, allowing for a full range of momentum opportunities.
If the fast MACD line is below the slow MACD line, the difference must be no more than 5%. This allows the strategy to capture tight price action setups without excluding potential trends due to a small discrepancy.
VWAP Confirmation: The strategy requires the price to be above the Volume Weighted Average Price (VWAP), adding a layer of volume-based confirmation to ensure that the stock is in a strong, positive trend relative to its average price.
Why This Works: This system is designed to take advantage of stocks that show consolidation (NR4/NR7) and then provide a clear, systematic approach for confirming their breakout potential through trend-following indicators like EMAs, MACD, and VWAP. The nuanced MACD filter adds a layer of flexibility, ensuring that no potential trend is overlooked while preventing false signals due to slight technical discrepancies.
By combining multiple layers of trend confirmation and dynamic filters for volatility, momentum, and volume, the strategy offers a refined approach to capturing high-probability setups, helping traders avoid overfitting to noise and focus on the most promising opportunities.

NR4/NR7 + Refined Trend FilterThis version allows the candle to pull toward the 10 EMA without disqualifying the trend—but keeps things on a bullish leash.

NR4/NR7 + 10 EMA Trend Filter📝 Description:
This script spots NR4 and NR7 days—those deceptively quiet candles where price volatility contracts... right before a potential breakout.
But here’s the twist:
It only highlights setups when the stock is above the 10 EMA, filtering for bullish trends with real momentum behind them.
We’re not interested in weak sauce. We want spring-loaded coils in strong uptrends.
🧠 What It Does:
🔍 NR4 (Narrow Range 4): Today's range is the smallest of the last 4 days
🧨 NR7 (Narrow Range 7): Today's range is the smallest of the last 7 days
🧭 Trend Filter: Highlights only when price is above the 10-period EMA
🎯 Visual Cues: Orange background and label for NR4, purple for NR7

Basic/Fractal Engulfing Candle Filtered EMA/ATRBasic/Fractal Engulfing Candle Filtered EMA/ATR
This clean and flexible indicator is designed to highlight high-probability engulfing candle patterns by applying a smart combination of filters based on ATR, EMA, and fractal swing high/low logic.
Engulfing candles are commonly used for spotting potential trend reversals or momentum continuation zones—but without proper filtering, they can produce noise. This script enhances reliability by giving traders control over:
ATR Filter: Limits signals to candles within a specific size range relative to the Average True Range, filtering out excessive volatility.
EMA Filter: Confirms trend direction using an exponential moving average. Engulfing candles are only valid if aligned with or against the EMA depending on user configuration.
Fractal Swing High/Low Filter: Requires engulfing candles to occur near local highs (for bearish setups) or lows (for bullish setups), identifying potential turning points in market structure.
Highlights:
Fully customizable with intuitive inputs
Clean chart visuals with triangle markers for bullish (🟦 aqua) and bearish (🟪 fuchsia) engulfing signals
Adaptive EMA color changes based on price position (above = bullish, below = bearish)
Perfect for traders who want a smarter engulfing candle tool that adapts to market conditions, price structure, and trend confirmation.
*Highly recommend using this in confluence with many other indicators of my own/your liking.
*You can use this very well on memecoins and alt coins, works for trading, swing trading, and long term analysis. Lower time frames recommended.
*includes alerts functionality.

VWAP - CATSsession vwap with % bands and a highlight of every 4th band... because I think those are interesting levels. If you use with my alternating ma red/green background and set that one also to vwap then these 2 scripts play well together otherwise this will just be the big yellow with grey % bands and every 4th one able to be highlighted....

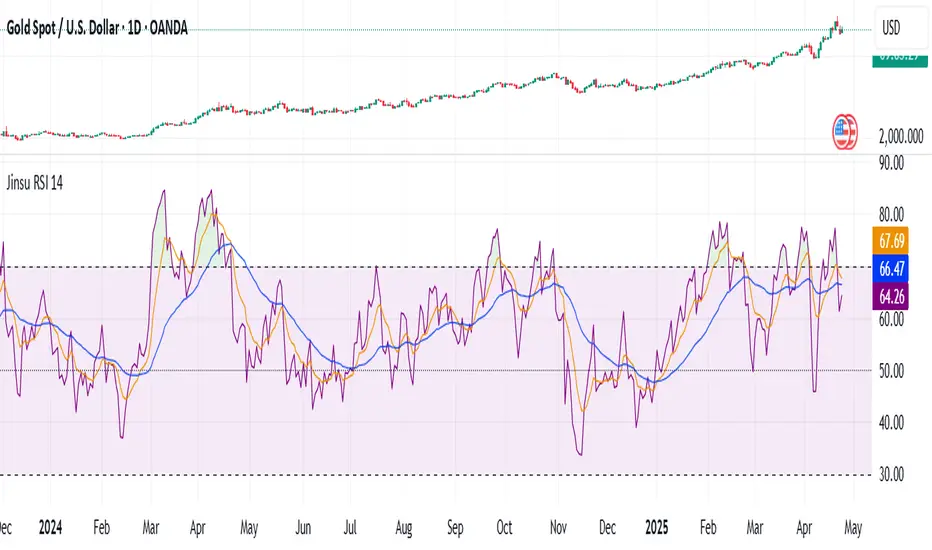
Jinsu RSI 14### 🔍 **Jinsu RSI 14 – EMA 9 & WMA 45**
**Description:**
This custom indicator combines the classic RSI (Relative Strength Index) with two moving averages — EMA (Exponential Moving Average) and WMA (Weighted Moving Average) — applied directly to the RSI value to provide more nuanced momentum signals.
### 📊 **How It Works**
- **RSI 14** measures market momentum and identifies overbought (above 70) or oversold (below 30) conditions.
- **EMA 9 on RSI** responds quickly to short-term changes, signaling momentum shifts.
- **WMA 45 on RSI** captures long-term sentiment, while placing more emphasis on recent data.
### 🧠 **Signal Interpretation**
- **RSI crosses above EMA 9** → Possible bullish momentum shift.
- **RSI falls below EMA 9** → Possible bearish momentum shift.
- **EMA 9 crosses above WMA 45** → Strong bullish momentum.
- **EMA 9 falls below WMA 45** → Strong bearish momentum.
- **RSI is between EMA 9 & WMA 45** → Market may be consolidating or oscillating.
### 🎨 **Visual Enhancement**
- The neutral zone (RSI between 30–70) is lightly shaded purple to reduce visual noise.
- When **RSI > 70**, a green color appears and intensifies with higher RSI values, highlighting strong buying pressure.
- All values are displayed with two decimal precision for clarity.
This tool is ideal for trend-following traders and momentum-based strategies, helping you recognize early shifts in market sentiment with visual cues and cross confirmations.
Intraday Return vs IndexA relative strength indicator. Visualizes cumulative session return vs. the SPX or another chosen benchmark.

NR4/NR7 + Strong Uptrend FilterNR4/NR7 Tight Range Breakout Scanner with Trend Confirmation
This script identifies explosive breakout candidates by scanning for NR4 (Narrowest Range in 4 days) and NR7 (Narrowest Range in 7 days) setups, only when the underlying stock is showing strong bullish alignment.
Why This Matters
Narrow range candles often precede volatility. When you combine that compression with a strong uptrend, you’re essentially spotting a coiled spring—just before the snap. Most traders chase moves. This one waits—quiet, deliberate, prepared.
Trend Filter Criteria
To ensure quality and avoid weak setups, the scanner only signals when:
The closing price is above the 10 EMA
The 10 EMA is above the 20 EMA
This confirms strong short-term momentum and trend alignment—what some call a “momentum staircase.” It keeps you on the frontside of the move and filters out chop, fakeouts, and death-by-a-thousand-wick scenarios.
Visuals
Orange Label → NR4 in a strong trend
Purple Label → NR7 in a strong trend
Background also highlights to give subtle visual cues
Best Use Case
Scan end-of-day or intraday on your watchlist. Combine it with:
MACD expansion
Low float + news catalysts
Volume surges
Breakout-ready chart structure
Result?
You don’t chase.
You don’t guess.
You stalk high-probability trades like a nobleman with a sniper rifle.

NR4/NR7 + Trend + MACD Filter📈 NR4/NR7 Breakout Scanner — with Trend & Momentum Filters
This script scans for NR4 and NR7 patterns—tight inside days that often precede explosive moves. But we don’t stop there. We filter for high-probability setups only, using:
✅ Trend Confirmation:
Price is above the 20 EMA
10 EMA is above the 20 EMA
(We’re not buying weakness. The structure must be bullish.)
✅ Momentum Confirmation (MACD Filter):
The MACD fast line is above the signal line
(Momentum must already be in gear—not catching a falling knife.)
This combo gives you a coiled spring setup—tight range, in a clear trend, with momentum pushing in your favour.
It’s ideal for breakout traders, swing traders, and anyone who wants to avoid false starts on the wrong side of the tape.
NR4 setups are marked orange,
NR7 setups are marked purple.
Stick to the right side of the trend, and let the squeeze do the rest.

NR4/NR7 IndicatorWhat It Does:
Detects NR4 = today's range smaller than last 3
Detects NR7 = today's range smaller than last 6
Plots coloured labels + background so you can spot ‘em at a glance

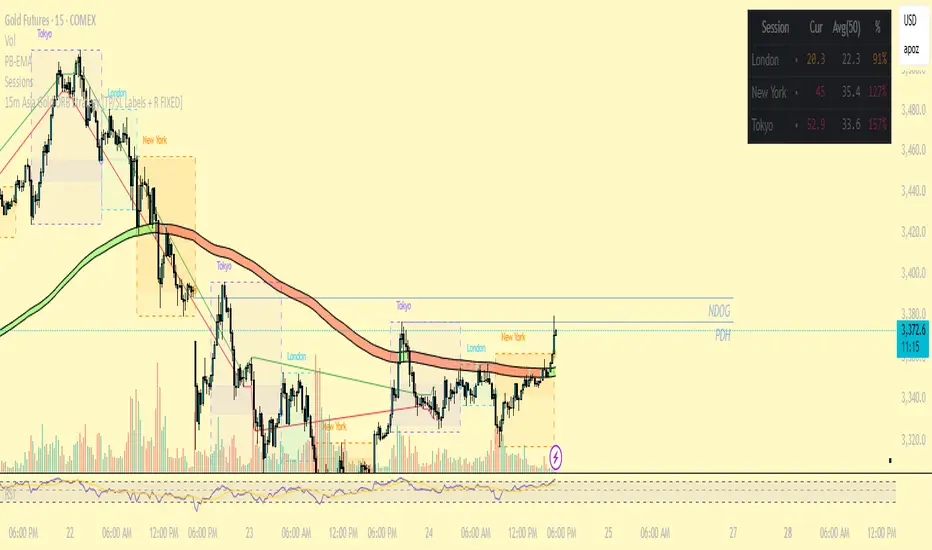
Gold ORB Strategy (15-min Range, 5-min Entry)The Gold ORB (Opening Range Breakout) Strategy is designed for day traders looking to capitalize on the price action in the early part of the trading day, specifically using a 15-minute range for identifying the opening range and a 5-minute timeframe for breakout entries. The strategy trades the Gold market (XAU/USD) during the New York session.
Opening Range: The strategy defines the Opening Range (ORB) between 9:30 AM EST and 9:45 AM EST using the highest and lowest points during this 15-minute window.
Breakout Entries: The strategy enters trades when the price breaks above the ORB high for a long position or below the ORB low for a short position. It waits for a 5-minute candle close outside the range before entering a trade.
Stop Loss and Take Profit: The stop loss is placed at 50% of the ORB range, and the take profit is set at twice the ORB range (1:2 risk-reward ratio).
Time Window: The strategy only executes trades before 12:00 PM EST, avoiding late-day market fluctuations and consolidations.
higher timeframe candle rangecreates a range around the selected timeframe in minutes (other than D/W/M)
use wherever deemed strong

Jack's ADX with 6TF TABLEUpdated the table to be more compact and added extra timeframe - 1m, 5m, 15m, 26m, 1H, 4H
Also added option to set font size.

RSI Bars cleanan update of the excellent concept of RSI chart bars by Glaz ... modified to add a filter for how many bars would be considered a valid signal, optional arrows on valid signals, coloring separate for bar, wick, and body to make RSI bars more obvious, and multi-timeframe ability. Screenshot is set to 8/70/30 and at least 3 RSI bars for an arrow. Highlights are I believe slightly different from original script as well. The emphasis here is on overheated bars that then cool off. Bars are colored when RSI crosses up through 70 then coloring stops when RSI crosses back down through 70. Same at bottom when RSI crosses down below 30 then back up through 30. These numbers as well as the frequency are user changeable. Helps with identifying tops/bottoms of cycles. Fine Print - Your mileage may vary. All standard exclusions apply. Not liable for account injury of any sort. Do not follow too closely. Not responsible for broken windshields.

Horizontal Color BandsJust horizontal bands running across the chart. Choice of 2 colors you pick and the spacing is a percentage of price. The "grid" runs up from a price you choose and also can be dragged around on the chart. Possibly makes trading measured % moves visually clearer....
