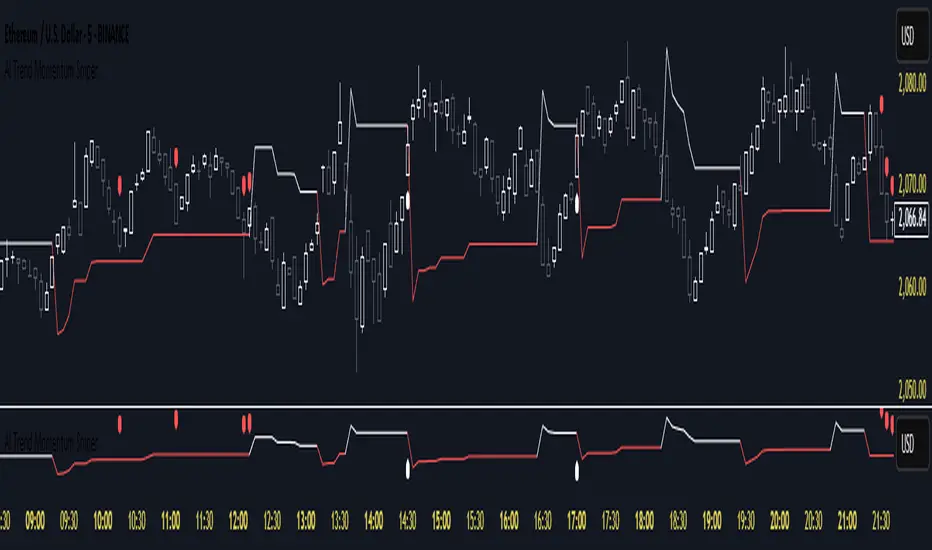
AI Trend Momentum SniperThe AI Trend Momentum Sniper is a powerful technical analysis tool designed for day trading. This strategy combines multiple momentum and trend indicators to identify high-probability entry and exit points. The indicator utilizes a combination of Supertrend, MACD, RSI, ATR (Average True Range), and On-Balance Volume (OBV) to generate real-time signals for buy and sell opportunities.
Key Features:
Supertrend for detecting market direction (bullish or bearish).
MACD for momentum confirmation, highlighting changes in market momentum.
RSI to filter out overbought/oversold conditions and ensure high-quality trades.
ATR as a volatility filter to adjust for changing market conditions.
OBV (On-Balance Volume) to confirm volume strength and trend validity.
Dynamic Stop-Loss & Take-Profit based on ATR to manage risk and lock profits.
This indicator is tailored for intraday traders looking for quick market moves, especially in volatile and high liquidity assets like Bitcoin (BTC) and Ethereum (ETH). It helps traders capture short-term trends with efficient risk management tools.
How to Apply:
Set Your Chart: Apply the AI Trend Momentum Sniper to a 5-minute (M5) or 15-minute (M15) chart for optimal performance.
Buy Signal: When the indicator generates a green arrow below the bar, it indicates a buy signal based on positive trend and momentum alignment.
Sell Signal: A red arrow above the bar signals a sell condition when the trend and momentum shift bearish.
Stop-Loss and Take-Profit: The indicator automatically calculates dynamic stop-loss and take-profit levels based on the ATR value for each trade, ensuring proper risk management.
Alerts: Set up custom alerts for buy or sell signals, and get notified instantly when opportunities arise.
Best Markets for Use:
BTC/USDT, ETH/USDT – High liquidity and volatility.
Major altcoins with sufficient volume.
Avoid using it on low-liquidity assets where price action may become erratic.
Timeframes:
This indicator is best suited for lower timeframes (5-minute to 15-minute charts) to capture quick price movements in trending markets.
Трендовый анализ
Granular MA Ribbon🎗️ The Granular MA Ribbon provides a structured view of price action on lower timeframes by incorporating both price-based and volume-weighted moving averages, offering a more nuanced view of market trends and momentum shifts. Furthermore, by using 15-minute intervals for its calculations, it ensures that intraday traders receive a smooth and responsive representation of higher timeframe trends.
⚠️ Note that this indicator is specifically optimized for the 15-minute and 1-hour charts; applying it to longer or shorter periods will distort its calculations and reduce its effectiveness. Adjust visibility settings accordingly.
🧰 Unlike traditional moving averages that may lag or fail to reflect real-time shifts in price dynamics, the Granular MA Ribbon includes a one-day exponential moving average (1D EMA), a one-day volume-weighted moving average (1D VWMA), and a one-week exponential moving average (1W EMA). Together, these elements allow traders to stay aligned with the broader market while making precise intraday trading decisions.
🤷🏻 Why Two Daily Moving Averages?
🔊 Instead of relying on a single moving average, this indicator uses both an EMA and a VWMA to provide a clearer picture of price movement. The EMA reacts quickly to price changes, making it a useful tool for identifying short-term momentum shifts. The VWMA, meanwhile, accounts for volume, ensuring that price movements supported by higher trading activity carry greater weight in the trend calculation.
💪🏻 When the EMA and VWMA diverge significantly, it signals strong momentum. If they begin to converge, it suggests that momentum is weakening or that price may be entering consolidation. The space between these two moving averages is filled with a ribbon, making it easier to see shifts in trend strength. A wide ribbon typically indicates strong momentum, while a narrowing ribbon suggests the trend may be losing steam.
🧮 Calculation Rationale
🔎 The 1D EMA and 1D VWMA are constructed using 15-minute blocks to maintain accuracy on lower timeframes. A full trading day consists of 96 fifteen-minute intervals. Instead of relying on daily candle data, which would reduce the granularity of the moving averages, this method allows the indicator to reflect intra-day trends more accurately. By breaking the day into smaller increments, the moving averages adapt more smoothly to changes in price and volume, making them more reliable for traders working on shorter timeframes.
🔍 The weekly EMA follows the same logic, adjusting based on the selected five-day or seven-day setting. If the market follows a standard five-day trading week, the one-week EMA is calculated using 480 fifteen-minute bars. If the market trades seven days a week, such as in crypto, the weekly EMA is adjusted accordingly to reflect 672 fifteen-minute bars. This setting ensures that traders using the indicator across different asset classes receive accurate trend information.
🫤 Sideways Markets
🔄 When the broader market is in a range-bound state, with no clear trend on the one-day or one-week chart, this indicator helps traders make sense of the short-term price structure. In these conditions, the ribbon will often appear flat, with the 1D EMA and 1D VWMA frequently crossing each other. This suggests that momentum is weak and that price action lacks a strong directional bias.
⚠️ A narrowing ribbon in a sideways market indicates reduced volatility and a potential breakout. If the EMA crosses above the VWMA during consolidation, it may signal a short-term upward move, especially if volume begins to increase. Conversely, if the EMA moves below the VWMA, it could indicate that selling pressure is increasing. However, in choppy conditions, crossovers alone are not enough to confirm a trade. Traders should wait for additional confirmation, such as a breakout from a defined range or a shift in volume.
♭ If the weekly EMA remains flat while the daily ribbon fluctuates, it confirms that the market lacks a strong trend. In such cases, traders may consider fading moves near the top and bottom of a range rather than expecting sustained breakouts.
💹 Trending Markets
🏗️ When the market is in a strong uptrend or downtrend, the ribbon takes on a more structured shape. A widening ribbon that slopes upward signals strong bullish momentum, with price consistently respecting the 1D EMA and VWMA as support. In a downtrend, the ribbon slopes downward, acting as dynamic resistance.
📈 In trending conditions, traders can use the ribbon to time pullback entries. In an uptrend, price often retraces to the VWMA before resuming its upward move. If price holds above both the EMA and VWMA, the trend remains strong. If price begins to close below the VWMA but remains above the EMA, it suggests weakening momentum but not necessarily a reversal. A clean break below both moving averages indicates a shift in trend structure.
📊 The one-week EMA serves as a higher timeframe guide. When price remains above the weekly EMA, it confirms that the broader trend is intact. If price pulls back to the weekly EMA and bounces, it can provide a high-confidence trade entry. Conversely, if price breaks below the weekly EMA and fails to reclaim it, it suggests that the trend may be reversing.
⏳ 5-Day and 7-Day Week Variants
🎚️ The setting for a five-day or seven-day trading week adjusts the calculation of the one-week EMA. This ensures that the indicator remains accurate across different asset classes.
5️⃣ A five-day trading week is appropriate for stocks, futures, and forex markets, where trading pauses on weekends. Using a seven-day week for these markets would create artificial distortions by including non-trading days. 7️⃣ In contrast, the seven-day week setting is ideal for crypto markets, which trade continuously. Without this adjustment, the weekly EMA would fail to reflect weekend price action, leading to misleading trend signals.
🧐 This indicator is expressly designed to complement its higher timeframe counterpart, the Triple Differential Moving Average Braid, optimized for the 1-Day chart.

SuperTrend MTF Pro [Cometreon]The SuperTrend MTF Pro takes the classic SuperTrend to a whole new level of customization and accuracy. Unlike the standard version, this indicator allows you to select different moving averages, apply it to various chart types, and fine-tune every key parameter.
If you're looking for an advanced, non-repainting, and highly configurable SuperTrend, this is the right choice for you.
🔷 New Features and Improvements
🟩 Multi-MA SuperTrend
Now you can customize the SuperTrend calculation by choosing from 15 different moving averages:
SMA (Simple Moving Average)
EMA (Exponential Moving Average)
WMA (Weighted Moving Average)
RMA (Smoothed Moving Average)
HMA (Hull Moving Average)
JMA (Jurik Moving Average)
DEMA (Double Exponential Moving Average)
TEMA (Triple Exponential Moving Average)
LSMA (Least Squares Moving Average)
VWMA (Volume-Weighted Moving Average)
SMMA (Smoothed Moving Average)
KAMA (Kaufman’s Adaptive Moving Average)
ALMA (Arnaud Legoux Moving Average)
FRAMA (Fractal Adaptive Moving Average)
VIDYA (Variable Index Dynamic Average)
🟩 Multiple Chart Types
You're no longer limited to candlestick charts! Now you can use SuperTrend with different chart formats, including:
Heikin Ashi
Renko
Kagi
Line Break
Point & Figure
🟩 Customizable Timeframe
Now you can adjust the SuperTrend timeframe without repainting issues, avoiding signal distortions.
🔷 Technical Details and Customizable Inputs
SuperTrend offers multiple customization options to fit any trading strategy:
1️⃣ ATR Period – Defines the ATR length, affecting the indicator’s sensitivity.
2️⃣ Source – Selects the price value used for calculations (Close, HL2, Open, etc.).
3️⃣ ATR Mult – Multiplies the ATR to determine band distance. Higher values reduce false signals, lower values make it more reactive.
4️⃣ Change ATR Calculation Method – When enabled, uses the default ATR method; when disabled, allows selecting another Moving Average with "Use Different Type".
5️⃣ Source Break – Defines the price source for trend changes (Close for more stability, High/Low for more reactivity).
6️⃣ Use Different Type – Allows selecting an alternative Moving Average for ATR calculation if "Change ATR Calculation Method" is disabled.
7️⃣ SuperTrend Type – Advanced options for specific MAs (JMA, ALMA, FRAMA, VIDYA), with dedicated parameters like Phase, Sigma, and Offset for optimized responsiveness.
8️⃣ Ticker Settings – Customize parameters for special chart types such as Renko, Heikin Ashi, Kagi, Line Break, and Point & Figure, adjusting reversal, number of lines, and ATR length.
9️⃣ Timeframe – Enables using SuperTrend on a higher timeframe.
🔟 Wait for Timeframe Closes -
Enabled ✅ – Prevents multiple signals, useful for precise alerts.
Disabled ❌ – Displays SuperTrend smoothly without interruptions.
🔷 How to Use SuperTrend MTF Pro
🔍 Identifying Trends
SuperTrend follows the ongoing trend and provides clear visual signals:
When the price is above the line, the trend is bullish.
When the price is below the line, the trend is bearish.
📈 Interpreting Signals
Line color and position change → Possible trend reversal
Bounce off the line → Potential trend continuation
Strong breakout of the line → Possible reversal
🛠 Integration with Other Tools
RSI or MACD to filter false signals
Moving Averages to confirm trend direction
Support and Resistance to improve entry points
☄️ If you find this indicator useful, leave a Boost to support its development!
Every feedback helps to continuously improve the tool, offering an even more effective trading experience. Share your thoughts in the comments! 🚀🔥

TheStrat: Failed 2'sThis indicator identifies and highlights Failed 2-Up (2U) and Failed 2-Down (2D) patterns in The Strat trading framework. These patterns signal a potential reversal when a 2-Up (higher high) or 2-Down (lower low) candle fails to follow through and reverses, offering high-probability trade setups.

Advanced Swing High/Low Trend Lines with MA Filter# Advanced Swing High/Low Trend Lines Indicator
## Overview
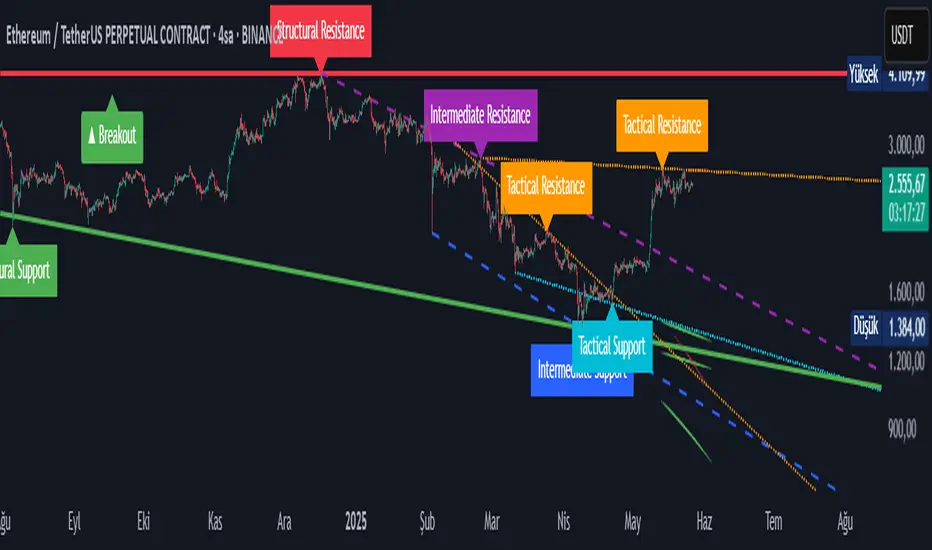
This advanced indicator identifies and draws trend lines based on swing highs and lows across three different timeframes (large, middle, and small trends). It's designed to help traders visualize market structure and potential support/resistance levels at multiple scales simultaneously.
## Key Features
- *Multi-Timeframe Analysis*: Simultaneously tracks trends at large (200-bar), middle (100-bar), and small (50-bar) scales
- *Customizable Visualization*: Different colors, widths, and styles for each trend level
- *Trend Confirmation System*: Requires minimum consecutive pivot points to validate trends
- *Trend Filter Option*: Can align trends with 200 EMA direction for consistency
## Recommended Settings
### For Long-Term Investors:
- Large Swing Length: 200-300
- Middle Swing Length: 100-150
- Small Swing Length: 50-75
- Enable Trend Filter: Yes
- Confirmation Points: 4-5
### For Swing Traders:
- Large Swing Length: 100
- Middle Swing Length: 50
- Small Swing Length: 20-30
- Enable Trend Filter: Optional
- Confirmation Points: 3
### For Day Traders:
- Large Swing Length: 50
- Middle Swing Length: 20
- Small Swing Length: 5-10
- Enable Trend Filter: No
- Confirmation Points: 2-3
## How to Use
### Identification:
1. *Large Trend Lines* (Red/Green): Show major market structure
2. *Middle Trend Lines* (Purple/Aqua): Intermediate levels
3. *Small Trend Lines* (Orange/Blue): Short-term price action
### Trading Applications:
- *Breakout Trading*: Watch for price breaking through multiple trend lines
- *Bounce Trading*: Look for reactions at confluence of trend lines
- *Trend Confirmation*: Aligned trends across timeframes suggest stronger moves
### Best Markets:
- Works well in trending markets (forex, indices)
- Effective in higher timeframes (1H+)
- Can be used in ranging markets to identify boundaries
## Customization Tips
1. For cleaner charts, reduce line widths in congested markets
2. Use dotted styles for smaller trends to reduce visual clutter
3. Adjust confirmation points based on market volatility (higher for noisy markets)
## Limitations
- May repaint on current swing points
- Works best in trending conditions
- Requires sufficient historical data for longer swing lengths
This indicator provides a comprehensive view of market structure across multiple timeframes, helping traders make more informed decisions by visualizing the hierarchy of support and resistance levels.
Buy on 5% dip strategy with time adjustment
This script is a strategy called "Buy on 5% Dip Strategy with Time Adjustment 📉💡," which detects a 5% drop in price and triggers a buy signal 🔔. It also automatically closes the position once the set profit target is reached 💰, and it has additional logic to close the position if the loss exceeds 14% after holding for 230 days ⏳.
Strategy Explanation
Buy Condition: A buy signal is triggered when the price drops 5% from the highest price reached 🔻.
Take Profit: The position is closed when the price hits a 1.22x target from the average entry price 📈.
Forced Sell Condition: If the position is held for more than 230 days and the loss exceeds 14%, the position is automatically closed 🚫.
Leverage & Capital Allocation: Leverage is adjustable ⚖️, and you can set the percentage of capital allocated to each trade 💸.
Time Limits: The strategy allows you to set a start and end time ⏰ for trading, making the strategy active only within that specific period.
Code Credits and References
Credits: This script utilizes ideas and code from @QuantNomad and jangdokang for the profit table and algorithm concepts 🔧.
Sources:
Monthly Performance Table Script by QuantNomad:
ZenAndTheArtOfTrading's Script:
Strategy Performance
This strategy provides risk management through take profit and forced sell conditions and includes a performance table 📊 to track monthly and yearly results. You can compare backtest results with real-time performance to evaluate the strategy's effectiveness.
The performance numbers shown in the backtest reflect what would have happened if you had used this strategy since the launch date of the SOXL (the Direxion Daily Semiconductor Bull 3x Shares ETF) 📅. These results are not hypothetical but based on actual performance from the day of the ETF’s launch 📈.
Caution ⚠️
No Guarantee of Future Results: The results are based on historical performance from the launch of the SOXL ETF, but past performance does not guarantee future results. It’s important to approach with caution when applying it to live trading 🔍.
Risk Management: Leverage and capital allocation settings are crucial for managing risk ⚠️. Make sure to adjust these according to your risk tolerance ⚖️.

Fourier Trend Energy (Prototype)Fourier Trend Energy (Prototype)
This indicator brings the logic of Fourier-based trend analysis into Pine Script.
It estimates two key components:
Low-Frequency Energy — representing the strength of the underlying trend
High-Frequency Energy — representing noise, volatility, or deviation from the trend
🔹 Green line → trend strength
🔸 Orange line → short-term noise
🟩🟥 Background color → shows whether trend energy is increasing or decreasing
You can use it to:
Detect early trend formation
Filter fakeouts during consolidation
Spot momentum shifts based on energy crossovers
This is not a traditional oscillator — it’s a frequency-inspired tool to help you understand when the market is charging for a move.

Dynamic Trend Indicator (DTI) - VWAP FilterThe Dynamic Trend Indicator (DTI) with VWAP Filter is a trend-following indicator.
It aims to identify and follow market trends while minimizing false signals in choppy or ranging markets.
The DTI combines a dynamically adjusted Exponential Moving Average (EMA) with a daily Volume Weighted Average Price (VWAP) confirmation filter and a cooldown mechanism to enhance signal reliability. This indicator is particularly useful for traders on intraday timeframes (e.g., 4-hour charts) who want to align their trades with the broader daily trend while avoiding whipsaws.
Key Features:
Dynamic Trend Line:
The core of the DTI is a trend line calculated using a custom EMA that adjusts its period dynamically based on market conditions.
The period of the EMA is determined by a combination of volatility (measured via ATR) and trend strength (measured via price momentum). In strong trends, the period shortens for faster responsiveness; in weak or ranging markets, it lengthens to reduce noise.
An optional smoothing EMA can be applied to the dynamic trend line to further reduce noise, with a user-defined smoothing length.
Daily VWAP Confirmation Filter:
A daily VWAP is calculated to provide a higher-timeframe trend bias. VWAP represents the average price paid for an asset during the day, weighted by volume, and is often used as a benchmark by institutional traders.
Buy signals are only generated when the price is above the daily VWAP (indicating a bullish daily bias), and sell signals are only generated when the price is below the VWAP (indicating a bearish daily bias).
The VWAP resets at the start of each day, ensuring it reflects the current day’s trading activity.
Cooldown Mechanism:
To prevent rapid signal reversals (whipsaws), the indicator includes a cooldown period between signals. After a buy or sell signal is generated, no new signals can be generated for a user-defined number of bars (default: 5 bars).
This helps filter out noise in choppy markets, ensuring signals are spaced out and more likely to align with significant trend changes.
Visual Elements:
Trend Line: Plotted on the chart, colored green when the price is above (uptrend) and red when below (downtrend). A gray color indicates a neutral trend.
Buy/Sell Signals: Displayed as green triangles below the bar for buy signals and red triangles above the bar for sell signals.
Background Coloring: The chart background is shaded green during uptrends and red during downtrends, providing a quick visual cue of the trend direction.
Daily VWAP Line: Optionally plotted as a purple step line, allowing traders to see the VWAP level and its relationship to the price.
Alerts:
The indicator includes built-in alerts for buy and sell signals, triggered when the price crosses the trend line and satisfies the VWAP filter and cooldown conditions.
Alert messages specify whether the signal is a buy or sell and confirm that the VWAP condition was met (e.g., "DTI Buy Signal: Price crossed above trend line and VWAP").
Input Parameters
Base Length (default: 14): The base period for calculating volatility and trend strength, used to adjust the dynamic EMA period.
Volatility Multiplier (default: 1.5): Adjusts the sensitivity of the dynamic period to market volatility (via ATR).
Trend Threshold (default: 0.5): Controls the sensitivity of the dynamic period to trend strength (via price momentum).
Use Smoothing (default: true): Enables/disables smoothing of the trend line with an additional EMA.
Smoothing Length (default: 3): The period for the smoothing EMA, if enabled.
Cooldown Bars (default: 5): The minimum number of bars between consecutive signals, reducing signal frequency in choppy markets.
Show Daily VWAP (default: true): Toggles the display of the daily VWAP line on the chart.
How It Works
Dynamic Trend Line Calculation:
Volatility is measured using the Average True Range (ATR) over the base length, scaled by the volatility multiplier.
Trend strength is calculated as the absolute price momentum (change in price over the base length) divided by the volatility factor.
The dynamic EMA period is adjusted based on the trend strength: stronger trends result in a shorter period (faster response), while weaker trends result in a longer period (more stability). The period is constrained between 5 and 50 to avoid extreme values.
A custom EMA function is used to handle the dynamic period, as Pine Script’s built-in ta.ema() requires a fixed length. The trend line is optionally smoothed with a secondary EMA.
Signal Generation:
A buy signal is generated when the price crosses above the trend line, the price is above the daily VWAP, and the cooldown period has elapsed.
A sell signal is generated when the price crosses below the trend line, the price is below the daily VWAP, and the cooldown period has elapsed.
The cooldown mechanism ensures that signals are not generated too frequently, reducing false signals in ranging markets.
Daily VWAP Calculation:
The VWAP is calculated by accumulating the price-volume product (close * volume) and total volume for the day, resetting at the start of each new day.
The VWAP is then computed as the cumulative price-volume divided by the cumulative volume, providing a volume-weighted average price for the day.
Usage
Timeframe: Best suited for intraday timeframes (e.g., 1-hour, 4-hour) where the daily VWAP provides a higher-timeframe trend bias. It can also be used on daily charts with adjustments to the cooldown period.
Markets: Works well in trending markets (e.g., forex, crypto, stocks) where the dynamic trend line can capture sustained price movements. The VWAP filter helps align signals with the daily trend, making it effective for assets with clear daily biases.
Trading Strategy:
Buy: Enter a long position when a green triangle (buy signal) appears, indicating the price has crossed above the trend line and is above the daily VWAP.
Sell: Enter a short position (or exit a long) when a red triangle (sell signal) appears, indicating the price has crossed below the trend line and is below the daily VWAP.
Use the trend line and VWAP as dynamic support/resistance levels to set stop-losses or take-profit targets.
Backtesting: Use TradingView’s strategy tester to evaluate the indicator’s performance on your chosen market and timeframe, adjusting parameters like cooldown_bars and volatility_mult to optimize for profitability.
Example
On a 4-hour SOLUSDT chart, the DTI with VWAP Filter might show:
An uptrend with the price above the green trend line and above the daily VWAP, generating buy signals as the price continues to rise.
A downtrend where the price falls below the red trend line and the daily VWAP, generating sell signals that align with the bearish daily bias.
During choppy periods, the cooldown mechanism and VWAP filter reduce false signals, ensuring trades are taken only when the price aligns with the daily trend.
Limitations
Lagging Nature: Like all trend-following indicators, the DTI may lag during sharp price reversals, as the dynamic EMA needs time to adjust.
Ranging Markets: While the VWAP filter and cooldown mechanism reduce whipsaws, the indicator may still generate some false signals in strongly ranging markets. Combining it with a trend strength filter (e.g., ADX) can help.
VWAP Dependency: The effectiveness of the VWAP filter depends on the market’s respect for the daily VWAP as a support/resistance level. In markets with low volume or erratic price action, the VWAP may be less reliable.
Potential Improvements
VWAP Buffer: Add a percentage buffer around the VWAP (e.g., require the price to be 1% above/below) to further reduce noise.
Multi-Timeframe VWAP: Incorporate a weekly VWAP for additional trend confirmation on longer timeframes.
Trend Strength Filter: Add an ADX filter to ensure signals are generated only during strong trends (e.g., ADX > 25).

ACCURATE TREND LEVELS - TABLE PSv6.1Accurate Trend Level Indicator
Description:
The "Accurate Trend Level" indicator is a powerful tool designed to identify market trends and potential reversals with precision. Built on the concept (foundation) of Swing Highs and Swing Lows, this indicator easily detects uptrends and downtrends, providing traders with clear signals for trend continuation or reversal. Whether you are a swing trader or a trend follower, this indicator offers customization options to suit your trading style.
Key Features:
Trend Identification: Accurately identifies uptrends and downtrends based on Swing High and Swing Low points. This indicator provides signals for Up after Down and Down after Up.
Percentage Adjustment: Includes a customizable percentage factor that reduces false signals and helps identify accurate and strong trends.
Trend Table: Displays essential data in a table, such as:
Last and running Trend Position (Uptrend/Downtrend)
Date and Time of the last and running trend change
Reversal Level (price level for the next potential trend change)
Max. Run-up feature is also provided, which shows how much the market has moved according to the trend.
How It Works:
The indicator analyzes price action using Swing Highs and Lows to determine the current trend direction. A user-defined percentage threshold filters out minor fluctuations, ensuring only significant trends are highlighted. The table provides a quick snapshot of the latest trend data, while reversal levels help traders anticipate the next move.

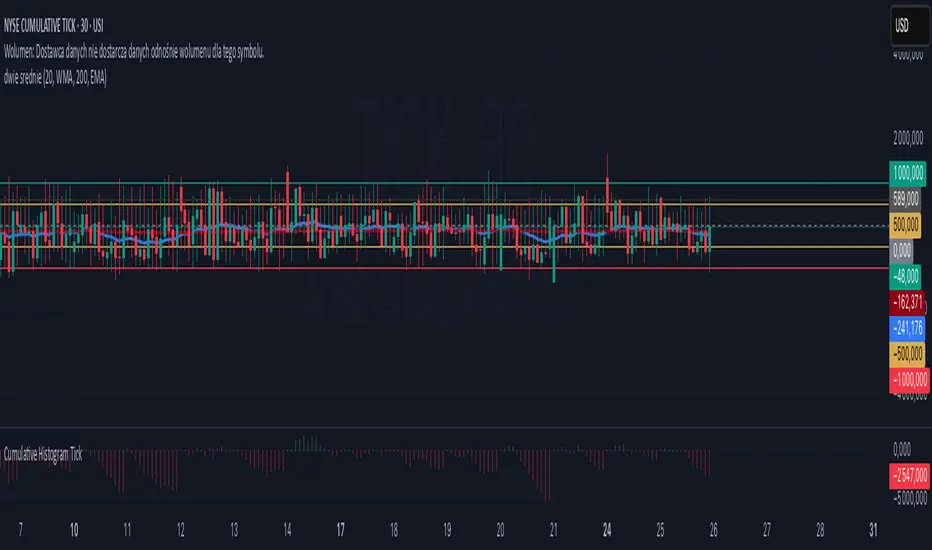
Cumulative Histogram TickThis script is designed to create a cumulative histogram based on tick data from a specific financial instrument. The histogram resets at the start of each trading session, which is defined by a fixed time.
Key Components:
Tick Data Retrieval:
The script fetches the closing tick values from the specified instrument using request.security("TICK.NY", timeframe.period, close). This line ensures that the script works with the tick data for each bar on the chart.
Session Start and End Detection:
Start Hour: The script checks if the current bar's time is 9:30 AM (hour == 9 and minute == 30). This is used to reset the cumulative value at the beginning of each trading session.
End Hour: It also checks if the current bar's time is 4:00 PM (hour == 16). However, this condition is used to prevent further accumulation after the session ends.
Cumulative Value Management:
Reset: When the start hour condition is met (startHour), the cumulative value (cumulative) is reset to zero. This ensures that each trading session starts with a clean slate.
Accumulation: For all bars that are not at the end hour (not endHour), the tick value is added to the cumulative total. This process continues until the end of the trading session.
Histogram Visualization:
The cumulative value is plotted as a histogram using plot.style_histogram. The color of the histogram changes based on whether the cumulative value is positive (green) or negative (red).
Usage
This script is useful for analyzing intraday market activity by visualizing the accumulation of tick data over a trading session. It helps traders identify trends or patterns within each session, which can be valuable for making informed trading decisions.
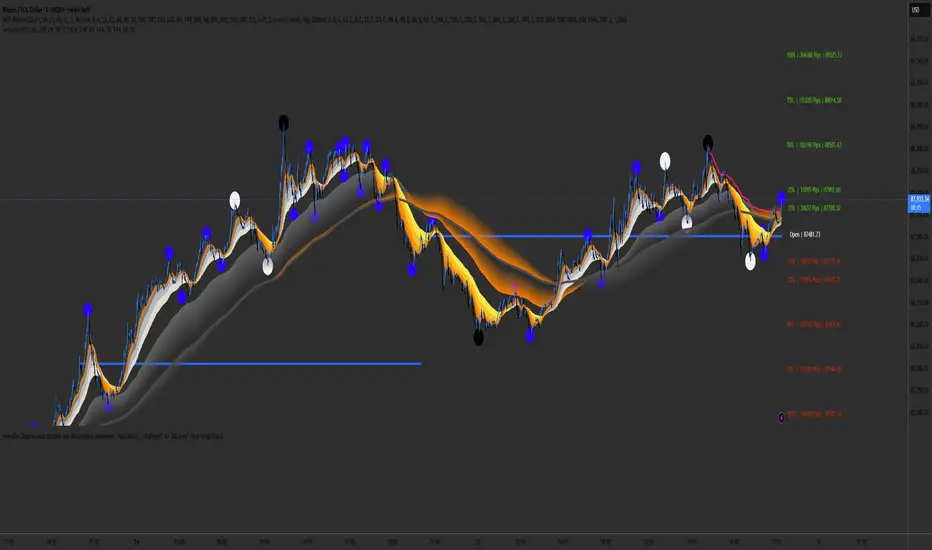
SemaforThis is the 4 Level Semafor indicator with Daily Open Line and Average Session Range. Also on the chart is the EMA Ribbon indicator.
Credit to:
Devlucem for the Semafor indicator
Quantvue for the Average Session Range
Shusterivi for the Daily Open Line
MYNAMEISBRANDON for the EMA Ribbon
The Semafors are based on the ZigZag indicator and show higher highs/lower lows of a specified period, determined by the user and applied in settings.
The default periods I use are:
10 period (hidden on this chart)
50 period-blue dots
250 period-white dots
615 period-black dots
Just as the ZigZag indicator will recalculate so to will the semafors, as additional candles are built. The semafor indicator is never to be used as a stand alone signal. It must be combined with other indicators to be used effectively. What we look for are the semafor patterns of a large white dot followed by a 1st blue dot opposite of the white. Then a 2nd blue dot in agreement with the white dot. In theory, the 2nd blue dot is seen as confirmation of the establishment of the white semafor..
When combined with Daily Open Line, ADR (Average Sessions Range), EMA cross and VWAP anchored to your 250 semafors, your odds are greatly increased. Add to that the knowledge of basic market structure and the wisdom that comes from patience and you have a very powerful weapon.
The Daily Open...I trade the M1 chart and also draw a H4 Open Line on my chart for the smaller time frames. Price will tend to trade away from the Daily Open Line. In many cases until it reaches certain levels...Fib, Gann, ADR, etc., then runs through a pullback cycle. I like the ADR levels. The ADR can give clues when entering a consolidation phase, ie trading between the buy side and sell side 15% levels. Trading away from the Daily Open(or H4 open) along with breaking the 15% level, while in agreement with a semafor pattern is a good sign.
Add to that confluence the agreement of your MA cross and the 250 semafor Anchored VWAP and you have a solid signal to help determine your actions. This trend following layout will work on any time frame. I just really like the M1 for its precision, not for crazy back and forth all day. With the exception of some strong pull back signals, I don't enter any more trades on the M1 than on M5, 15 or 30.
This is based on and follows the teachings of Xard and his trading strategy. Just as I don't want to take anyone's credit for these indicators, I won't take credit for what I have been taught either.
The trader can obviously use their favorite MA cross indicator. But this one is visually beautiful AND displays the current time frame and 1 time frame higher on the chart...awesome!
Of note, I do run into trouble at times with the 615 period semafor. I have been told it is because TradingView has trouble with extended period indicators. As a matter of fact, I would like a much higher period for my biggest semafor. I would like it set at 1250, but that seems to be a no starter. If anyone has a solution, that would be welcomed news.
TimeMapTimeMap is a visual price-reference indicator designed to help traders rapidly visualize how current price levels relate to significant historical closing prices. It overlays your chart with reference lines representing past weekly, monthly, quarterly (3-month), semi-annual (6-month), and annual closing prices. By clearly plotting these historical price references, TimeMap helps traders quickly gauge price position relative to historical market structure, aiding in the identification of trends, support/resistance levels, and potential reversals.
How it Works:
The indicator calculates the precise number of historical bars corresponding to weekly, monthly, quarterly, semi-annual, and annual intervals, dynamically adjusting according to your chart’s timeframe (intraday, daily, weekly, monthly) and chosen market type (Stocks US, Crypto, Forex, or Futures). Historical closing prices from these periods are plotted directly on your chart as horizontal reference lines.
For intraday traders, the script accurately calculates historical offsets considering regular and extended trading sessions (e.g., pre-market and after-hours sessions for US stocks), ensuring correct positioning of historical lines.
User-Configurable Inputs Explained in Detail:
Market Type:
Allows you to specify your trading instrument type, automatically adjusting calculations for:
- Stocks US (default): 390 minutes per regular session (780 minutes if extended hours enabled), 5 trading days/week.
- Crypto: 1440 minutes/day, 7 trading days/week.
- Forex: 1440 minutes/day, 5 trading days/week.
- Futures: 1320 minutes/day, 5 trading days/week.
Show Weekly Close:
When enabled, plots a line at the exact closing price from one week ago. Provides short-term context and helps identify recent price momentum.
Show Monthly Close:
When enabled, plots a line at the exact closing price from one month ago. Helpful for evaluating medium-term price positioning and monthly trend strength.
Show 3-Month Close:
When enabled, plots a line at the exact closing price from three months ago. Useful for assessing quarterly market shifts, intermediate trend changes, and broader market sentiment.
Show 6-Month Close:
When enabled, plots a line at the exact closing price from six months ago. Useful for identifying semi-annual trends, significant price pivots, and longer-term support/resistance levels.
Show 1-Year Close:
When enabled, plots a line at the exact closing price from one year ago. Excellent for assessing long-term market direction and key annual price levels.
Enable Smoothing:
Activates a Simple Moving Average (SMA) smoothing of historical reference lines, reducing volatility and providing clearer visual references. Recommended for traders preferring less volatile reference levels.
Smoothing Length:
Determines the number of bars used in calculating the SMA smoothing of historical lines. Higher values result in smoother but slightly delayed reference lines; lower values offer more immediate yet more volatile levels.
Use Extended Hours (Intraday Only):
When enabled (only applicable for Stocks US), it accounts for pre-market and after-hours trading sessions, providing accurate intraday historical line calculations based on extended sessions (typically 780 minutes/day total).
Important Notes and Compliance:
- This indicator does not provide trading signals, recommendations, or predictions. It serves purely as a visual analytical tool to supplement traders’ existing methods.
- Historical lines plotted are strictly based on past available price data; the indicator never accesses future data or data outside the scope of Pine Script’s standard capabilities.
- The script incorporates built-in logic to avoid runtime errors if insufficient historical data exists for a selected timeframe, ensuring robustness even with limited historical bars.
- TimeMap is original work developed exclusively by Julien Eche (@Julien_Eche). It does not reuse or replicate third-party or existing open-source scripts.
Recommended Best Practices:
- Use TimeMap as a complementary analytical reference, not as a standalone strategy or trade decision-making tool.
- Adapt displayed historical periods and smoothing settings based on your trading style and market approach.
- Default plot colors are optimized for readability on dark-background charts; adjust as necessary according to your preference and chart color scheme.
This script is published open-source to benefit the entire TradingView community and fully complies with all TradingView script publishing rules and guidelines.

Low Liquidity Zones [PhenLabs]📊 Low Liquidity Zones
Version: PineScript™ v6
📌 Description
Low Liquidity Zones identifies and highlights periods of unusually low trading volume on your chart, marking areas where price movement occurred with minimal participation. These zones often represent potential support and resistance levels that may be more susceptible to price breakouts or reversals when revisited with higher volume.
Unlike traditional volume analysis tools that focus on high volume spikes, this indicator specializes in detecting low liquidity areas where price moved with minimal resistance. Each zone displays its volume delta, providing insight into buying vs. selling pressure during these thin liquidity periods. This combination of low volume detection and delta analysis helps traders identify potential price inefficiencies and weak structures in the market.
🚀 Points of Innovation
• Identifies low liquidity zones that most volume indicators overlook but which often become significant technical levels
• Displays volume delta within each zone, showing net buying/selling pressure during low liquidity periods
• Dynamically adjusts to different timeframes, allowing analysis across multiple time horizons
• Filters zones by maximum size percentage to focus only on precise price levels
• Maintains historical zones until they expire based on your lookback settings, creating a cumulative map of potential support/resistance areas
🔧 Core Components
• Low Volume Detection: Identifies candles where volume falls below a specified threshold relative to recent average volume, highlighting potential liquidity gaps.
• Volume Delta Analysis: Calculates and displays the net buying/selling pressure within each low liquidity zone, providing insight into the directional bias during low participation periods.
• Dynamic Timeframe Adjustment: Automatically scales analysis periods to match your selected timeframe preference, ensuring consistent identification of low liquidity zones regardless of chart settings.
• Zone Management System: Creates, tracks, and expires low liquidity zones based on your configured settings, maintaining visual clarity on the chart.
🔥 Key Features
• Low Volume Identification: Automatically detects and highlights candles where volume falls below your specified threshold compared to the moving average.
• Volume Delta Visualization: Shows the net volume delta within each zone, providing insight into whether buyers or sellers were dominant despite the low overall volume.
• Flexible Timeframe Analysis: Analyze low liquidity zones across multiple predefined timeframes or use a custom lookback period specific to your trading style.
• Zone Size Filtering: Filters out excessively large zones to focus only on precise price levels, improving signal quality.
• Automatic Zone Expiration: Older zones are automatically removed after your specified lookback period to maintain a clean, relevant chart display.
🎨 Visualization
• Volume Delta Labels: Each zone displays its volume delta with “+” or “-” prefix and K/M suffix for easy interpretation, showing the strength and direction of pressure during the low volume period.
• Persistent Historical Mapping: Zones remain visible for your specified lookback period, creating a cumulative map of potential support and resistance levels forming under low liquidity conditions.
📖 Usage Guidelines
Analysis Timeframe
Default: 1D
Range/Options: 15M, 1HR, 3HR, 4HR, 8HR, 16HR, 1D, 3D, 5D, 1W, Custom
Description: Determines the historical period to analyze for low liquidity zones. Shorter timeframes provide more recent data while longer timeframes offer a more comprehensive view of significant zones. Use Custom option with the setting below for precise control.
Custom Period (Bars)
Default: 1000
Range: 1+
Description: Number of bars to analyze when using Custom timeframe option. Higher values show more historical zones but may impact performance.
Volume Analysis
Volume Threshold Divisor
Default: 0.5
Range: 0.1-1.0
Description: Maximum volume relative to average to identify low volume zones. Example: 0.5 means volume must be below 50% of the average to qualify as low volume. Lower values create more selective zones while higher values identify more zones.
Volume MA Length
Default: 15
Range: 1+
Description: Period length for volume moving average calculation. Shorter periods make the indicator more responsive to recent volume changes, while longer periods provide a more stable baseline.
Zone Settings
Zone Fill Color
Default: #2196F3 (80% transparency)
Description: Color and transparency of the low liquidity zones. Choose colors that stand out against your chart background without obscuring price action.
Maximum Zone Size %
Default: 0.5
Range: 0.1+
Description: Maximum allowed height of a zone as percentage of price. Larger zones are filtered out. Lower values create more precise zones focusing on tight price ranges.
Display Options
Show Volume Delta
Default: true
Description: Toggles the display of volume delta within each zone. Enabling this provides additional insight into buying vs. selling pressure during low volume periods.
Delta Text Position
Default: Right
Options: Left, Center, Right
Description: Controls the horizontal alignment of the delta text within zones. Adjust based on your chart layout for optimal readability.
✅ Best Use Cases
• Identifying potential support and resistance levels that formed during periods of thin liquidity
• Spotting price inefficiencies where larger players may have moved price with minimal volume
• Finding low-volume consolidation areas that may serve as breakout or reversal zones when revisited
• Locating potential stop-hunting zones where price moved on minimal participation
• Complementing traditional support/resistance analysis with volume context
⚠️ Limitations
• Requires volume data to function; will not work on symbols where the data provider doesn’t supply volume information
• Low volume zones don’t guarantee future support/resistance - they simply highlight potential areas of interest
• Works best on liquid instruments where volume data has meaningful fluctuations
• Historical analysis is limited by the maximum allowed box count (500) in TradingView
• Volume delta in some markets may not perfectly reflect buying vs. selling pressure due to data limitations
💡 What Makes This Unique
• Focus on Low Volume: Unlike some indicators that highlight high volume events particularly like our very own TLZ indicator, this tool specifically identifies potentially significant price zones that formed with minimal participation.
• Delta + Low Volume Integration: Combines volume delta analysis with low volume detection to reveal directional bias during thin liquidity periods.
• Flexible Lookback System: The dynamic timeframe system allows analysis across any timeframe while maintaining consistent zone identification criteria.
• Support/Resistance Zone Generation: Automatically builds a visual map of potential technical levels based on volume behavior rather than just price patterns.
🔬 How It Works
1. Volume Baseline Calculation:
The indicator calculates a moving average of volume over your specified period to establish a baseline for normal market participation. This adaptive baseline accounts for natural volume fluctuations across different market conditions.
2. Low Volume Detection:
Each candle’s volume is compared to the moving average and flagged when it falls below your threshold divisor. The indicator also filters zones by maximum size to ensure only precise price levels are highlighted.
3. Volume Delta Integration:
For each identified low volume candle, the indicator retrieves the volume delta from a lower timeframe. This delta value is formatted with appropriate scaling (K/M) and displayed within the zone.
4. Zone Management:
New zones are created and tracked in a dynamic array, with each zone extending rightward until it expires. The system automatically removes expired zones based on your lookback period to maintain a clean chart.
💡 Note:
Low liquidity zones often represent areas where price moved with minimal participation, which can indicate potential market inefficiencies. These zones frequently become important support/resistance levels when revisited, especially if approached with higher volume. Consider using this indicator alongside traditional technical analysis tools for comprehensive market context. For best results, experiment with different volume threshold settings based on the specific instrument’s typical volume patterns.

HEMA Trend Levels [AlgoAlpha]OVERVIEW
This script plots two Hull-EMA (HEMA) curves to define a color-coded dynamic trend zone and generate context-aware breakout levels, allowing traders to easily visualize prevailing momentum and identify high-probability breakout retests. The script blends smoothed price tracking with conditional box plotting, delivering both trend-following and mean-reversion signals within one system. It is designed to be simple to read visually while offering nuanced trend shifts and test confirmations.
█ CONCEPTS
The Hull-EMA (HEMA) is a hybrid moving average combining the responsiveness of short EMAs with the smoothness of longer ones. It applies layered smoothing: first by subtracting a full EMA from a half-length EMA (doubling the short EMA's weight), and then by smoothing the result again with the square root of the original length. This process reduces lag while maintaining clarity in direction changes. In this script, two HEMAs—fast and slow—are used to define the trend structure and trigger events when they cross. These crossovers generate "trend shift boxes"—temporary support or resistance zones drawn immediately after trend transitions—to detect price retests in the new direction. When price cleanly retests these levels, the script marks them as confirmations with triangle symbols, helping traders isolate better continuation setups. Color-coded bars further enhance visual interpretation: bullish bars when price is above both HEMAs, bearish when below, and neutral (gray) when indecisive.
█ FEATURES
Bullish and bearish bar coloring based on price and HEMA alignment.
Box plotting at each crossover (bullish or bearish) to create short-term decision zones.
Real-time test detection: price must cleanly test and bounce from box levels to be considered valid.
Multiple alert conditions: crossover alerts, test alerts, and trend continuation alerts.
█ USAGE
Use this indicator on any time frame and asset. Adjust HEMA lengths to match your trading style—shorter lengths for scalping or intraday, longer for swing trading. The shaded area between HEMAs helps visually define the current trend. Watch for crossovers: a bullish crossover plots a green support box just below price, and a bearish one plots a red resistance box just above. These zones act as short-term decision points. When price returns to test a box and confirms with strong rejection (e.g., closes above for bullish or below for bearish), a triangle symbol is plotted. These tests can signal strong trend continuation. For traders looking for clean entries, combining the crossover with a successful retest improves reliability. Alerts can be enabled for all key signals: trend shift, test confirmations, and continuation conditions, making it suitable for automated setups or discretionary traders tracking multiple charts.

Dynamic Momentum Bands | AlphaAlgosDynamic Momentum Bands | AlphaAlgos
Overview
The Dynamic Momentum Bands indicator is an advanced technical analysis tool that combines multiple analytical techniques to provide a comprehensive view of market momentum and trend dynamics. By integrating RSI (Relative Strength Index), volatility analysis, and adaptive moving averages, this indicator offers traders a nuanced perspective on market conditions.
Key Features
Adaptive band calculation based on price momentum
Integrated RSI-driven volatility scaling
Multiple moving average type options (EMA, SMA, VWMA)
Smooth, gradient-based band visualization
Optional price bar coloring for trend identification
Technical Methodology
The indicator employs a sophisticated approach to market analysis:
1. Momentum Calculation
Calculates RSI using a customizable length
Uses RSI to dynamically adjust band volatility
Scales band width based on distance from the 50 RSI level
2. Band Construction
Applies a selected moving average type to the price source
Calculates deviation using ATR (Average True Range)
Smooths band edges for improved visual clarity
Configuration Options
Core Settings:
Price Source: Choose the price data used for calculations
RSI Length: Customize the RSI calculation period (1-50)
Band Length: Adjust the moving average period (5-100)
Volatility Multiplier: Fine-tune band width
Band Type: Select between EMA, SMA, and VWMA
Visual Settings:
Bar Coloring: Toggle color-coded price bars
Gradient-based band visualization
Smooth color transitions for trend representation
Trend Identification
The indicator provides trend insights through:
Color-coded bands (blue for bullish, pink for bearish)
Smooth gradient visualization
Optional price bar coloring
Trading Applications
Trend Following:
- Use band position relative to price as trend indicator
- Identify momentum shifts through color changes
- Utilize gradient zones for trend strength assessment
Volatility Analysis:
Observe band width changes
Detect potential breakout or consolidation periods
Use RSI-driven volatility scaling for market context
Best Practices
Adjust RSI length to match trading timeframe
Experiment with different moving average types
Use in conjunction with other technical indicators
Consider volatility multiplier for different market conditions
This indicator is provided for informational purposes only. Always use proper risk management when trading. Past performance is not indicative of future results. Not financial Advise

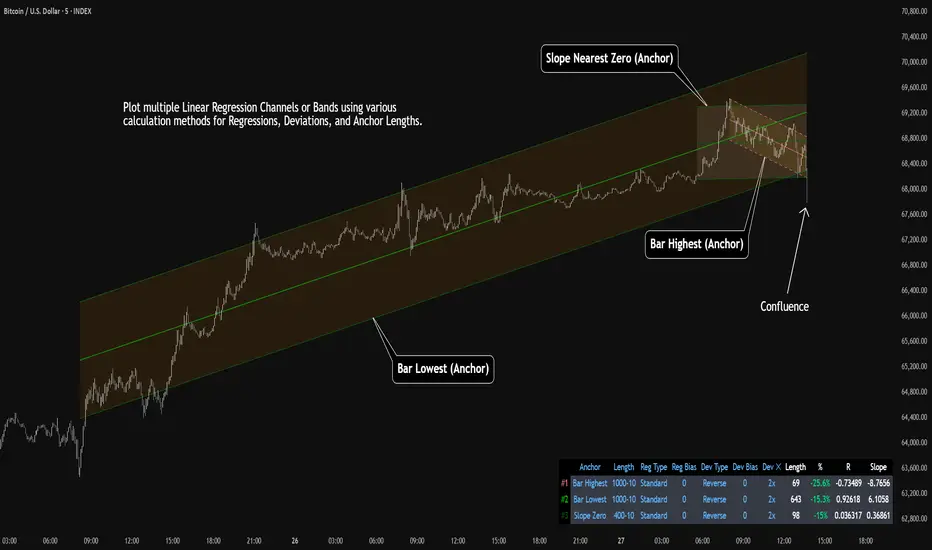
Multi-Anchored Linear Regression Channels [TANHEF]█ Overview:
The 'Multi-Anchored Linear Regression Channels ' plots multiple dynamic regression channels (or bands) with unique selectable calculation types for both regression and deviation. It leverages a variety of techniques, customizable anchor sources to determine regression lengths, and user-defined criteria to highlight potential opportunities.
Before getting started, it's worth exploring all sections, but make sure to review the Setup & Configuration section in particular. It covers key parameters like anchor type, regression length, bias, and signal criteria—essential for aligning the tool with your trading strategy.
█ Key Features:
⯁ Multi-Regression Capability:
Plot up to three distinct regression channels and/or bands simultaneously, each with customizable anchor types to define their length.
⯁ Regression & Deviation Methods:
Regressions Types:
Standard: Uses ordinary least squares to compute a simple linear trend by averaging the data and deriving a slope and endpoints over the lookback period.
Ridge: Introduces L2 regularization to stabilize the slope by penalizing large coefficients, which helps mitigate multicollinearity in the data.
Lasso: Uses L1 regularization through soft-thresholding to shrink less important coefficients, yielding a simpler model that highlights key trends.
Elastic Net: Combines L1 and L2 penalties to balance coefficient shrinkage and selection, producing a robust weighted slope that handles redundant predictors.
Huber: Implements the Huber loss with iteratively reweighted least squares (IRLS) and EMA-style weights to reduce the impact of outliers while estimating the slope.
Least Absolute Deviations (LAD): Reduces absolute errors using iteratively reweighted least squares (IRLS), yielding a slope less sensitive to outliers than squared-error methods.
Bayesian Linear: Merges prior beliefs with weighted data through Bayesian updating, balancing the prior slope with data evidence to derive a probabilistic trend.
Deviation Types:
Regressive Linear (Reverse): In reverse order (recent to oldest), compute weighted squared differences between the data and a line defined by a starting value and slope.
Progressive Linear (Forward): In forward order (oldest to recent), compute weighted squared differences between the data and a line defined by a starting value and slope.
Balanced Linear: In forward order (oldest to newest), compute regression, then pair to source data in reverse order (newest to oldest) to compute weighted squared differences.
Mean Absolute: Compute weighted absolute differences between each data point and its regression line value, then aggregate them to yield an average deviation.
Median Absolute: Determine the weighted median of the absolute differences between each data point and its regression line value to capture the central tendency of deviations.
Percent: Compute deviation as a percentage of a base value by multiplying that base by the specified percentage, yielding symmetric positive and negative deviations.
Fitted: Compare a regression line with high and low series values by computing weighted differences to determine the maximum upward and downward deviations.
Average True Range: Iteratively compute the weighted average of absolute differences between the data and its regression line to yield an ATR-style deviation measure.
Bias:
Bias: Applies EMA or inverse-EMA style weighting to both Regression and/or Deviation, emphasizing either recent or older data.
⯁ Customizable Regression Length via Anchors:
Anchor Types:
Fixed: Length.
Bar-Based: Bar Highest/Lowest, Volume Highest/Lowest, Spread Highest/Lowest.
Correlation: R Zero, R Highest, R Lowest, R Absolute.
Slope: Slope Zero, Slope Highest, Slope Lowest, Slope Absolute.
Indicator-Based: Indicators Highest/Lowest (ADX, ATR, BBW, CCI, MACD, RSI, Stoch).
Time-Based: Time (Day, Week, Month, Quarter, Year, Decade, Custom).
Session-Based: Session (Tokyo, London, New York, Sydney, Custom).
Event-Based: Earnings, Dividends, Splits.
External: Input Source Highest/Lowest.
Length Selection:
Maximum: The highest allowed regression length (also fixed value of “Length” anchor).
Minimum: The shortest allowed length, ensuring enough bars for a valid regression.
Step: The sampling interval (e.g., 1 checks every bar, 2 checks every other bar, etc.). Increasing the step reduces the loading time, most applicable to “Slope” and “R” anchors.
Adaptive lookback:
Adaptive Lookback: Enable to display regression regardless of too few historical bars.
⯁ Selecting Bias:
Bias applies separately to regression and deviation.
Positive values emphasize recent data (EMA-style), negative invert, and near-zero maintains balance. (e.g., a length 100, bias +1 gives the newest price ~7× more weight than the oldest).
It's best to apply bias to both (regression and deviation) or just the deviation. Biasing only regression may distort deviation visually, while biasing both keeps their relationship intuitive. Using bias only for deviation scales it without altering regression, offering unique analysis.
⯁ Scale Awareness:
Supports linear and logarithmic price scaling, the regression and deviations adjust accordingly.
⯁ Signal Generation & Alerts:
Customizable entry/exit signals and alerts, detailed in the dedicated section below.
⯁ Visual Enhancements & Real-World Examples:
Optional on-chart table display summarizing regression input criteria (display type, anchor type, source, regression type, regression bias, deviation type, deviation bias, deviation multiplier) and key calculated metrics (regression length, slope, Pearson’s R, percentage position within deviations, etc.) for quick reference.
█ Understanding R (Pearson Correlation Coefficient):
Pearson’s R gauges data alignment to a straight-line trend within the regression length:
Range: R varies between –1 and +1.
R = +1 → Perfect positive correlation (strong uptrend).
R = 0 → No linear relationship detected.
R = –1 → Perfect negative correlation (strong downtrend).
This script uses Pearson’s R as an anchor, adjusting regression length to target specific R traits. Strong R (±1) follows the regression channel, while weak R (0) shows inconsistency.
█ Understanding the Slope:
The slope is the direction and rate at which the regression line rises or falls per bar:
Positive Slope (>0): Uptrend – Steeper means faster increase.
Negative Slope (<0): Downtrend – Steeper means sharper drop.
Zero or Near-Zero Slope: Sideways – Indicating range-bound conditions.
This script uses highest and lowest slope as an anchor, where extremes highlight strong moves and trend lines, while values near zero indicate sideways action and possible support/resistance.
█ Setup & Configuration:
Whether you’re new to this script or want to quickly adjust all critical parameters, the panel below shows the main settings available. You can customize everything from the anchor type and maximum length to the bias, signal conditions, and more.
Scale (select Log Scale for logarithmic, otherwise linear scale).
Display (regression channel and/or bands).
Anchor (how regression length is determined).
Length (control bars analyzed):
• Max – Upper limit.
• Min – Prevents regression from becoming too short.
• Step – Controls scanning precision; increasing Step reduces load time.
Regression:
• Type – Calculation method.
• Bias – EMA-style emphasis (>0=new bars weighted more; <0=old bars weighted more).
Deviation:
• Type – Calculation method.
• Bias – EMA-style emphasis (>0=new bars weighted more; <0=old bars weighted more).
• Multiplier - Adjusts Upper and Lower Deviation.
Signal Criteria:
• % (Price vs Deviation) – (0% = lower deviation, 50% = regression, 100% = upper deviation).
• R – (0 = no correlation, ±1 = perfect correlation; >0 = +slope, <0 = -slope).
Table (analyze table of input settings, calculated results, and signal criteria).
Adaptive Lookback (display regression while too few historical bars).
Multiple Regressions (steps 2 to 7 apply to #1, #2, and #3 regressions).
█ Signal Generation & Alerts:
The script offers customizable entry and exit signals with flexible criteria and visual cues (background color, dots, or triangles). Alerts can also be triggered for these opportunities.
Percent Direction Criteria:
(0% = lower deviation, 50% = regression line, 100% = upper deviation)
Above %: Triggers if price is above a specified percent of the deviation channel.
Below %: Triggers if price is below a specified percent of the deviation channel.
(Blank): Ignores the percent‐based condition.
Pearson's R (Correlation) Direction Criteria:
(0 = no correlation, ±1 = perfect correlation; >0 = positive slope, <0 = negative slope)
Above R / Below R: Compares the correlation to a threshold.
Above│R│ / Below│R│: Uses absolute correlation to focus on strength, ignoring direction.
Zero to R: Checks if R is in the 0-to-threshold range.
(Blank): Ignores correlation-based conditions.
█ User Tips & Best Practices:
Choose an anchor type that suits your strategy, “Bar Highest/Lowest” automatically spots commonly used regression zones, while “│R│ Highest” targets strong linear trends.
Consider enabling or disabling the Adaptive Lookback feature to ensure you always have a plotted regression if your chart doesn’t meet the maximum-length requirement.
Use a small Step size (1) unless relying on R-correlation or slope-based anchors as the are time-consuming to calculate. Larger steps speed up calculations but reduce precision.
Fine-tune settings such as lookback periods, regression bias, and deviation multipliers, or trend strength. Small adjustments can significantly affect how channels and signals behave.
To reduce loading time , show only channels (not bands) and disable signals, this limits calculations to the last bar and supports more extreme criteria.
Use the table display to monitor anchor type, calculated length, slope, R value, and percent location at a glance—especially if you have multiple regressions visible simultaneously.
█ Conclusion:
With its blend of advanced regression techniques, flexible deviation options, and a wide range of anchor types, this indicator offers a highly adaptable linear regression channeling system. Whether you're anchoring to time, price extremes, correlation, slope, or external events, the tool can be shaped to fit a variety of strategies. Combined with customizable signals and alerts, it may help highlight areas of confluence and support a more structured approach to identifying potential opportunities.
LinearRegressionLibrary "LinearRegression"
Calculates a variety of linear regression and deviation types, with optional emphasis weighting. Additionally, multiple of slope and Pearson’s R calculations.
calcSlope(_src, _len, _condition)
Calculates the slope of a linear regression over the specified length.
Parameters:
_src (float) : (float) The source data.
_len (int) : (int) The length of the lookback period for the linear regression.
_condition (bool) : (bool) Flag to enable calculation. Set to true to calculate on every bar; otherwise, set to barstate.islast for efficiency.
Returns: (float) The slope of the linear regression.
calcReg(_src, _len, _condition)
Calculates a basic linear regression, returning y1, y2, slope, and average.
Parameters:
_src (float) : (float) The source data series.
_len (int) : (int) The length of the lookback period.
_condition (bool) : (bool) Flag to enable calculation (true = calculate).
Returns: (float ) An array of 4 values: .
calcRegStandard(_src, _len, _emphasis, _condition)
Calculates an Standard linear regression with optional emphasis.
Parameters:
_src (float) : (series float) The source data series.
_len (int) : (int) The length of the lookback period.
_emphasis (float) : (float) The emphasis factor: 0 for equal weight; >0 emphasizes recent bars; <0 emphasizes older bars.
_condition (bool) : (bool) Flag to enable calculation (true = calculate).
Returns: (float ) .
calcRegRidge(_src, _len, lambda, _emphasis, _condition)
Calculates a ridge regression with optional emphasis.
Parameters:
_src (float) : (float) The source data series.
_len (int) : (int) The length of the lookback period.
lambda (float) : (float) The ridge regularization parameter.
_emphasis (float) : (float) The emphasis factor: 0 for equal weight; >0 emphasizes recent bars; <0 emphasizes older bars.
_condition (bool) : (bool) Flag to enable calculation (true = calculate).
Returns: (float ) .
calcRegLasso(_src, _len, lambda, _emphasis, _condition)
Calculates a Lasso regression with optional emphasis.
Parameters:
_src (float) : (float) The source data series.
_len (int) : (int) The length of the lookback period.
lambda (float) : (float) The Lasso regularization parameter.
_emphasis (float) : (float) The emphasis factor: 0 for equal weight; >0 emphasizes recent bars; <0 emphasizes older bars.
_condition (bool) : (bool) Flag to enable calculation (true = calculate).
Returns: (float ) .
calcElasticNetLinReg(_src, _len, lambda1, lambda2, _emphasis, _condition)
Calculates an Elastic Net regression with optional emphasis.
Parameters:
_src (float) : (float) The source data series.
_len (int) : (int) The length of the lookback period.
lambda1 (float) : (float) L1 regularization parameter (Lasso).
lambda2 (float) : (float) L2 regularization parameter (Ridge).
_emphasis (float) : (float) Emphasis factor: 0 for equal weight; >0 emphasizes recent bars; <0 emphasizes older bars.
_condition (bool) : (bool) Flag to enable calculation (true = calculate).
Returns: (float ) .
calcRegHuber(_src, _len, delta, iterations, _emphasis, _condition)
Calculates a Huber regression using Iteratively Reweighted Least Squares (IRLS).
Parameters:
_src (float) : (float) The source data series.
_len (int) : (int) The length of the lookback period.
delta (float) : (float) Huber threshold parameter.
iterations (int) : (int) Number of IRLS iterations.
_emphasis (float) : (float) Emphasis factor: 0 for equal weight; >0 emphasizes recent bars; <0 emphasizes older bars.
_condition (bool) : (bool) Flag to enable calculation (true = calculate).
Returns: (float ) .
calcRegLAD(_src, _len, iterations, _emphasis, _condition)
Calculates a Least Absolute Deviations (LAD) regression via IRLS.
Parameters:
_src (float) : (float) The source data series.
_len (int) : (int) The length of the lookback period.
iterations (int) : (int) Number of IRLS iterations for LAD.
_emphasis (float) : (float) Emphasis factor: 0 for equal weight; >0 emphasizes recent bars; <0 emphasizes older bars.
_condition (bool) : (bool) Flag to enable calculation (true = calculate).
Returns: (float ) .
calcRegBayesian(_src, _len, priorMean, priorSpan, sigma, _emphasis, _condition)
Calculates a Bayesian linear regression with optional emphasis.
Parameters:
_src (float) : (float) The source data series.
_len (int) : (int) The length of the lookback period.
priorMean (float) : (float) The prior mean for the slope.
priorSpan (float) : (float) The prior variance (or span) for the slope.
sigma (float) : (float) The assumed standard deviation of residuals.
_emphasis (float) : (float) Emphasis factor: 0 for equal weight; >0 emphasizes recent bars; <0 emphasizes older bars.
_condition (bool) : (bool) Flag to enable calculation (true = calculate).
Returns: (float ) .
calcRFromLinReg(_src, _len, _slope, _average, _y1, _condition)
Calculates the Pearson correlation coefficient (R) based on linear regression parameters.
Parameters:
_src (float) : (float) The source data.
_len (int) : (int) The length of the lookback period.
_slope (float) : (float) The slope of the linear regression.
_average (float) : (float) The average value of the source data series.
_y1 (float) : (float) The starting point (y-intercept of the oldest bar) for the linear regression.
_condition (bool) : (bool) Flag to enable calculation. Set to true to calculate on every bar; otherwise, set to barstate.islast for efficiency.
Returns: (float) The Pearson correlation coefficient (R) adjusted for the direction of the slope.
calcRFromSource(_src, _len, _condition)
Calculates the correlation coefficient (R) using a specified length and source data.
Parameters:
_src (float) : (float) The source data.
_len (int) : (int) The length of the lookback period.
_condition (bool) : (bool) Flag to enable calculation. Set to true to calculate on every bar; otherwise, set to barstate.islast for efficiency.
Returns: (float) The correlation coefficient (R).
calcSlopeLengthZero(_src, _len, _minLen, _step, _condition)
Identifies the length at which the slope is flattest (closest to zero).
Parameters:
_src (float) : (float) The source data.
_len (int) : (int) The maximum lookback length to consider (minimum of 2).
_minLen (int) : (int) The minimum length to start from (cannot exceed the max length).
_step (int) : (int) The increment step for lengths.
_condition (bool) : (bool) Flag to enable calculation. Set to true to calculate on every bar; otherwise, set to barstate.islast.
Returns: (int) The length at which the slope is flattest.
calcSlopeLengthHighest(_src, _len, _minLen, _step, _condition)
Identifies the length at which the slope is highest.
Parameters:
_src (float) : (float) The source data.
_len (int) : (int) The maximum lookback length (minimum of 2).
_minLen (int) : (int) The minimum length to start from.
_step (int) : (int) The step for incrementing lengths.
_condition (bool) : (bool) Flag to enable calculation. Set to true to calculate on every bar; otherwise, set to barstate.islast.
Returns: (int) The length at which the slope is highest.
calcSlopeLengthLowest(_src, _len, _minLen, _step, _condition)
Identifies the length at which the slope is lowest.
Parameters:
_src (float) : (float) The source data.
_len (int) : (int) The maximum lookback length (minimum of 2).
_minLen (int) : (int) The minimum length to start from.
_step (int) : (int) The step for incrementing lengths.
_condition (bool) : (bool) Flag to enable calculation. Set to true to calculate on every bar; otherwise, set to barstate.islast.
Returns: (int) The length at which the slope is lowest.
calcSlopeLengthAbsolute(_src, _len, _minLen, _step, _condition)
Identifies the length at which the absolute slope value is highest.
Parameters:
_src (float) : (float) The source data.
_len (int) : (int) The maximum lookback length (minimum of 2).
_minLen (int) : (int) The minimum length to start from.
_step (int) : (int) The step for incrementing lengths.
_condition (bool) : (bool) Flag to enable calculation. Set to true to calculate on every bar; otherwise, set to barstate.islast.
Returns: (int) The length at which the absolute slope value is highest.
calcRLengthZero(_src, _len, _minLen, _step, _condition)
Identifies the length with the lowest absolute R value.
Parameters:
_src (float) : (float) The source data.
_len (int) : (int) The maximum lookback length (minimum of 2).
_minLen (int) : (int) The minimum length to start from.
_step (int) : (int) The step for incrementing lengths.
_condition (bool) : (bool) Flag to enable calculation. Set to true to calculate on every bar; otherwise, set to barstate.islast.
Returns: (int) The length with the lowest absolute R value.
calcRLengthHighest(_src, _len, _minLen, _step, _condition)
Identifies the length with the highest R value.
Parameters:
_src (float) : (float) The source data.
_len (int) : (int) The maximum lookback length (minimum of 2).
_minLen (int) : (int) The minimum length to start from.
_step (int) : (int) The step for incrementing lengths.
_condition (bool) : (bool) Flag to enable calculation. Set to true to calculate on every bar; otherwise, set to barstate.islast.
Returns: (int) The length with the highest R value.
calcRLengthLowest(_src, _len, _minLen, _step, _condition)
Identifies the length with the lowest R value.
Parameters:
_src (float) : (float) The source data.
_len (int) : (int) The maximum lookback length (minimum of 2).
_minLen (int) : (int) The minimum length to start from.
_step (int) : (int) The step for incrementing lengths.
_condition (bool) : (bool) Flag to enable calculation. Set to true to calculate on every bar; otherwise, set to barstate.islast.
Returns: (int) The length with the lowest R value.
calcRLengthAbsolute(_src, _len, _minLen, _step, _condition)
Identifies the length with the highest absolute R value.
Parameters:
_src (float) : (float) The source data.
_len (int) : (int) The maximum lookback length (minimum of 2).
_minLen (int) : (int) The minimum length to start from.
_step (int) : (int) The step for incrementing lengths.
_condition (bool) : (bool) Flag to enable calculation. Set to true to calculate on every bar; otherwise, set to barstate.islast.
Returns: (int) The length with the highest absolute R value.
calcDevReverse(_src, _len, _slope, _y1, _inputDev, _emphasis, _condition)
Calculates the regressive linear deviation in reverse order, with optional emphasis on recent data.
Parameters:
_src (float) : (float) The source data.
_len (int) : (int) The length of the lookback period.
_slope (float) : (float) The slope of the linear regression.
_y1 (float) : (float) The y-intercept (oldest bar) of the linear regression.
_inputDev (float) : (float) The input deviation multiplier.
_emphasis (float) : (float) Emphasis factor: 0 for equal weight; >0 emphasizes recent bars; <0 emphasizes older bars.
_condition (bool) : (bool) Flag to enable calculation (true = calculate).
Returns: A 2-element tuple: .
calcDevForward(_src, _len, _slope, _y1, _inputDev, _emphasis, _condition)
Calculates the progressive linear deviation in forward order (oldest to most recent bar), with optional emphasis.
Parameters:
_src (float) : (float) The source data array, where _src is oldest and _src is most recent.
_len (int) : (int) The length of the lookback period.
_slope (float) : (float) The slope of the linear regression.
_y1 (float) : (float) The y-intercept of the linear regression (value at the most recent bar, adjusted by slope).
_inputDev (float) : (float) The input deviation multiplier.
_emphasis (float) : (float) Emphasis factor: 0 for equal weight; >0 emphasizes recent bars; <0 emphasizes older bars.
_condition (bool) : (bool) Flag to enable calculation (true = calculate).
Returns: A 2-element tuple: .
calcDevBalanced(_src, _len, _slope, _y1, _inputDev, _emphasis, _condition)
Calculates the balanced linear deviation with optional emphasis on recent or older data.
Parameters:
_src (float) : (float) Source data array, where _src is the most recent and _src is the oldest.
_len (int) : (int) The length of the lookback period.
_slope (float) : (float) The slope of the linear regression.
_y1 (float) : (float) The y-intercept of the linear regression (value at the oldest bar).
_inputDev (float) : (float) The input deviation multiplier.
_emphasis (float) : (float) Emphasis factor: 0 for equal weight; >0 emphasizes recent bars; <0 emphasizes older bars.
_condition (bool) : (bool) Flag to enable calculation (true = calculate).
Returns: A 2-element tuple: .
calcDevMean(_src, _len, _slope, _y1, _inputDev, _emphasis, _condition)
Calculates the mean absolute deviation from a forward-applied linear trend (oldest to most recent), with optional emphasis.
Parameters:
_src (float) : (float) The source data array, where _src is the most recent and _src is the oldest.
_len (int) : (int) The length of the lookback period.
_slope (float) : (float) The slope of the linear regression.
_y1 (float) : (float) The y-intercept (oldest bar) of the linear regression.
_inputDev (float) : (float) The input deviation multiplier.
_emphasis (float) : (float) Emphasis factor: 0 for equal weight; >0 emphasizes recent bars; <0 emphasizes older bars.
_condition (bool) : (bool) Flag to enable calculation (true = calculate).
Returns: A 2-element tuple: .
calcDevMedian(_src, _len, _slope, _y1, _inputDev, _emphasis, _condition)
Calculates the median absolute deviation with optional emphasis on recent data.
Parameters:
_src (float) : (float) The source data array (index 0 = oldest, index _len - 1 = most recent).
_len (int) : (int) The length of the lookback period.
_slope (float) : (float) The slope of the linear regression.
_y1 (float) : (float) The y-intercept (oldest bar) of the linear regression.
_inputDev (float) : (float) The deviation multiplier.
_emphasis (float) : (float) Emphasis factor: 0 for equal weight; >0 emphasizes recent bars; <0 emphasizes older bars.
_condition (bool) : (bool) Flag to enable calculation (true = calculate).
Returns:
calcDevPercent(_y1, _inputDev, _condition)
Calculates the percent deviation from a given value and a specified percentage.
Parameters:
_y1 (float) : (float) The base value from which to calculate deviation.
_inputDev (float) : (float) The deviation percentage.
_condition (bool) : (bool) Flag to enable calculation (true = calculate).
Returns: A 2-element tuple: .
calcDevFitted(_len, _slope, _y1, _emphasis, _condition)
Calculates the weighted fitted deviation based on high and low series data, showing max deviation, with optional emphasis.
Parameters:
_len (int) : (int) The length of the lookback period.
_slope (float) : (float) The slope of the linear regression.
_y1 (float) : (float) The Y-intercept (oldest bar) of the linear regression.
_emphasis (float) : (float) Emphasis factor: 0 for equal weight; >0 emphasizes recent bars; <0 emphasizes older bars.
_condition (bool) : (bool) Flag to enable calculation (true = calculate).
Returns: A 2-element tuple: .
calcDevATR(_src, _len, _slope, _y1, _inputDev, _emphasis, _condition)
Calculates an ATR-style deviation with optional emphasis on recent data.
Parameters:
_src (float) : (float) The source data (typically close).
_len (int) : (int) The length of the lookback period.
_slope (float) : (float) The slope of the linear regression.
_y1 (float) : (float) The Y-intercept (oldest bar) of the linear regression.
_inputDev (float) : (float) The input deviation multiplier.
_emphasis (float) : (float) Emphasis factor: 0 for equal weight; >0 emphasizes recent bars; <0 emphasizes older bars.
_condition (bool) : (bool) Flag to enable calculation (true = calculate).
Returns: A 2-element tuple: .
calcPricePositionPercent(_top, _bot, _src)
Calculates the percent position of a price within a linear regression channel. Top=100%, Bottom=0%.
Parameters:
_top (float) : (float) The top (positive) deviation, corresponding to 100%.
_bot (float) : (float) The bottom (negative) deviation, corresponding to 0%.
_src (float) : (float) The source price.
Returns: (float) The percent position within the channel.
plotLinReg(_len, _y1, _y2, _slope, _devTop, _devBot, _scaleTypeLog, _lineWidth, _extendLines, _channelStyle, _colorFill, _colUpLine, _colDnLine, _colUpFill, _colDnFill)
Plots the linear regression line and its deviations, with configurable styles and fill.
Parameters:
_len (int) : (int) The lookback period for the linear regression.
_y1 (float) : (float) The starting y-value of the regression line.
_y2 (float) : (float) The ending y-value of the regression line.
_slope (float) : (float) The slope of the regression line (used to determine line color).
_devTop (float) : (float) The top deviation to add to the line.
_devBot (float) : (float) The bottom deviation to subtract from the line.
_scaleTypeLog (bool) : (bool) Use a log scale if true; otherwise, linear scale.
_lineWidth (int) : (int) The width of the plotted lines.
_extendLines (string) : (string) How lines should extend (none, left, right, both).
_channelStyle (string) : (string) The style of the channel lines (solid, dashed, dotted).
_colorFill (bool) : (bool) Whether to fill the space between the top and bottom deviation lines.
_colUpLine (color) : (color) Line color when slope is positive.
_colDnLine (color) : (color) Line color when slope is negative.
_colUpFill (color) : (color) Fill color when slope is positive.
_colDnFill (color) : (color) Fill color when slope is negative.

Nef33-Volume Footprint ApproximationDescription of the "Volume Footprint Approximation" Indicator
Purpose
The "Volume Footprint Approximation" indicator is a tool designed to assist traders in analyzing market volume dynamics and anticipating potential trend changes in price. It is inspired by the concept of a volume footprint chart, which visualizes the distribution of trading volume across different price levels. However, since TradingView does not provide detailed intrabar data for all users, this indicator approximates the behavior of a footprint chart by using available volume and price data (open, close, volume) to classify volume as buy or sell, calculate volume delta, detect imbalances, and generate trend change signals.
The indicator is particularly useful for identifying areas of high buying or selling activity, imbalances between supply and demand, delta divergences, and potential reversal points in the market. It provides specific signals for bullish and bearish trend changes, making it suitable for traders looking to trade reversals or confirm trends.
How It Works
The indicator uses volume and price data from each candlestick to perform the following calculations:
Volume Classification:
Classifies the volume of each candlestick as "buy" or "sell" based on price movement:
If the closing price is higher than the opening price (close > open), the volume is classified as "buy."
If the closing price is lower than the opening price (close < open), the volume is classified as "sell."
If the closing price equals the opening price (close == open), it compares with the previous close to determine the direction:
If the current close is higher than the previous close, it is classified as "buy."
If the current close is lower than the previous close, it is classified as "sell."
If the current close equals the previous close, the classification from the previous bar is used.
Delta Calculation:
Calculates the volume delta as the difference between buy volume and sell volume (buyVolume - sellVolume).
A positive delta indicates more buy volume; a negative delta indicates more sell volume.
Imbalance Detection:
Identifies imbalances between buy and sell volume:
A buy imbalance occurs when buy volume exceeds sell volume by a defined percentage (default is 300%).
A sell imbalance occurs when sell volume exceeds buy volume by the same percentage.
Delta Divergence Detection:
Positive Delta Divergence: Occurs when the price is falling (for at least 2 bars) but the delta is increasing or becomes positive, indicating that buyers are entering despite the price decline.
Negative Delta Divergence: Occurs when the price is rising (for at least 2 bars) but the delta is decreasing or becomes negative, indicating that sellers are entering despite the price increase.
Trend Change Signals:
Bullish Signal (trendChangeBullish): Generated when the following conditions are met:
There is a positive delta divergence.
The delta has moved from a negative value (e.g., -500) to a positive value (e.g., +200) over the last 3 bars.
There is a buy imbalance.
The price is near a historical support level (approximated as the lowest low of the last 50 bars).
Bearish Signal (trendChangeBearish): Generated when the following conditions are met:
There is a negative delta divergence.
The delta has moved from a positive value (e.g., +500) to a negative value (e.g., -200) over the last 3 bars.
There is a sell imbalance.
The price is near a historical resistance level (approximated as the highest high of the last 50 bars).
Visual Elements
The indicator is displayed in a separate panel below the price chart (overlay=false) and includes the following elements:
Volume Histograms:
Buy Volume: Represented by a green histogram. Shows the volume classified as "buy."
Sell Volume: Represented by a red histogram. Shows the volume classified as "sell."
Note: The histograms overlap, and the last plotted histogram (red) takes visual precedence, meaning the sell volume may cover the buy volume if it is larger.
Delta Line:
Delta Volume: Represented by a blue line. Shows the difference between buy and sell volume.
A line above zero indicates more buy volume; a line below zero indicates more sell volume.
A dashed gray horizontal line marks the zero level for easier interpretation.
Imbalance Backgrounds:
Buy Imbalance: Light green background when buy volume exceeds sell volume by the defined percentage.
Sell Imbalance: Light red background when sell volume exceeds buy volume by the defined percentage.
Divergence Backgrounds:
Positive Delta Divergence: Lime green background when a positive delta divergence is detected.
Negative Delta Divergence: Fuchsia background when a negative delta divergence is detected.
Trend Change Signals:
Bullish Signal: Green label with the text "Bullish Trend Change" when the conditions for a bullish trend change are met.
Bearish Signal: Red label with the text "Bearish Trend Change" when the conditions for a bearish trend change are met.
Information Labels:
Below each bar, a label displays:
Total Vol: The total volume of the bar.
Delta: The delta volume value.
Alerts
The indicator generates the following alerts:
Positive Delta Divergence: "Positive Delta Divergence Detected! Price is falling, but delta is increasing."
Negative Delta Divergence: "Negative Delta Divergence Detected! Price is rising, but delta is decreasing."
Bullish Trend Change Signal: "Bullish Trend Change Signal! Positive Delta Divergence, Delta Rise, Buy Imbalance, and Near Support."
Bearish Trend Change Signal: "Bearish Trend Change Signal! Negative Delta Divergence, Delta Drop, Sell Imbalance, and Near Resistance."
These alerts can be configured in TradingView to receive real-time notifications.
Adjustable Parameters
The indicator allows customization of the following parameters:
Imbalance Threshold (%): The percentage required to detect an imbalance between buy and sell volume (default is 300%).
Lookback Period for Divergence: Number of bars to look back for detecting price and delta trends (default is 2 bars).
Support/Resistance Lookback Period: Number of bars to look back for identifying historical support and resistance levels (default is 50 bars).
Delta High Threshold (Bearish): Minimum delta value 2 bars ago for the bearish signal (default is +500).
Delta Low Threshold (Bearish): Maximum delta value in the current bar for the bearish signal (default is -200).
Delta Low Threshold (Bullish): Maximum delta value 2 bars ago for the bullish signal (default is -500).
Delta High Threshold (Bullish): Minimum delta value in the current bar for the bullish signal (default is +200).
Practical Use
The indicator is useful for the following purposes:
Identifying Trend Changes:
The trend change signals (trendChangeBullish and trendChangeBearish) indicate potential price reversals. For example, a bullish signal near a support level may be an opportunity to enter a long position.
Detecting Divergences:
Delta divergences (positive and negative) can anticipate trend changes by showing a disagreement between price movement and underlying buying/selling pressure.
Finding Key Levels:
Imbalances (green and red backgrounds) often coincide with support and resistance levels, helping to identify areas where the market might react.
Confirming Trends:
A consistently positive delta in an uptrend or a negative delta in a downtrend can confirm the strength of the trend.
Identifying Failed Auctions:
Although not detected automatically, you can manually identify failed auctions by observing a price move to new highs/lows with decreasing volume in the direction of the move.
Limitations
Intrabar Data: It does not use detailed intrabar data, making it less precise than a native footprint chart.
Approximations: Volume classification and support/resistance detection are approximations, which may lead to false signals.
Volume Dependency: It requires reliable volume data, so it may be less effective on assets with inaccurate volume data (e.g., some forex pairs).
False Signals: Divergences and imbalances do not always indicate a trend change, especially in strongly trending markets.
Recommendations
Combine with Other Indicators: Use tools like RSI, MACD, support/resistance levels, or candlestick patterns to confirm signals.
Trade on Higher Timeframes: Signals are more reliable on higher timeframes like 1-hour or 4-hour charts.
Perform Backtesting: Evaluate the indicator's accuracy on historical data to adjust parameters and improve effectiveness.
Adjust Parameters: Modify thresholds (e.g., imbalanceThreshold or supportResistanceLookback) based on the asset and timeframe you are trading.
Conclusion
The "Volume Footprint Approximation" indicator is a powerful tool for analyzing volume dynamics and anticipating price trend changes. By classifying volume, calculating delta, detecting imbalances and divergences, and generating trend change signals, it provides traders with valuable insights into market buying and selling pressure. While it has limitations due to the lack of intrabar data, it can be highly effective when used in combination with other technical analysis tools and on assets with reliable volume data.
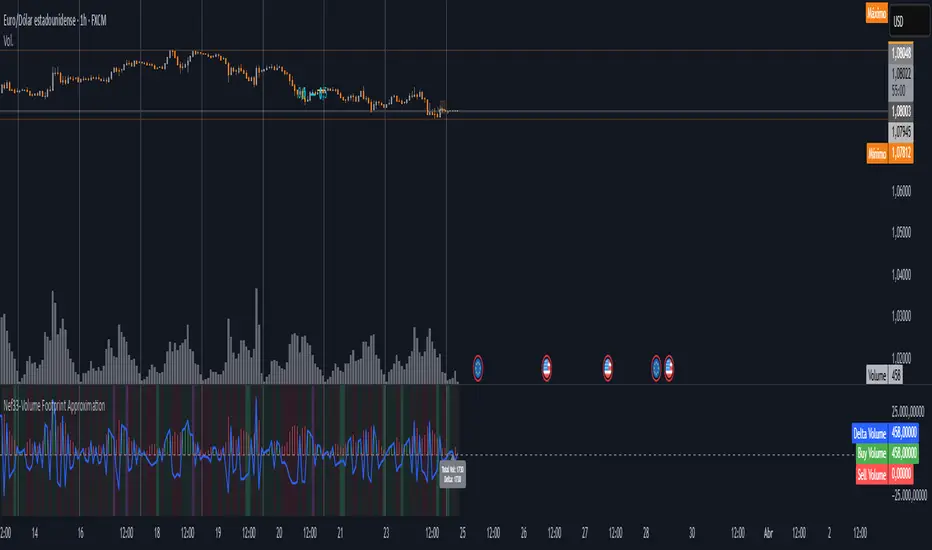
Forexsom MA Crossover SignalsA Trend-Following Trading Indicator for TradingView
Overview
This indicator plots two moving averages (MA) on your chart and generates visual signals when they cross, helping traders identify potential trend reversals. It is designed to be simple yet effective for both beginners and experienced traders.
Key Features
✅ Dual Moving Averages – Plots a Fast MA (default: 9-period) and a Slow MA (default: 21-period)
✅ Customizable MA Types – Choose between EMA (Exponential Moving Average) or SMA (Simple Moving Average)
✅ Clear Buy/Sell Signals – Displays "BUY" (green label) when the Fast MA crosses above the Slow MA and "SELL" (red label) when it crosses below
✅ Alerts – Get notified when new signals appear (compatible with TradingView alerts)
✅ Clean Visuals – Easy-to-read moving averages with adjustable colors
How It Works
Bullish Signal (BUY) → Fast MA crosses above Slow MA (suggests uptrend)
Bearish Signal (SELL) → Fast MA crosses below Slow MA (suggests downtrend)
Best Used For
✔ Trend-following strategies (swing trading, day trading)
✔ Confirming trend reversals
✔ Filtering trade entries in combination with other indicators
Customization Options
Adjust Fast & Slow MA lengths
Switch between EMA or SMA for smoother or more responsive signals
Why Use This Indicator?
Simple & Effective – No clutter, just clear signals
Works on All Timeframes – From scalping (1M, 5M) to long-term trading (4H, Daily)
Alerts for Real-Time Trading – Never miss a signal
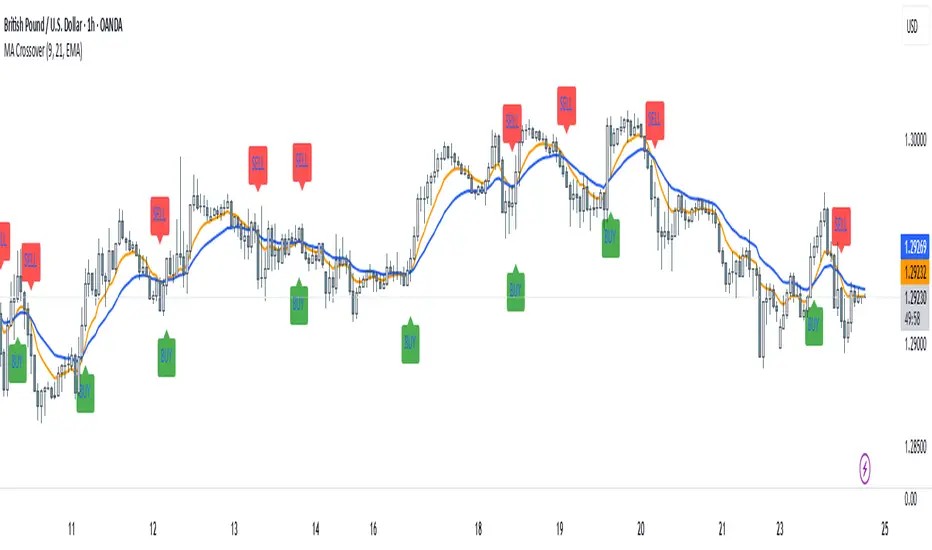
Overlay Hourly Candle [odnac] * This script overlays 1-hour candlestick representations on the chart.
* It captures the open, close, high, and low prices for each hourly period.
* The script dynamically updates as new hourly candles form and adjusts the
* box and wick positions accordingly.
*
* Features:
* - Draws an hourly candle with body and wicks.
* - Colors bullish candles in green and bearish candles in red.
* - Updates dynamically as new hourly candles form.
* - Uses TradingView's box and line functions to represent candle structures.
*
* Usage:
* - Add the script to your TradingView chart as an overlay.
* - Observe how the hourly candles appear distinctly on any timeframe.

ICT Breakers (BOS / MSS - Market Structure) [ICTProTools]The Breakers (Market Structure) indicator is designed to help traders identify true breaker structures , a key concept in Inner Circle Trader (ICT) methodology. In market structure, Breakers represent powerful shifts where a key high or low is broken, leading to a reversal in market direction. Most tools misinterpret structure shifts, using internal structure , leading to fake breakouts. This tool solves that problem by filtering out false signals , providing clear & structured insights , all with multi-timeframe compatibility.
💎 Key Features
⚡️ Breakers in action
The indicator shows the structure following ICT instructions. A breaker is defined by two lines:
The first line confirms the previous trend (it could be interpreted as a BOS).
The second line highlights the moment price breaks structure (with candle body or wick based on your chosen settings), signaling a shift in trend direction (like an MSS).
Furthermore, it’s important to note that a breaker not only shows the structure, but also defines a potential Point of Interest (POI), an area where price may retrace before continuing its trend.
Here, we can observe two clear structure shifts.
On the far left, the market was in a bearish trend, illustrated by the first visible (dotted and red) line. Shortly after, the second (solid and green) line appears, showing a break that initiates a new bullish trend.
This upward movement continues, with the last confirmation marked by a top structure line. And finally, the structure is broken once again indicating a transition back into a bearish trend.
💪 Real Structure with True Highs / Lows
Unlike many indicators that detect internal breakouts , this tool follows ICT’s true market structure rules .
In a bearish trend , a bullish breaker is only confirmed when the high that created the low is broken , and conversely for a bullish scenario.
Fake breakouts are ignored, preventing misleading signals.
In the image above, the white breakout is correctly ignored by the indicator, as it doesn't align with ICT’s structural rules. That white high is simply part of the internal structure, not the true swing point. Instead, the green line highlights the key level that truly matters, the one whose rupture would have confirmed a real change in market structure.
🔔 Smart Alerts for Structure Updates
Stay one step ahead with customizable alerts designed to notify you instantly when market structure changes occur.
Get notified for BOS (Continuation) and / or MSS (Breaker) events.
Set alerts for bullish , bearish , or both directions.
Choose between once or repeated alerts , based on your strategy.
This feature allows traders to remain focused and reactive , even when monitoring multiple markets.
In the alert settings, select which structure shifts you want to be notified of. Whether you're a scalper or a swing trader, the alerts keep you connected to key moments without needing to constantly monitor the chart.
⏳ Multi-Timeframe Structure
All features of the indicator are fully compatible with higher timeframes .
Get a broader view of market structure without switching timeframes.
Monitor higher timeframe structures and receive alerts, all without leaving your analysis chart .
In this example, the market structure of the 30m timeframe is displayed while on a 5m chart, providing a clearer perspective.
✨ Customization & User Control
Make it yours! The indicator allows full customization:
Swing bars (to confirm high / low)
Select your mode for Breakers (MSS) , using the candle body only or body / wick
Line style (type, width, color)
Choice of displayed timeframe
Activate any alert , with the frequency you want
🎯 Conclusion
✅ Avoid false signals by focusing on true ICT Breakers
✅ Smart alerts to never miss a structural shift
✅ Multi-timeframe support for enhanced analysis
✅ Clean & professional design for an optimal trading experience

Correlation TableThis indicator displays a vertical table that shows the correlation between the asset currently loaded on the chart and up to 32 selected trading pairs. It offers the following features:
Chart-Based Correlation: Correlations are calculated based on the asset you have loaded in your chart, providing relevant insights for your current market focus.
Configurable Pairs: Choose from a list of 32 symbols (e.g., AUDUSD, EURUSD, GBPUSD, etc.) with individual checkboxes to include or exclude each pair in the correlation analysis.
Custom Correlation Length: Adjust the lookback period for the correlation calculation to suit your analysis needs.
Optional EMA Smoothing: Enable an Exponential Moving Average (EMA) on the price data, with a configurable EMA length, to smooth the series before calculating correlations.
Color-Coded Output: The table cells change color based on the correlation strength and direction—neutral, bullish (green), or bearish (red)—making it easy to interpret at a glance.
Clear Table Layout: The indicator outputs a neatly organized vertical table with headers for "Pair" and "Correlation," ensuring the information is displayed cleanly and is easy to understand.
Ideal for traders who want a quick visual overview of how different instruments correlate with their current asset, this tool supports informed multi-asset analysis
ITALIANO:
Questo indicatore visualizza una tabella verticale che mostra la correlazione tra l'asset attualmente caricato sul grafico e fino a 32 coppie di trading selezionate. Offre le seguenti funzionalità:
Correlazione basata sul grafico: le correlazioni vengono calcolate in base all'asset caricato nel grafico, fornendo informazioni pertinenti per il tuo attuale focus di mercato.
Coppie configurabili: scegli da un elenco di 32 simboli (ad esempio, AUDUSD, EURUSD, GBPUSD, ecc.) con caselle di controllo individuali per includere o escludere ciascuna coppia nell'analisi della correlazione.
Lunghezza di correlazione personalizzata: regola il periodo di lookback per il calcolo della correlazione in base alle tue esigenze di analisi.
Smoothing EMA opzionale: abilita una media mobile esponenziale (EMA) sui dati dei prezzi, con una lunghezza EMA configurabile, per smussare la serie prima di calcolare le correlazioni.
Output codificato a colori: le celle della tabella cambiano colore in base alla forza e alla direzione della correlazione, neutra, rialzista (verde) o ribassista (rosso), rendendola facile da interpretare a colpo d'occhio.
Clear Table Layout: l'indicatore genera una tabella verticale ordinatamente organizzata con intestazioni per "Coppia" e "Correlazione", assicurando che le informazioni siano visualizzate in modo chiaro e siano facili da comprendere.
Ideale per i trader che desiderano una rapida panoramica visiva di come diversi strumenti siano correlati con il loro asset corrente, questo strumento supporta un'analisi multi-asset informata

Stacked EMA Candle Colors - Enhanced📊 Stacked EMA Candle Colors – Trend Strength Visualizer
Description:
🚀 Overview:
The Stacked EMA Candle Colors – Trend Strength Visualizer is a simple yet powerful indicator that helps traders identify market trends using Exponential Moving Averages (EMAs). By dynamically coloring candles based on the strength and alignment of multiple EMAs, this tool makes it easier to spot bullish and bearish trends at a glance, without cluttering your chart with multiple EMA lines.
🔹 Key Features:
✅ Four Customizable EMA lengths (adjust in settings)
✅ Candles change color based on EMA stacking (adjustable)
✅ Four-part gradient-based strength visualization for momentum confirmation (adjustable)
✅ Works on all timeframes and asset classes
🎨 How It Works:
When shorter EMAs (e.g., 9, 21) are above longer EMAs (e.g., 50, 200), the trend is bullish, and candles turn green/lime based on momentum strength.
When shorter EMAs are below longer EMAs, the trend is bearish, and candles turn red/pink depending on trend intensity.
If no clear trend is detected, candles remain gray for neutrality.
📈 Ideal for:
✔️ Trend traders who want a clear visual representation of momentum
✔️ Scalpers, day traders, and swing traders looking for quick trend confirmation
✔️ Anyone who wants to enhance their chart readability
🔧 Customization:
Easily adjust the EMA periods in the settings menu to fit your preferred trading strategy!
🚀 Add this indicator to your TradingView chart and spot trends with confidence!
