Highest-Lowest Trend𝙃𝙄𝙂𝙃𝙀𝙎𝙏-𝙇𝙊𝙒𝙀𝙎𝙏 𝙏𝙍𝙀𝙉𝘿 𝙄𝙉𝘿𝙄𝘾𝘼𝙏𝙊𝙍
Overview:
The "Highest-Lowest Trend" indicator helps traders identify trends based on the highest and lowest values within a specified period. It provides visual cues to understand potential trend changes, making it a valuable tool for technical analysis.
Settings:
Length and Offset: Adjust the length and offset parameters to customize the sensitivity of the indicator.
Source: Determines whether to use the high and low prices or the closing price and others for calculations.
Visual Settings:
Bar Color: Enables or disables the coloring of bars based on the trend direction.
Up Color: Specifies the color for upward trends.
Down Color: Specifies the color for downward trends.
Indicator Calculation:
The indicator calculates the highest and lowest values within the defined length and offset.
The current trend is determined based on whether the closing price is above or below these values.
When the source crossed above highest indicator changes trend to upside and start to use lowest value and vice versa.
/// 𝙄𝙉𝘿𝙄𝘾𝘼𝙏𝙊𝙍 𝘾𝘼𝙇𝘾𝙐𝙇𝘼𝙏𝙄𝙊𝙉 ///
var series float hlt = 0.0
series float upper = ta.highest(Use_High_and_Low ? high : src, length)
series float lower = ta.lowest( Use_High_and_Low ? high : src, length)
hlt := src > upper ?
lower : src < lower ?
upper : nz(hlt)
Usage:
Trend Identification: Watch for price to be above Trend Indicator crosses for up trend and below for down trend.
Length and Offset: Adjust the length and offset parameters to customize the sensitivity of the indicator.
Color, color bars: Change color of trends and bars for your taste
Note:
Trading involves inherent risks, and it is essential to exercise caution and employ multiple tools and indicators for comprehensive analysis. While the "Highest-Lowest Trend" indicator provides valuable insights into potential trend changes, relying solely on one tool for trading decisions is not recommended. Market conditions can be dynamic, and using a combination of indicators can enhance your overall analysis, providing a more robust foundation for decision-making. Always consider the broader market context, risk management strategies, and other relevant factors before executing trades.
Trendanalyse

Williams %R + Keltner chanells - indicator (AS)1)INDICATOR ---This indicator is a combination of Keltner channels and Williams %R.
It measures trend using these two indicators.
When Williams %R is overbought(above upper line (default=-20)) and Keltner lower line is below price indicator shows uptrend (green).
When Williams %R is oversold(below lower line (default=-80)) and Keltner upper line is above price indicator shows downtrend (red) .
Can be turned into a strategy quickly.
2) CALCULATIONS:
Keltner basis is a choosen type of moving average and upper line is basis + (ATR*multiplier). Same with lower but minus instead of plus so basiss – (ATR*multiplier)
Second indicator
Williams %R reflects the level of the close relative to the highest high for the lookback period
3)PLS-HELP-----Looking for tips, ideas, sets of parameters, markets and timeframes, rules for strategy -------OVERALL -every advice you can have
4) SIGNALS-----buy signal is when price is above upper KC and Williams %R is above OVB(-20). Short is exactly the other way around
5) CUSTOMIZATION:
-%R-------LENGTH/SMOOTHING/TYPE SMOOTHING MA
-%R-------OVS/MID/OVB -(MID-no use for now)
-KC -------LENGTH/TYPE OF MAIN MA
-KC-------MULTIPLIER,ATR LENGTH
-OTHER--LENGTH/TYPE OF MA - (for signal filters, not used for now)
-OTHER--SOURCE -src of calculations
-OTHER--OVERLAY - plots %R values for debugging etc(ON by default)
6)WARNING - do not use this indicator on its own for trading
7)ENJOY

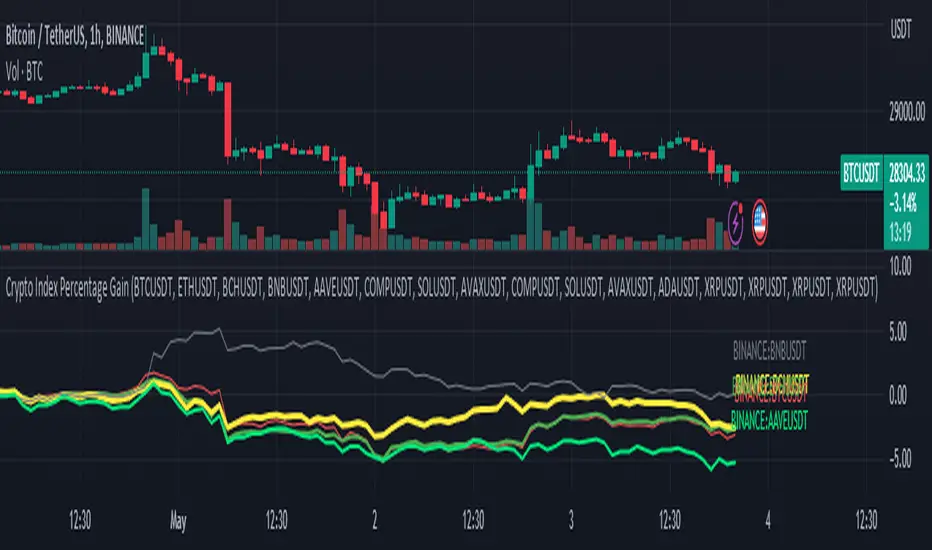
Crypto Index Percentage GainThis script calculates the percentage gain from the left-most visible candle for multiple cryptocurrency symbols and plots all of them on the chart.
Description:
The "Crypto Index Percentage Gain" indicator calculates the percentage gain from the left-most visible candle for a selection of cryptocurrency symbols. It utilizes the PineCoders VisibleChart library to access the high, low, close, and open prices of the visible chart range.
The user can customize the symbols to include in the calculation by enabling or disabling the corresponding input options. `_open` represents the open price, `_close` represents the close price, and `_gain` represents the calculated percentage gain. The formula used is (close - open) / open * 100 to calculate the percentage change between the open and close prices.
The calculated percentage gains for each symbol are plotted on the chart using different colors and line widths, providing an overview of the relative performance of the symbols.
Usage:
Add the "Crypto Index Percentage Gain" indicator to your trading view chart by searching it in indicator search bar or star it , it will show on your favourite indicators .
Configure the symbols and visibility options using the input parameters.
The indicator will calculate and display the percentage gain for each selected symbol based on the left-most visible candle on the chart.
Code Explanation:
The script imports the PineCoders VisibleChart library for accessing the visible chart range.
It defines a function `f_pcr()` to calculate the percentage gain for a given symbol.
Input options are provided to enable or disable symbols and set their visibility.
Symbols are defined using `input.symbol()` and the percentage gains are calculated using `request.security()`.
The calculated percentage gains for each symbol are plotted on the chart using different colors and line widths.
thanks to @PineCoders for VisibleChart library.
Momentum Trend Fusion (MTF)The Momentum Trend Fusion (MTF) is a composite indicator that combines the Awesome Oscillator and the Relative Strength Index to provide a unique perspective on market momentum and trend strength. The MTF is calculated by first running the Relative Strength Index (RSI) on the Awesome Oscillator (AO) and then applying an Exponential Moving Average (EMA) on the RSI value. The MTF is designed to help traders detect market phases and confirm trend direction by analyzing the cross of the EMA and RSI, as well as divergences between the AO and price. The MTF can be customized by the user by providing the lengths of the RSI and EMA calculations, making it an ideal tool for traders with different time frames and risk tolerances.

Trend and Momentum DashboardI created this indicator to tell me when it's time to trade (going long) and when it's time to wait (or going short).
You can enter up to 13 ticker (default is S&P500 and key market segments).
For each ticker, fibonacci levels are calculated and represented either in 5 color or 3 color mode as single lines.
(Thanks to eykpunter for the fibonacci level implementation. I'm using his code and modified it slightly).
Color coding (5 color mode) explanation:
blue = in uptrend area
light blue = in prudent buyers area
gray = in center area
light red = in prudent sellers area
red = in downtrend area
The topline is a combination of all ticker and shows if the market is either bullish or bearish (threshold adjustable in settings)
The bullish/bearish trend can also be used as background color. Alternatively the last bar in the selected time period is been highlighted.
How to use it:
The indicator works on all timeframes. Use the color coding explanation above to see the status of each asset.
a) You can evaluate "long" term trend using day or week timeframe. e.g. I'm usually trading only long and stay out of the market when it is not bullish (top line & background = blue). I'm also using it to know which segments/assets are currently "hot".
b) You can evaluate short term momentum (using 1h or lower timeframe) and see in which direction the market/assets are moving. e.g. I use this when the exchanges open to see how the day is going to move.
I've attached 3 examples in the screenshot - first is the default, in the second one I'm using different asset classes and the third one is for crypto.
Limitations:
There are security request limits as well as string limitations for the security calls in pine script, so I went to the maximum what is currently possible.
(No financial advise, for testing purposes only)

Immediate Trend - VHXIMMEDIATE TREND - VULNERABLE_HUMAN_X
This indicator is used to identify the immediate trend in the market.
When a Short Term High (STH) is engulfed and closed above, we consider that as a bullish trend.
And Similarly, when a Short Term Low (STL) is engulfed and closed below, we consider that as a bullish trend.
STH - A candle that is higher than the one candle towards it's left and one candle towards it's right.
STL - A candle that is lower than the one candle towards it's left and one candle towards it's right.
HOW TO USE:
1. Do not take trades purely based on the immediate trend showcased by the indicator. Rather, use them as confluence with your trading strategy.
2. When you are expecting price to reverse at your point of interest (Denamd/Supply zone), this indicator can help you predict the reversal by showcasing the current trend.
3. Using this indicator you can travel the trend as long as there is a change of trend predicted by this indicator.
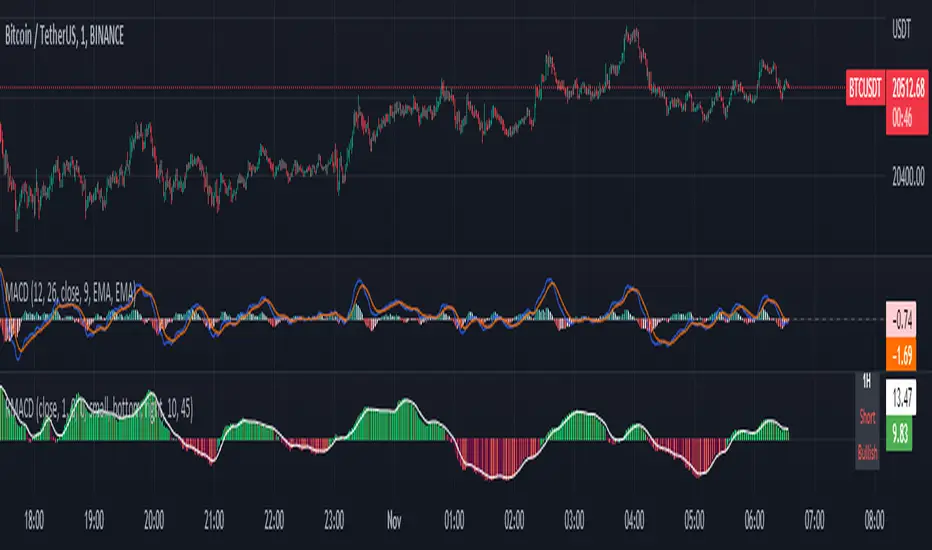
Rolling MACDThis indicator displays a Rolling Moving Average Convergence Divergence . Contrary to MACD indicators which use a fix time segment, RMACD calculates using a moving window defined by a time period (not a simple number of bars), so it shows better results.
This indicator is inspired by and use the Close & Inventory Bar Retracement Price Line to create an MACD in different timeframes.
█ CONCEPTS
If you are not already familiar with MACD, so look at Help Center will get you started www.tradingview.com
The typical MACD, short for moving average convergence/divergence, is a trading indicator used in technical analysis of stock prices, created by Gerald Appel in the late 1970s. It is designed to reveal changes in the strength, direction, momentum, and duration of a trend in a stock's price.
The MACD indicator(or "oscillator") is a collection of three time series calculated from historical price data, most often the closing price. These three series are: the MACD series proper, the "signal" or "average" series, and the "divergence" series which is the difference between the two. The MACD series is the difference between a "fast" (short period) exponential moving average (EMA), and a "slow" (longer period) EMA of the price series. The average series is an EMA of the MACD series itself.
Because RMACD uses a moving window, it does not exhibit the jumpiness of MACD plots. You can see the more jagged MACD on the chart above. I think both can be useful to traders; up to you to decide which flavor works for you.
█ HOW TO USE IT
Load the indicator on an active chart (see the Help Center if you don't know how).
Time period
By default, the script uses an auto-stepping mechanism to adjust the time period of its moving window to the chart's timeframe. The following table shows chart timeframes and the corresponding time period used by the script. When the chart's timeframe is less than or equal to the timeframe in the first column, the second column's time period is used to calculate RMACD:
Chart Time
timeframe period
1min 🠆 1H
5min 🠆 4H
1H 🠆 1D
4H 🠆 3D
12H 🠆 1W
1D 🠆 1M
1W 🠆 3M
You can use the script's inputs to specify a fixed time period, which you can express in any combination of days, hours and minutes.
By default, the time period currently used is displayed in the lower-right corner of the chart. The script's inputs allow you to hide the display or change its size and location.
Minimum Window Size
This input field determines the minimum number of values to keep in the moving window, even if these values are outside the prescribed time period. This mitigates situations where a large time gap between two bars would cause the time window to be empty, which can occur in non-24x7 markets where large time gaps may separate contiguous chart bars, namely across holidays or trading sessions. For example, if you were using a 1D time period and there is a two-day gap between two bars, then no chart bars would fit in the moving window after the gap. The default value is 10 bars.
//
This indicator should make trading easier and improve analysis. Nothing is worse than indicators that give confusingly different signals.
I hope you enjoy my new ideas
best regards
Chervolino
Aarika RSIHello traders, purpose of creating this indicator is simply trying to analyse the trend of any symbol.
This indicator can be used on any script like Indices, Stocks, Future, Currency & Crypto.
This RSI version is much simpler to identify the trend of the script than that of traditional RSI trendline. Rather than showing a line, this RSI indicates bars for better and clear visibility of RSI levels.
This is a modified version of © ParkF. I have modified it to simplest possible manner.
How to trade:
RSI level 80, I consider this as extreme-bought which means high chance if bear market from this point on any given timeframe. Whereas 20 is considered as extreme-sold and have a chance to go higher from the current level.
I recommend you to study this RSI before putting it into practice.
Always start with small target and then go for big one by trailing your profit. This is not a Holy Grail indicator which always gives profit but if you practice this indicator with consistency, your portfolio may give good returns.
Use proper money management for any trade. Go for paper trade and observe how this indicator behaves and once satisfied then only take real trade.
Disclaimer: Please make sure you study this indicator on different timeframes because inserted set of data may act differently on different scripts and may vary from timeframe to timeframe.
We advice you to use this indicator for trend-analysis and study purpose only. Author/publisher of this indicator is not responsible for your profit or loss if you use this indicator for trading purpose one way or another.
N.B.: We do not recommend using HeikinAshi charting for this particular indicator as the data inputs may behave differently than expected. If you have any query, you may comment below.

Aarika Balance of Power Trend (ABOPC)Hello traders, this is Balance of Power. We have modified some levels to easily identify the trend of the symbol. This will work on any symbol and on any timeframe!
How to trade based on ABOPC:
1) When BOP is above 0.00 line it indicates a Bull trend and below 0.00 level means a bearish trend may come in action.
2) If BOP line is at 0.10 level, it means there is a 50% chance of reversal
3) If BOP line is 0.20 level, it suggests 90% chance of reversal or sideways market.
We highly recommend not to trade solely based on this indicator, rather use this as a supportive or double confirmation indicator for study purpose.
Thanks.
Disclaimer: This indicator was not created by us but we only modified it for study purpose.
Ema Cross, 10 /21 / 55Ema Cross tool using Ema 10 / Ema 21 / Ema 55
I have found these settings very useful for catching breakouts on Alt coins.
Alerts Added,
Breakout = Ema 10 crossing above Ema 21
Breakdown = Ema 10 crossing under Ema 21
Ema 55 added as a useful area to catch dips when price is trending