VoluTility🌊 VoluTility forecasts trend exhaustion, breakout pressure, and structural inflection by measuring volatility within the effort stream. Built on the concept of ATR applied to volume, it doesn’t read raw volume — it reveals whether that volume is stable, chaotic, or compressing ahead of a move. The goal is to detect structural setups before they resolve. The lower the timeframe, the greater the alpha.
🧠 Core Logic
A zero-centered histogram shows the deviation of smoothed volume from its own volatility baseline. Positive bars indicate expansion; negative bars signal compression. Color reflects rate-of-change in volume volatility. Opacity tracks effort/result strength — showing when moves are real or hollow.
The overlaid ribbon (EMA vs HMA) highlights rhythm shifts. Orange fill signals real expansion; yellow shows decay or absorption. Together, they expose pre-breakout compression and exhaustion tails before price reacts.
🏗️ Structural Read
On the 1H BTC chart shown, price coils into a shallow pullback, compressing within a narrow range marked by shrinking candle bodies and muted wick aggression. A sudden expansion candle breaks the coil cleanly, with no immediate rejection or wick reversion. Price holds above the breakout pivot, establishing a baseline for structural acceptance and shifting bias toward continuation.
🔰 Zone Descriptions
🔴 Volatile blowout
🟠 Clean expansion
🟡 Passive or absorbed effort
🟢 Steady-state rhythm
🔵 Compression coil
🧐 Suggested Use
VoluTility is expressly designed as an overlay for sub-pane indicators, where it acts as a second-order rhythm map — exposing hidden structural pressure within volume or volatility streams. When paired with volume (like ZVOL or OBVX), it highlights when flow is expanding with intent versus fading into noise. When layered over volatility signals (like ATR Turbulence or WIRE), it reveals whether expansion has real effort behind it — or is just structural slack.
It pairs especially well with the Relative Directional Index (RDI), where its histogram and ribbon offer early exhaustion signals before traditional trend or momentum fades appear. On raw momentum tools, it acts as a filter: softening false breaks and confirming pressure-backed continuation.
Run on 15m or lower charts for early entry cues or breakout anticipation. On 1H charts, use it to validate compression resolution or detect fatigue before structure turns. It doesn’t react to price — it forecasts readiness.
Trend
RVOL Effort Matrix💪🏻 RVOL Effort Matrix is a tiered volume framework that translates crowd participation into structure-aware visual zones. Rather than simply flagging spikes, it measures each bar’s volume as a ratio of its historical average and assigns to that effort dynamic tiers, creating a real-time map of conviction , exhaustion , and imbalance —before price even confirms.
⚖️ At its core, the tool builds a histogram of relative volume (RVOL). When enabled, a second layer overlays directional effort by estimating buy vs sell volume using candle body logic. If the candle closes higher, green (buy) volume dominates. If it closes lower, red (sell) volume leads. These components are stacked proportionally and inset beneath a colored cap line—a small but powerful layer that maintains visibility of the true effort tier even when split bars are active. The cap matches the original zone color, preserving context at all times.
Coloration communicates rhythm, tempo, and potential turning points:
• 🔴 = structurally weak effort, i.e. failed moves, fake-outs or trend exhaustion
• 🟡 = neutral volume, as seen in consolidations or pullbacks
• 🟢 = genuine commitment, good for continuation, breakout filters, or early rotation signals
• 🟣 = explosive volume signaling either climax or institutional entry—beware!
Background shading (optional) mirrors these zones across the pane for structural scanning at a glance. Volume bars can be toggled between full-stack mode or clean column view. Every layer is modular—built for composability with tools like ZVOL or OBVX Conviction Bias.
🧐 Ideal Use-Cases:
• 🕰 HTF bias anchoring → LTF execution
• 🧭 Identifying when structure is being driven by real crowd pressure
• 🚫 Fading green/fuchsia bars that fail to break structure
• ✅ Riding green/fuchsia follow-through in directional moves
🍷 Recommended Pairings:
• ZVOL for statistically significant volume anomaly detection
• OBVX Conviction Bias ↔️ for directional confirmation of effort zones
• SUPeR TReND 2.718 for structure-congruent entry filtering
• ATR Turbulence Ribbon to distinguish expansion pressure from churn
🥁 RVOL Effort Matrix is all about seeing—how much pressure is behind a move, whether that pressure is sustainable, and whether the crowd is aligned with price. It's volume, but readable. It’s structure, but dynamic. It’s the difference between obeying noise and trading to the beat of the market.
Moving Average Shift WaveTrend StrategyOverview
The Moving Average Shift WaveTrend Strategy is a trend-following and momentum-based trading system, designed to be overlayed on TradingView charts. It utilizes conditions based on volatility, session timing, trend direction, and a custom oscillator to trigger trades.
Strategy Objectives
Enter trades in the direction of the prevailing trend and exit on opposite momentum signals.
Filter out false signals using time and volatility constraints.
Employ automatic Take Profit (TP), Stop Loss (SL), and trailing stop mechanisms for risk management.
Key Features
Multiple selectable moving average (MA) types: SMA, EMA, SMMA (RMA), WMA, VWMA.
Combined filters using MA and a custom oscillator.
Time-based and volatility-based trade filtering.
[Trailing stop and custom TP/SL logic.
"In-wave" flag to prevent re-entry during the same trend wave.
Trading Rules
Long Entry Conditions:
Price is above the selected MA.
Oscillator is positive and rising.
Long-term EMA trend is upward.
Trade occurs within allowed session hours and under sufficient volatility.
Not currently in a wave.
Short Entry Conditions:
Price is below the MA.
Oscillator is negative and falling.
Long-term EMA trend is downward.
All other long entry criteria apply.
Exit Conditions:
Hit TP or SL.
Oscillator and MA provide opposing signals.
Trailing stop is triggered.
Risk Management Parameters
Pair : ETH/USD
Timeframe : 4H
Starting Capital : $3,000
Commission : 0.02%
Slippage : 2 pips
Risk per Trade : 5% of account equity (can be adjusted for sustainable practice)
Total Trades : 224 (backtested on selected dataset)
Backtesting range May 24, 2016, 05:00 — Apr 07, 2025, 17:00
Note: Risk parameters are fully configurable and should be tailored to individual trading setups and broker requirements.
Trading Parameters & Considerations
Time Filter : Trades only between 9:00 and 17:00 (exchange time)
Volatility Condition : ATR must exceed its median value
Long-Term Trend Filter : 200-period EMA
MA Settings
MA Type: SMA
Length: 40
Source: hl2
Oscillator Settings
Length: 15
Threshold: 0.5
Risk Settings
Take Profit: 1.5%
Stop Loss: 1.0%
Trailing Stop: 1.0%
Visual Support
MA and oscillator color changes offer clear visual signals.
Entry and exit points are visually represented on the chart.
Trailing stops and custom TP/SL conditions are transparently managed.
Strategy Improvements & Uniqueness
In-wave flag prevents overtrading within the same trend phase.
Sophisticated filtering through session, volatility, and trend conditions helps reduce noise.
Dynamic tracking of high/low since entry allows precise trailing stop placement.
Inspirations & Attribution
This strategy is inspired by the excellent work of:
ChartPrime – “Moving Average Shift”
Leveraging the Moving Average Shift technique for intuitive signal generation.
Summary
The Moving Average Shift WaveTrend Strategy is a robust trend-following system that operates based on the alignment of multiple filters and signals. With built-in time and volatility constraints and clear risk management logic, it minimizes the need for discretionary decision-making, offering a consistent and stable trading environment.

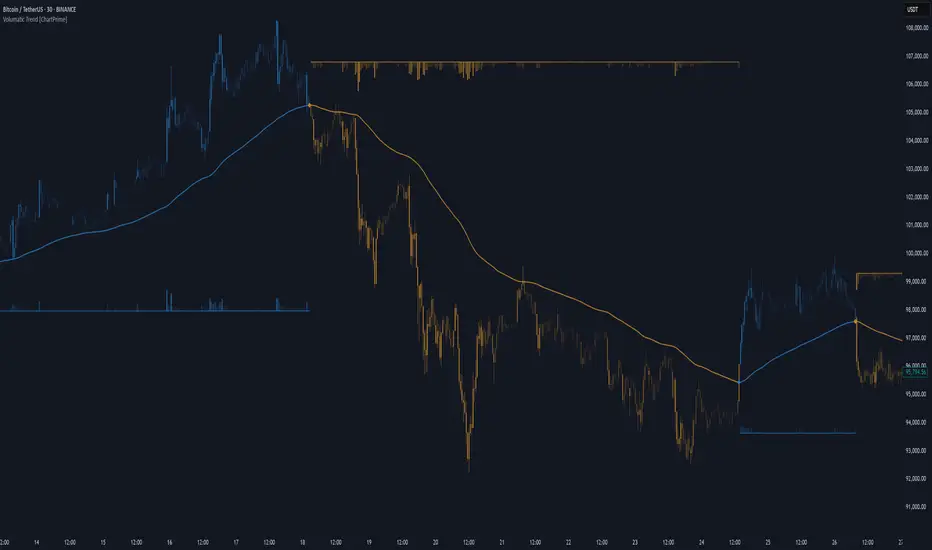
Volumatic Trend [ChartPrime]
A unique trend-following indicator that blends trend logic with volume visualization, offering a dynamic view of market momentum and activity. It automatically detects trend shifts and paints volume histograms at key levels, allowing traders to easily spot strength or weakness within trends.
⯁ KEY FEATURES
Trend Detection System:
Uses a custom combination of weighted EMA (swma) and regular EMA to detect trend direction.
A diamond appears on trend shift, indicating the starting point of a new bullish or bearish phase.
Volume Histogram Zones:
At each new trend, the indicator draws two horizontal zones (top and bottom) and visualizes volume activity within that trend using dynamic histogram candles.
Gradient-Based Candle Coloring:
Candle color is blended with a gradient based on volume intensity. This helps highlight where volume spikes occurred, making it easy to identify pressure points.
Volume Summary Labels:
A label at the end of each trend zone displays two critical values:
- Delta: net volume difference between bullish and bearish bars.
- Total: overall volume accumulated during the trend.
⯁ HOW TO USE
Monitor diamond markers to identify when a new trend begins.
Use volume histogram spikes to assess if the trend is supported by strong volume or lacking participation.
A high delta with strong total volume in a trend indicates institutional support.
Compare gradient strength of candles—brighter areas represent higher-volume trading activity.
Can be used alone or combined with other confirmation tools like structure breaks, liquidity sweeps, or order blocks.
⯁ CONCLUSION
Volumatic Trend gives you more than just trend direction—it provides insight into the force behind it. With volume-graded candles and real-time histogram overlays, traders can instantly assess whether a trend is backed by conviction or fading strength. A perfect tool for swing traders and intraday strategists looking to add volume context to their directional setups.
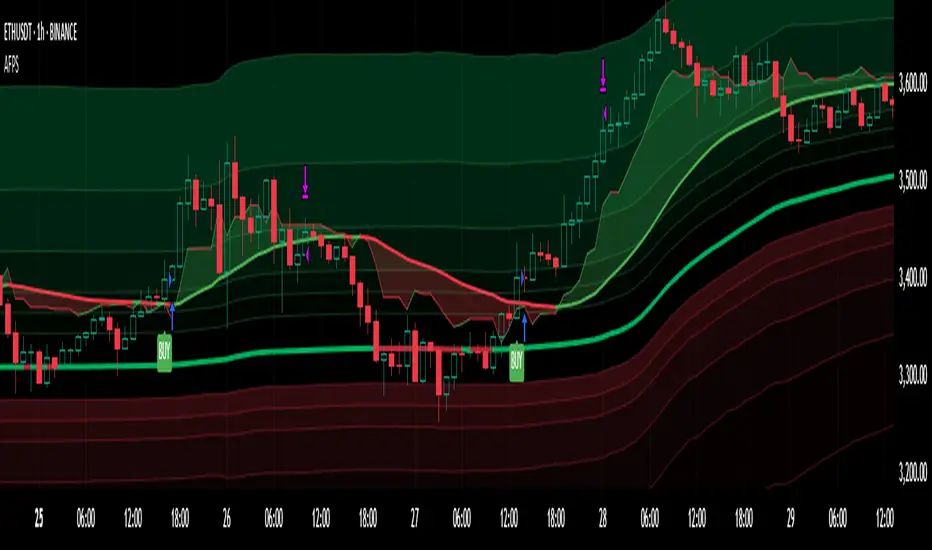
Adaptive Fibonacci Pullback System -FibonacciFluxAdaptive Fibonacci Pullback System (AFPS) - FibonacciFlux
This work is licensed under a Attribution-NonCommercial-ShareAlike 4.0 International (CC BY-NC-SA 4.0). Original concepts by FibonacciFlux.
Abstract
The Adaptive Fibonacci Pullback System (AFPS) presents a sophisticated, institutional-grade algorithmic strategy engineered for high-probability trend pullback entries. Developed by FibonacciFlux, AFPS uniquely integrates a proprietary Multi-Fibonacci Supertrend engine (0.618, 1.618, 2.618 ratios) for harmonic volatility assessment, an Adaptive Moving Average (AMA) Channel providing dynamic market context, and a synergistic Multi-Timeframe (MTF) filter suite (RSI, MACD, Volume). This strategy transcends simple indicator combinations through its strict, multi-stage confluence validation logic. Historical simulations suggest that specific MTF filter configurations can yield exceptional performance metrics, potentially achieving Profit Factors exceeding 2.6 , indicative of institutional-level potential, while maintaining controlled risk under realistic trading parameters (managed equity risk, commission, slippage).
4 hourly MTF filtering
1. Introduction: Elevating Pullback Trading with Adaptive Confluence
Traditional pullback strategies often struggle with noise, false signals, and adapting to changing market dynamics. AFPS addresses these challenges by introducing a novel framework grounded in Fibonacci principles and adaptive logic. Instead of relying on static levels or single confirmations, AFPS seeks high-probability pullback entries within established trends by validating signals through a rigorous confluence of:
Harmonic Volatility Context: Understanding the trend's stability and potential turning points using the unique Multi-Fibonacci Supertrend.
Adaptive Market Structure: Assessing the prevailing trend regime via the AMA Channel.
Multi-Dimensional Confirmation: Filtering signals with lower-timeframe Momentum (RSI), Trend Alignment (MACD), and Market Conviction (Volume) using the MTF suite.
The objective is to achieve superior signal quality and adaptability, moving beyond conventional pullback methodologies.
2. Core Methodology: Synergistic Integration
AFPS's effectiveness stems from the engineered synergy between its core components:
2.1. Multi-Fibonacci Supertrend Engine: Utilizes specific Fibonacci ratios (0.618, 1.618, 2.618) applied to ATR, creating a multi-layered volatility envelope potentially resonant with market harmonics. The averaged and EMA-smoothed result (`smoothed_supertrend`) provides a robust, dynamic trend baseline and context filter.
// Key Components: Multi-Fibonacci Supertrend & Smoothing
average_supertrend = (supertrend1 + supertrend2 + supertrend3) / 3
smoothed_supertrend = ta.ema(average_supertrend, st_smooth_length)
2.2. Adaptive Moving Average (AMA) Channel: Provides dynamic market context. The `ama_midline` serves as a key filter in the entry logic, confirming the broader trend bias relative to adaptive price action. Extended Fibonacci levels derived from the channel width offer potential dynamic S/R zones.
// Key Component: AMA Midline
ama_midline = (ama_high_band + ama_low_band) / 2
2.3. Multi-Timeframe (MTF) Filter Suite: An optional but powerful validation layer (RSI, MACD, Volume) assessed on a lower timeframe. Acts as a **validation cascade** – signals must pass all enabled filters simultaneously.
2.4. High-Confluence Entry Logic: The core innovation. A pullback entry requires a specific sequence and validation:
Price interaction with `average_supertrend` and recovery above/below `smoothed_supertrend`.
Price confirmation relative to the `ama_midline`.
Simultaneous validation by all enabled MTF filters.
// Simplified Long Entry Logic Example (incorporates key elements)
long_entry_condition = enable_long_positions and
(low < average_supertrend and close > smoothed_supertrend) and // Pullback & Recovery
(close > ama_midline and close > ama_midline) and // AMA Confirmation
(rsi_filter_long_ok and macd_filter_long_ok and volume_filter_ok) // MTF Validation
This strict, multi-stage confluence significantly elevates signal quality compared to simpler pullback approaches.
1hourly filtering
3. Realistic Implementation and Performance Potential
AFPS is designed for practical application, incorporating realistic defaults and highlighting performance potential with crucial context:
3.1. Realistic Default Strategy Settings:
The script includes responsible default parameters:
strategy('Adaptive Fibonacci Pullback System - FibonacciFlux', shorttitle = "AFPS", ...,
initial_capital = 10000, // Accessible capital
default_qty_type = strategy.percent_of_equity, // Equity-based risk
default_qty_value = 4, // Default 4% equity risk per initial trade
commission_type = strategy.commission.percent,
commission_value = 0.03, // Realistic commission
slippage = 2, // Realistic slippage
pyramiding = 2 // Limited pyramiding allowed
)
Note: The default 4% risk (`default_qty_value = 4`) requires careful user assessment and adjustment based on individual risk tolerance.
3.2. Historical Performance Insights & Institutional Potential:
Backtesting provides insights into historical behavior under specific conditions (always specify Asset/Timeframe/Dates when sharing results):
Default Performance Example: With defaults, historical tests might show characteristics like Overall PF ~1.38, Max DD ~1.16%, with potential Long/Short performance variance (e.g., Long PF 1.6+, Short PF < 1).
Optimized MTF Filter Performance: Crucially, historical simulations demonstrate that meticulous configuration of the MTF filters (particularly RSI and potentially others depending on market) can significantly enhance performance. Under specific, optimized MTF filter settings combined with appropriate risk management (e.g., 7.5% risk), historical tests have indicated the potential to achieve **Profit Factors exceeding 2.6**, alongside controlled drawdowns (e.g., ~1.32%). This level of performance, if consistently achievable (which requires ongoing adaptation), aligns with metrics often sought in institutional trading environments.
Disclaimer Reminder: These results are strictly historical simulations. Past performance does not guarantee future results. Achieving high performance requires careful parameter tuning, adaptation to changing markets, and robust risk management.
3.3. Emphasizing Risk Management:
Effective use of AFPS mandates active risk management. Utilize the built-in Stop Loss, Take Profit, and Trailing Stop features. The `pyramiding = 2` setting requires particularly diligent oversight. Do not rely solely on default settings.
4. Conclusion: Advancing Trend Pullback Strategies
The Adaptive Fibonacci Pullback System (AFPS) offers a sophisticated, theoretically grounded, and highly adaptable framework for identifying and executing high-probability trend pullback trades. Its unique blend of Fibonacci resonance, adaptive context, and multi-dimensional MTF filtering represents a significant advancement over conventional methods. While requiring thoughtful implementation and risk management, AFPS provides discerning traders with a powerful tool potentially capable of achieving institutional-level performance characteristics under optimized conditions.
Acknowledgments
Developed by FibonacciFlux. Inspired by principles of Fibonacci analysis, adaptive averaging, and multi-timeframe confirmation techniques explored within the trading community.
Disclaimer
Trading involves substantial risk. AFPS is an analytical tool, not a guarantee of profit. Past performance is not indicative of future results. Market conditions change. Users are solely responsible for their decisions and risk management. Thorough testing is essential. Deploy at your own considered risk.
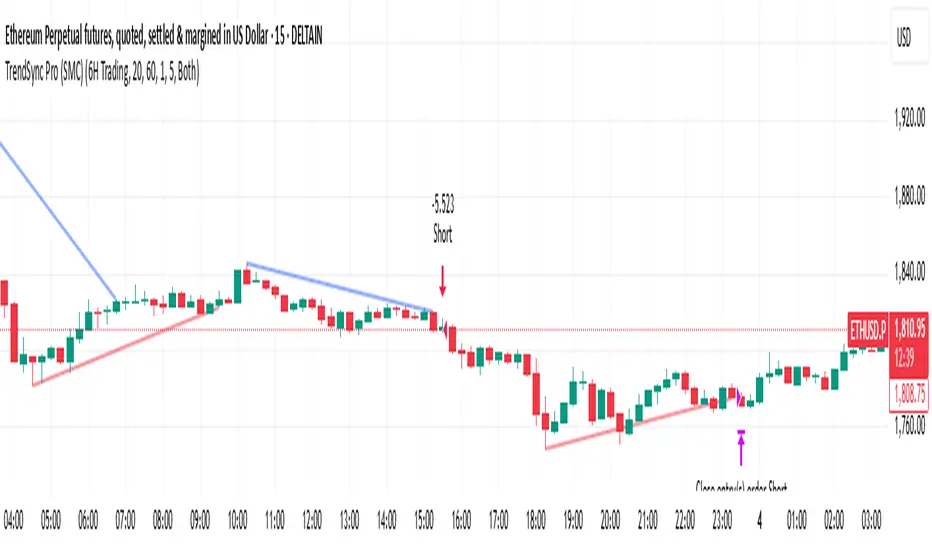
TrendSync Pro (SMC)📊 TrendSync Pro (SMC) – Advanced Trend-Following Strategy with HTF Alignment
Created by Shubham Singh
🔍 Strategy Overview
TrendSync Pro (SMC) is a precision-based smart trend-following strategy inspired by Smart Money Concepts (SMC). It combines: Real-time pivot-based trendline detection
Higher Time Frame (HTF) filtering to align trades with dominant trend
Risk management via adjustable Stop Loss (SL) and Take Profit (TP)
Directional control — trade only bullish, bearish, or both setups
Realistic backtesting using commissions and slippage
Pre-optimized profiles for scalpers, intraday, swing, and long-term traders
🧠 How It Works:
🔧 Strategy Settings Image:
beeimg.com
The strategy dynamically identifies trend direction by using swing high/low pivots. When a new pivot forms: It draws a trendline from the last significant pivot
Detects whether the trend is up (based on pivot lows) or down (based on pivot highs)
Waits for price to break above/below the trendline
Confirms with HTF price direction (HTF close > previous HTF close = bullish)
Only then it triggers a long or short trade
It exits either at TP, SL, or a manual trendline break
🛠️ Adjustable Parameters:
Trend Period: Length for pivot detection (affects sensitivity of trendlines)
HTF Timeframe: Aligns lower timeframe entries with higher timeframe direction
SL% and TP%: Customize your risk-reward profile
Commission & Slippage: Make backtests more realistic
Trade Direction: Choose to trade: Long only, Short only, or Both
🎛️ Trade Direction Control:
In settings, you can choose: Bullish Only: Executes only long entries
Bearish Only: Executes only short entries
Both: Executes both long and short entries when conditions are met
This allows you to align trades with your own market bias or external analysis.
📈 Entry Logic: Long Entry:
• Price crosses above trendline
• HTF is bullish (HTF close > previous close)
• Latest pivot is a low (trend is considered up)
Short Entry:
• Price crosses below trendline
• HTF is bearish (HTF close < previous close)
• Latest pivot is a high (trend is considered down)
📉 Exit Logic: Hit Take Profit or Stop Loss
Manual trendline invalidation: If price crosses opposite of the trend direction
⏰ Best Timeframes & Recommended Settings:
Scalping (1m to 5m):
HTF = 15m | Trend Period = 7
SL = 0.5% | TP = 1% to 2%
Intraday (15m to 30m):
HTF = 1H | Trend Period = 10–14
SL = 0.75% | TP = 2% to 3%
6 Hour Trading (30m to 1H):
HTF = 4H | Trend Period = 20
SL = 1% | TP = 4% to 6%
Swing Trading (4H to 1D):
HTF = 1D | Trend Period = 35
SL = 2% | TP = 8% to 12%
Long-Term Investing (1D+):
HTF = 1W | Trend Period = 50
SL = 3% | TP = 15%+
Note: These are recommended base settings. Adjust based on volatility, asset class, or personal trading style.
📸 Testing Note:
beeimg.com
TradingView limits test length to 20k bars (~40 trades on smaller timeframes). To show long-term results: Test on higher timeframes (e.g., 1H, 4H, 1D)
Share images of backtest result in description
Host longer test result screenshots on Imgur or any public drive
📍 Asset Behavior Insight:
This strategy works on multiple assets, including BTC, ETH, etc.
Performance varies by trend strength:
Sometimes BTC performs better than ETH
Other times ETH gives better results
That’s normal as both assets follow different volatility and trend behavior
It’s a trend-following setup. Longer and clearer the trend → better the results.
✅ Best Practices: Avoid ranging markets
Use proper SL/TP for each timeframe
Use directional filter if you already have a directional bias
Always forward test before going live
⚠️ Trading Disclaimer:
This script is for educational and backtesting purposes only. Trading involves risk. Always use risk management and never invest more than you can afford to lose.
Uptrick X PineIndicators: Z-Score Flow StrategyThis strategy is based on the Z-Score Flow Indicator developed by Uptrick. Full credit for the original concept and logic goes to Uptrick.
The Z-Score Flow Strategy combines statistical mean-reversion logic with trend filtering, RSI confirmation, and multi-mode trade execution, offering a flexible and structured approach to trading both reversals and trend continuations.
Core Concepts Behind Z-Score Flow
1. Z-Score Mean Reversion Logic
The Z-score measures how far current price deviates from its statistical mean, in standard deviations.
A high positive Z-score (e.g. > 2) suggests price is overbought and may revert downward.
A low negative Z-score (e.g. < -2) suggests price is oversold and may revert upward.
The strategy uses Z-score thresholds to trigger signals when price deviates far enough from its mean.
2. Trend Filtering with EMA
To prevent counter-trend entries, the strategy includes a trend filter based on a 50-period EMA:
Only allows long entries if price is below EMA (mean-reversion in downtrends).
Only allows short entries if price is above EMA (mean-reversion in uptrends).
3. RSI Confirmation and Lockout System
An RSI smoothing mechanism helps confirm signals and avoid whipsaws:
RSI must be below 30 and rising to allow buys.
RSI must be above 70 and falling to allow sells.
Once a signal occurs, it is "locked out" until RSI re-enters the neutral zone (30–70).
This avoids multiple signals in overextended zones and reduces overtrading.
Entry Signal Logic
A buy or sell is triggered when:
Z-score crosses below (buy) or above (sell) the threshold.
RSI smoothed condition is met (oversold and rising / overbought and falling).
The trend condition (EMA filter) aligns.
A cooldown period has passed since the last opposite trade.
This layered approach helps ensure signal quality and timing precision.
Trade Modes
The strategy includes three distinct trade modes to adapt to various market behaviors:
1. Standard Mode
Trades are opened using the Z-score + RSI + trend filter logic.
Each signal must pass all layered conditions.
2. Zero Cross Mode
Trades are based on the Z-score crossing zero.
This mode is useful in trend continuation setups, rather than mean reversion.
3. Trend Reversal Mode
Trades occur when the mean slope direction changes, i.e., basis line changes color.
Helps capture early trend shifts with less lag.
Each mode can be customized for long-only, short-only, or long & short execution.
Visual Components
1. Z-Score Mean Line
The basis (mean) line is colored based on slope direction.
Green = bullish slope, Purple = bearish slope, Gray = flat.
A wide shadow band underneath reflects current trend momentum.
2. Gradient Fill to Price
A gradient zone between price and the mean reflects:
Price above mean = bearish zone with purple overlay.
Price below mean = bullish zone with teal overlay.
This visual aid quickly reveals market positioning relative to equilibrium.
3. Signal Markers
"𝓤𝓹" labels appear for buy signals.
"𝓓𝓸𝔀𝓷" labels appear for sell signals.
These are colored and positioned according to trend context.
Customization Options
Z-Score Period & Thresholds: Define sensitivity to price deviations.
EMA Trend Filter Length: Filter entries with long-term bias.
RSI & Smoothing Periods: Fine-tune RSI confirmation conditions.
Cooldown Period: Prevent signal spam and enforce timing gaps.
Slope Index: Adjust how far back to compare mean slope.
Visual Settings: Toggle mean lines, gradients, and more.
Use Cases & Strategy Strengths
1. Mean-Reversion Trading
Ideal for catching pullbacks in trending markets or fading overextended price moves.
2. Trend Continuation or Reversal
With multiple trade modes, traders can choose between fading price extremes or trading slope momentum.
3. Signal Clarity and Risk Control
The combination of Z-score, RSI, EMA trend, and cooldown logic provides high-confidence signals with built-in filters.
Conclusion
The Z-Score Flow Strategy by Uptrick X PineIndicators is a versatile and structured trading system that:
Fuses statistical deviation (Z-score) with technical filters.
Provides both mean-reversion and trend-based entry logic.
Uses visual overlays and signal labels for clarity.
Prevents noise-driven trades via cooldown and lockout systems.
This strategy is well-suited for traders seeking a data-driven, multi-condition entry framework that can adapt to various market types.
Full credit for the original concept and indicator goes to Uptrick.

Trendline Breakout Navigator [LuxAlgo]The Trendline Breakout Navigator indicator shows three trendlines, representing trends of different significance between Swing Points.
Dots highlight a Higher Low (HL) or Lower High (LH) that pierces through the Trendline without the closing price breaking the Trendline.
A bar color and background color option is included, which offers insights into the price against the trendlines.
🔶 USAGE
Trendlines (TL) are drawn, starting as a horizontal line from a Swing Point.
When an HL (in the case of a bullish TL) or an LH (bearish TL) is found, this Swing Point is connected to the first Swing Point. In both cases, the TL can be optimized when one or more historical close prices breach the TL (see DETAILS).
A solid-styled long-term trendline represents the overall market direction, while a dashed-styled medium-term trendline captures medium-term movements within the long-term trend. Finally, a dotted-styled short-term trendline tracks short-term fluctuations.
🔹 Swing Points vs. Trend
A "Higher High" (HH) or "Lower Low" (LL) will initialize a new trendline, respectively, starting from the previous "Swing Low" or Swing High".
To spot the trend shift, "HH/LL" labels and an optional background color are included. They can be enabled/disabled or set at "Long, Medium, or Short" term TL (Settings—"MS", "HH/LL" and "Background Color").
These features are linked to one Trendline of choice only.
Where the "HH/LL" labels can show a potential trend shift, the background color is:
Green from the moment the close price breaks above a bearish trendline or when an HH occurs
Red from the moment the close price breaks below a bullish trendline or when an LL occurs
🔹 Bar Color
The bar color will depend on the location of the closing price against the three trendlines. When a trendline is unavailable (for example, if the close price breaks the TL and there is no HH/LL), the last known trendline value will be considered.
All three trendlines influence the bar color.
If the close price is above the "Long Term" TL, the bar color will show a gradient of green, darker when the close price is below the "Medium Term" and/or "Short Term" TLs.
On the other hand, when the close price is below the "Long Term" TL, the bar color will show a gradient of red, which becomes darker when the close price is above the "Medium Term" and/or "Short Term" TLs.
To keep the above example simple, only the "Long Term" TL is considered. The white line (not included in the script) resembles the actual value of the TL at each bar, where you can see the effect on the bar color.
Combined with the trendlines and dots, the bar color can provide extra depth and insights into the underlying trends.
🔹 Tested Trendlines
If a new HL/LH pierces the Trendline without the close price breaking the Trendline, the Trendline will be updated.
The exact location where the price exceeded the Trendline is visualized by a dot, colored blue on a bullish trendline and orange when bearish.
These dots can be indicative of a potential trend continuation or reversal.
🔹 Higher TimeFrame Option
The "Period" setting enables users to visualize higher-timeframe trendlines as long as the line length doesn't exceed 5000 bars.
🔶 DETAILS
When a new trendline is drawn, the script first draws a preliminary line and then checks whether a historical close price exceeded this line above (in the case of a bearish TL) or below (in a bullish case).
Subsequently, the most valid point in between is chosen as the starting point of the Trendline.
🔶 SETTINGS
Period: Choose "chart" for trendlines from the current chart timeframe, or choose a higher timeframe
🔹 Swing Length
Toggle and Swing Length for three trendlines: Period used for the swing detection, with higher values returning longer-term Swing Levels.
🔹 Style
Trendline: color for bullish/bearish Trendline
Wick Dot: color for bullish/bearish trendline test
Term: Long-, medium- or short-term
HH/LL: Show HH/LL labels (with or without previous Swing High/Low) of chosen Term
Background Color: Green when the closing price is above the trendline of choice, red otherwise
Bar Color

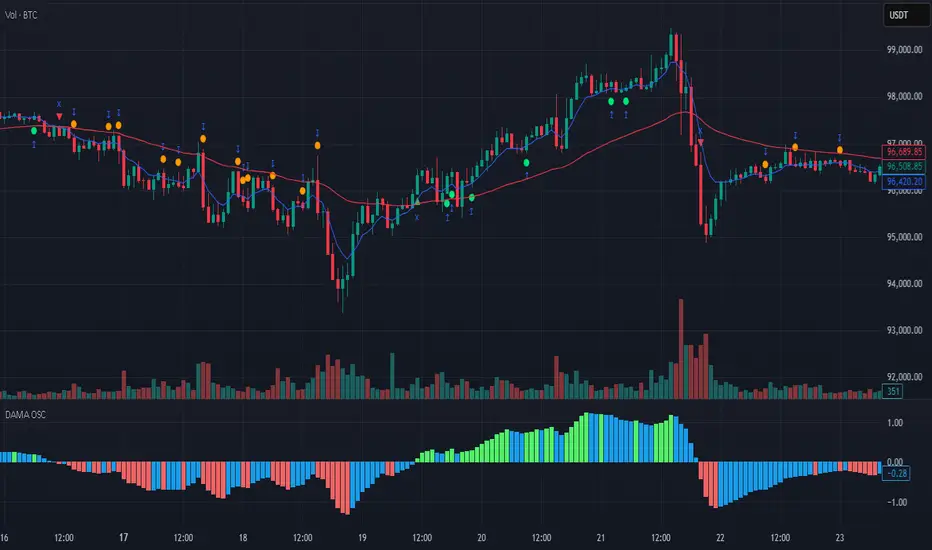
DAMA OSC - Directional Adaptive MA OscillatorOverview:
The DAMA OSC (Directional Adaptive MA Oscillator) is a highly customizable and versatile oscillator that analyzes the delta between two moving averages of your choice. It detects trend progression, regressions, rebound signals, MA cross and critical zone crossovers to provide highly contextual trading information.
Designed for trend-following, reversal timing, and volatility filtering, DAMA OSC adapts to market conditions and highlights actionable signals in real-time.
Features:
Support for 11 custom moving average types (EMA, DEMA, TEMA, ALMA, KAMA, etc.)
Customizable fast & slow MA periods and types
Histogram based on percentage delta between fast and slow MA
Trend direction coloring with “Green”, “Blue”, and “Red” zones
Rebound detection using close or shadow logic
Configurable thresholds: Overbought, Oversold, Underbought, Undersold
Optional filters: rebound validation by candle color or flat-zone filter
Full visual overlay: MA lines, crossover markers, rebound icons
Complete alert system with 16 preconfigured conditions
How It Works:
Histogram Logic:
The histogram measures the percentage difference between the fast and slow MA:
hist_value = ((FastMA - SlowMA) / SlowMA) * 100
Trend State Logic (Green / Blue / Red):
Green_Up = Bullish acceleration
Blue_Up (or Red_Up, depending the display settings) = Bullish deceleration
Blue_Down (or Green_Down, depending the display settings) = Bearish deceleration
Red_Down = Bearish acceleration
Rebound Logic:
A rebound is detected when price:
Crosses back over a selected MA (fast or slow)
After being away for X candles (rebound_backstep)
Optional: filtered by histogram zones or candle color
Inputs:
Display Options:
Show/hide MA lines
Show/hide MA crosses
Show/hide price rebounds
Enable/disable blue deceleration zones
DAMA Settings:
Fast/Slow MA type and length
Source input (close by default)
Overbought/Oversold levels
Underbought/Undersold levels
Rebound Settings:
Use Close and/or Shadow
Rebound MA (Fast/Slow)
Candle color validation
Flat zone filter rebounds (between UnderSold and UnderBought)
Available MA type:
SMA (Simple MA)
EMA (Exponential MA)
DEMA (Double EMA)
TEMA (Triple EMA)
WMA (Weighted MA)
HMA (Hull MA)
VWMA (Volume Weighted MA)
Kijun (Ichimoku Baseline)
ALMA (Arnaud Legoux MA)
KAMA (Kaufman Adaptive MA)
HULLMOD (Modified Hull MA, Same as HMA, tweaked for Pine v6 constraints)
Notes:
**DEMA/TEMA** reduce lag compared to EMA, useful for faster reaction in trending markets.
**KAMA/ALMA** are better suited to noisy or volatile environments (e.g., BTC).
**VWMA** reacts strongly to volume spikes.
**HMA/HULLMOD** are great for visual clarity in fast moves.
Alerts Included (Fully Configurable):
Golden Cross:
Fast MA crosses above Slow MA
Death Cross:
Fast MA crosses below Slow MA
Bullish Rebound:
Rebound from below MA in uptrend
Bearish Rebound:
Rebound from above MA in downtrend
Bull Progression:
Transition into Green_Up with positive delta
Bear Progression:
Transition into Red_Down with negative delta
Bull Regression:
Exit from Red_Down into Blue/Green with negative delta
Bear Regression:
Exit from Green_Up into Blue/Red with positive delta
Crossover Overbought:
Histogram crosses above Overbought
Crossunder Overbought:
Histogram crosses below Overbought
Crossover Oversold:
Histogram crosses above Oversold
Crossunder Oversold:
Histogram crosses below Oversold
Crossover Underbought:
Histogram crosses above Underbought
Crossunder Underbought:
Histogram crosses below Underbought
Crossover Undersold:
Histogram crosses above Undersold
Crossunder Undersold:
Histogram crosses below Undersold
Credits:
Created by Eff_Hash. This code is shared with the TradingView community and full free. do not hesitate to share your best settings and usage.
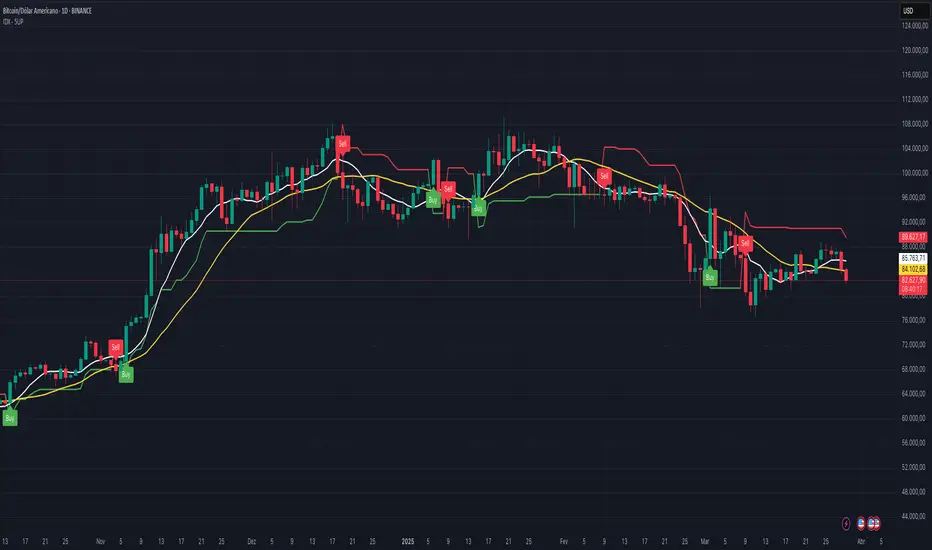
IDX - 5UPThe UDX-5UP is a custom indicator designed to assist traders in identifying trends, entry and exit signals, and market reversal moments with greater accuracy. It combines price analysis, volume, and momentum (RSI) to provide clear buy ("Buy") and sell ("Sell") signals across any asset and timeframe, whether you're a scalper on the 5M chart or a swing trader on the 4H chart. Inspired by robust technical analysis strategies, the UDX-5UP is ideal for traders seeking a reliable tool to operate in volatile markets such as cryptocurrencies, forex, stocks, and futures.
Components of the UDX-5UP
The UDX-5UP consists of three main panels that work together to provide a comprehensive view of the market:
Main Panel (Price):
Pivot Supertrend: A dynamic line that changes color to indicate the trend. Green for an uptrend (look for buys), red for a downtrend (look for sells).
SMAs (Simple Moving Averages): Two SMAs (8 and 21 periods) to confirm the trend direction. When the SMA 8 crosses above the SMA 21, it’s a bullish signal; when it crosses below, it’s a bearish signal.
Entry/Exit Signals: "Buy" (green) and "Sell" (red) labels are plotted on the chart when entry or exit conditions are met.
Volume Panel:
Colored Volume Bars: Green bars indicate dominant buying volume, while red bars indicate dominant selling volume.
Volume Moving Average (MA 20): A blue line that helps identify whether the current volume is above or below the average, confirming the strength of the movement.
RSI Panel:
RSI (Relative Strength Index): Calculated with a period of 14, with overbought (70) and oversold (30) lines to identify momentum extremes.
Divergences: The indicator detects divergences between the RSI and price, plotting signals for potential reversals.
How the UDX-5UP Works
The UDX-5UP uses a combination of rules to generate buy and sell signals:
Buy Signal ("Buy"):
The Pivot Supertrend changes from red to green.
The SMA 8 crosses above the SMA 21.
The volume is above the MA 20, with green bars (indicating buying pressure).
The RSI is rising and, ideally, below 70 (not overbought).
Example: On the 4H chart, the price of Tether (USDT) is at 0.05515. The Pivot Supertrend turns green, the SMA 8 crosses above the SMA 21, the volume shows green bars above the MA 20, and the RSI is at 46. The UDX-5UP plots a "Buy".
Sell Signal ("Sell"):
The Pivot Supertrend changes from green to red.
The SMA 8 crosses below the SMA 21.
The volume is above the MA 20, with red bars (indicating selling pressure).
The RSI is falling and, ideally, above 70 (overbought).
Example: On the 4H chart, the price of Tether rises to 0.05817. The Pivot Supertrend turns red, the SMA 8 crosses below the SMA 21, the volume shows red bars, and the RSI is above 70. The UDX-5UP plots a "Sell".
RSI Divergences:
The indicator identifies bullish divergences (price makes a lower low, but RSI makes a higher low) and bearish divergences (price makes a higher high, but RSI makes a lower high), plotting alerts for potential reversals.
Adjustable Settings
The UDX-5UP is highly customizable to suit your trading style:
Pivot Supertrend Period: Default is 2. Increase to 3 or 4 for more conservative signals (fewer false positives, but more lag).
SMA Periods: Default is 8 and 21. Adjust to 5 and 13 for smaller timeframes (e.g., 5M) or 13 and 34 for larger timeframes (e.g., 1D).
RSI Period: Default is 14. Reduce to 10 for greater sensitivity or increase to 20 for smoother signals.
Overbought/Oversold Levels: Default is 70/30. Adjust to 80/20 in volatile markets.
Display Panels: You can enable/disable the volume and RSI panels to simplify the chart.
How to Use the UDX-5UP
Identify the Trend:
Use the Pivot Supertrend and SMAs to determine the market direction. Uptrend: look for buys. Downtrend: look for sells.
Confirm with Volume and RSI:
For buys: Volume above the MA 20 with green bars, RSI rising and below 70.
For sells: Volume above the MA 20 with red bars, RSI falling and above 70.
Enter the Trade:
Enter a buy when the UDX-5UP plots a "Buy" and all conditions are aligned.
Enter a sell when the UDX-5UP plots a "Sell" and all conditions are aligned.
Plan the Exit:
Use Fibonacci levels or support/resistance on the price chart to set targets.
Exit the trade when the UDX-5UP plots an opposite signal ("Sell" after a buy, "Buy" after a sell).
Tips for Beginners
Start with Larger Timeframes: Use the 4H or 1D chart for more reliable signals and less noise.
Combine with Other Indicators: Use the UDX-5UP with tools like Fibonacci or the Candles RSI (another powerful indicator) to confirm signals.
Practice in Demo Mode: Test the indicator in a demo account before using real money.
Manage Risk: Always use a stop-loss and don’t risk more than 1-2% of your capital per trade.
Why Use the UDX-5UP?
Simplicity: Clear "Buy" and "Sell" signals make trading accessible even for beginners.
Versatility: Works on any asset (crypto, forex, stocks) and timeframe.
Multiple Confirmations: Combines price, volume, and momentum to reduce false signals.
Customizable: Adjust the settings to match your trading style.
Author’s Notes
The UDX-5UP was developed based on years of trading and technical analysis experience. It is an evolution of tested strategies, designed to help traders navigate volatile markets with confidence. However, no indicator is infallible. Always combine the UDX-5UP with proper risk management and fundamental analysis, especially in unpredictable markets. Feedback is welcome – leave a comment or reach out with suggestions for improvements!
Bitcoin Polynomial Regression ModelThis is the main version of the script. Click here for the Oscillator part of the script.
💡Why this model was created:
One of the key issues with most existing models, including our own Bitcoin Log Growth Curve Model , is that they often fail to realistically account for diminishing returns. As a result, they may present overly optimistic bull cycle targets (hence, we introduced alternative settings in our previous Bitcoin Log Growth Curve Model).
This new model however, has been built from the ground up with a primary focus on incorporating the principle of diminishing returns. It directly responds to this concept, which has been briefly explored here .
📉The theory of diminishing returns:
This theory suggests that as each four-year market cycle unfolds, volatility gradually decreases, leading to more tempered price movements. It also implies that the price increase from one cycle peak to the next will decrease over time as the asset matures. The same pattern applies to cycle lows and the relationship between tops and bottoms. In essence, these price movements are interconnected and should generally follow a consistent pattern. We believe this model provides a more realistic outlook on bull and bear market cycles.
To better understand this theory, the relationships between cycle tops and bottoms are outlined below:https://www.tradingview.com/x/7Hldzsf2/
🔧Creation of the model:
For those interested in how this model was created, the process is explained here. Otherwise, feel free to skip this section.
This model is based on two separate cubic polynomial regression lines. One for the top price trend and another for the bottom. Both follow the general cubic polynomial function:
ax^3 +bx^2 + cx + d.
In this equation, x represents the weekly bar index minus an offset, while a, b, c, and d are determined through polynomial regression analysis. The input (x, y) values used for the polynomial regression analysis are as follows:
Top regression line (x, y) values:
113, 18.6
240, 1004
451, 19128
655, 65502
Bottom regression line (x, y) values:
103, 2.5
267, 211
471, 3193
676, 16255
The values above correspond to historical Bitcoin cycle tops and bottoms, where x is the weekly bar index and y is the weekly closing price of Bitcoin. The best fit is determined using metrics such as R-squared values, residual error analysis, and visual inspection. While the exact details of this evaluation are beyond the scope of this post, the following optimal parameters were found:
Top regression line parameter values:
a: 0.000202798
b: 0.0872922
c: -30.88805
d: 1827.14113
Bottom regression line parameter values:
a: 0.000138314
b: -0.0768236
c: 13.90555
d: -765.8892
📊Polynomial Regression Oscillator:
This publication also includes the oscillator version of the this model which is displayed at the bottom of the screen. The oscillator applies a logarithmic transformation to the price and the regression lines using the formula log10(x) .
The log-transformed price is then normalized using min-max normalization relative to the log-transformed top and bottom regression line with the formula:
normalized price = log(close) - log(bottom regression line) / log(top regression line) - log(bottom regression line)
This transformation results in a price value between 0 and 1 between both the regression lines. The Oscillator version can be found here.
🔍Interpretation of the Model:
In general, the red area represents a caution zone, as historically, the price has often been near its cycle market top within this range. On the other hand, the green area is considered an area of opportunity, as historically, it has corresponded to the market bottom.
The top regression line serves as a signal for the absolute market cycle peak, while the bottom regression line indicates the absolute market cycle bottom.
Additionally, this model provides a predicted range for Bitcoin's future price movements, which can be used to make extrapolated predictions. We will explore this further below.
🔮Future Predictions:
Finally, let's discuss what this model actually predicts for the potential upcoming market cycle top and the corresponding market cycle bottom. In our previous post here , a cycle interval analysis was performed to predict a likely time window for the next cycle top and bottom:
In the image, it is predicted that the next top-to-top cycle interval will be 208 weeks, which translates to November 3rd, 2025. It is also predicted that the bottom-to-top cycle interval will be 152 weeks, which corresponds to October 13th, 2025. On the macro level, these two dates align quite well. For our prediction, we take the average of these two dates: October 24th 2025. This will be our target date for the bull cycle top.
Now, let's do the same for the upcoming cycle bottom. The bottom-to-bottom cycle interval is predicted to be 205 weeks, which translates to October 19th, 2026, and the top-to-bottom cycle interval is predicted to be 259 weeks, which corresponds to October 26th, 2026. We then take the average of these two dates, predicting a bear cycle bottom date target of October 19th, 2026.
Now that we have our predicted top and bottom cycle date targets, we can simply reference these two dates to our model, giving us the Bitcoin top price prediction in the range of 152,000 in Q4 2025 and a subsequent bottom price prediction in the range of 46,500 in Q4 2026.
For those interested in understanding what this specifically means for the predicted diminishing return top and bottom cycle values, the image below displays these predicted values. The new values are highlighted in yellow:
And of course, keep in mind that these targets are just rough estimates. While we've done our best to estimate these targets through a data-driven approach, markets will always remain unpredictable in nature. What are your targets? Feel free to share them in the comment section below.

Bitcoin Polynomial Regression OscillatorThis is the oscillator version of the script. Click here for the other part of the script.
💡Why this model was created:
One of the key issues with most existing models, including our own Bitcoin Log Growth Curve Model , is that they often fail to realistically account for diminishing returns. As a result, they may present overly optimistic bull cycle targets (hence, we introduced alternative settings in our previous Bitcoin Log Growth Curve Model).
This new model however, has been built from the ground up with a primary focus on incorporating the principle of diminishing returns. It directly responds to this concept, which has been briefly explored here .
📉The theory of diminishing returns:
This theory suggests that as each four-year market cycle unfolds, volatility gradually decreases, leading to more tempered price movements. It also implies that the price increase from one cycle peak to the next will decrease over time as the asset matures. The same pattern applies to cycle lows and the relationship between tops and bottoms. In essence, these price movements are interconnected and should generally follow a consistent pattern. We believe this model provides a more realistic outlook on bull and bear market cycles.
To better understand this theory, the relationships between cycle tops and bottoms are outlined below:https://www.tradingview.com/x/7Hldzsf2/
🔧Creation of the model:
For those interested in how this model was created, the process is explained here. Otherwise, feel free to skip this section.
This model is based on two separate cubic polynomial regression lines. One for the top price trend and another for the bottom. Both follow the general cubic polynomial function:
ax^3 +bx^2 + cx + d.
In this equation, x represents the weekly bar index minus an offset, while a, b, c, and d are determined through polynomial regression analysis. The input (x, y) values used for the polynomial regression analysis are as follows:
Top regression line (x, y) values:
113, 18.6
240, 1004
451, 19128
655, 65502
Bottom regression line (x, y) values:
103, 2.5
267, 211
471, 3193
676, 16255
The values above correspond to historical Bitcoin cycle tops and bottoms, where x is the weekly bar index and y is the weekly closing price of Bitcoin. The best fit is determined using metrics such as R-squared values, residual error analysis, and visual inspection. While the exact details of this evaluation are beyond the scope of this post, the following optimal parameters were found:
Top regression line parameter values:
a: 0.000202798
b: 0.0872922
c: -30.88805
d: 1827.14113
Bottom regression line parameter values:
a: 0.000138314
b: -0.0768236
c: 13.90555
d: -765.8892
📊Polynomial Regression Oscillator:
This publication also includes the oscillator version of the this model which is displayed at the bottom of the screen. The oscillator applies a logarithmic transformation to the price and the regression lines using the formula log10(x) .
The log-transformed price is then normalized using min-max normalization relative to the log-transformed top and bottom regression line with the formula:
normalized price = log(close) - log(bottom regression line) / log(top regression line) - log(bottom regression line)
This transformation results in a price value between 0 and 1 between both the regression lines.
🔍Interpretation of the Model:
In general, the red area represents a caution zone, as historically, the price has often been near its cycle market top within this range. On the other hand, the green area is considered an area of opportunity, as historically, it has corresponded to the market bottom.
The top regression line serves as a signal for the absolute market cycle peak, while the bottom regression line indicates the absolute market cycle bottom.
Additionally, this model provides a predicted range for Bitcoin's future price movements, which can be used to make extrapolated predictions. We will explore this further below.
🔮Future Predictions:
Finally, let's discuss what this model actually predicts for the potential upcoming market cycle top and the corresponding market cycle bottom. In our previous post here , a cycle interval analysis was performed to predict a likely time window for the next cycle top and bottom:
In the image, it is predicted that the next top-to-top cycle interval will be 208 weeks, which translates to November 3rd, 2025. It is also predicted that the bottom-to-top cycle interval will be 152 weeks, which corresponds to October 13th, 2025. On the macro level, these two dates align quite well. For our prediction, we take the average of these two dates: October 24th 2025. This will be our target date for the bull cycle top.
Now, let's do the same for the upcoming cycle bottom. The bottom-to-bottom cycle interval is predicted to be 205 weeks, which translates to October 19th, 2026, and the top-to-bottom cycle interval is predicted to be 259 weeks, which corresponds to October 26th, 2026. We then take the average of these two dates, predicting a bear cycle bottom date target of October 19th, 2026.
Now that we have our predicted top and bottom cycle date targets, we can simply reference these two dates to our model, giving us the Bitcoin top price prediction in the range of 152,000 in Q4 2025 and a subsequent bottom price prediction in the range of 46,500 in Q4 2026.
For those interested in understanding what this specifically means for the predicted diminishing return top and bottom cycle values, the image below displays these predicted values. The new values are highlighted in yellow:
And of course, keep in mind that these targets are just rough estimates. While we've done our best to estimate these targets through a data-driven approach, markets will always remain unpredictable in nature. What are your targets? Feel free to share them in the comment section below.

TimeMapTimeMap is a visual price-reference indicator designed to help traders rapidly visualize how current price levels relate to significant historical closing prices. It overlays your chart with reference lines representing past weekly, monthly, quarterly (3-month), semi-annual (6-month), and annual closing prices. By clearly plotting these historical price references, TimeMap helps traders quickly gauge price position relative to historical market structure, aiding in the identification of trends, support/resistance levels, and potential reversals.
How it Works:
The indicator calculates the precise number of historical bars corresponding to weekly, monthly, quarterly, semi-annual, and annual intervals, dynamically adjusting according to your chart’s timeframe (intraday, daily, weekly, monthly) and chosen market type (Stocks US, Crypto, Forex, or Futures). Historical closing prices from these periods are plotted directly on your chart as horizontal reference lines.
For intraday traders, the script accurately calculates historical offsets considering regular and extended trading sessions (e.g., pre-market and after-hours sessions for US stocks), ensuring correct positioning of historical lines.
User-Configurable Inputs Explained in Detail:
Market Type:
Allows you to specify your trading instrument type, automatically adjusting calculations for:
- Stocks US (default): 390 minutes per regular session (780 minutes if extended hours enabled), 5 trading days/week.
- Crypto: 1440 minutes/day, 7 trading days/week.
- Forex: 1440 minutes/day, 5 trading days/week.
- Futures: 1320 minutes/day, 5 trading days/week.
Show Weekly Close:
When enabled, plots a line at the exact closing price from one week ago. Provides short-term context and helps identify recent price momentum.
Show Monthly Close:
When enabled, plots a line at the exact closing price from one month ago. Helpful for evaluating medium-term price positioning and monthly trend strength.
Show 3-Month Close:
When enabled, plots a line at the exact closing price from three months ago. Useful for assessing quarterly market shifts, intermediate trend changes, and broader market sentiment.
Show 6-Month Close:
When enabled, plots a line at the exact closing price from six months ago. Useful for identifying semi-annual trends, significant price pivots, and longer-term support/resistance levels.
Show 1-Year Close:
When enabled, plots a line at the exact closing price from one year ago. Excellent for assessing long-term market direction and key annual price levels.
Enable Smoothing:
Activates a Simple Moving Average (SMA) smoothing of historical reference lines, reducing volatility and providing clearer visual references. Recommended for traders preferring less volatile reference levels.
Smoothing Length:
Determines the number of bars used in calculating the SMA smoothing of historical lines. Higher values result in smoother but slightly delayed reference lines; lower values offer more immediate yet more volatile levels.
Use Extended Hours (Intraday Only):
When enabled (only applicable for Stocks US), it accounts for pre-market and after-hours trading sessions, providing accurate intraday historical line calculations based on extended sessions (typically 780 minutes/day total).
Important Notes and Compliance:
- This indicator does not provide trading signals, recommendations, or predictions. It serves purely as a visual analytical tool to supplement traders’ existing methods.
- Historical lines plotted are strictly based on past available price data; the indicator never accesses future data or data outside the scope of Pine Script’s standard capabilities.
- The script incorporates built-in logic to avoid runtime errors if insufficient historical data exists for a selected timeframe, ensuring robustness even with limited historical bars.
- TimeMap is original work developed exclusively by Julien Eche (@Julien_Eche). It does not reuse or replicate third-party or existing open-source scripts.
Recommended Best Practices:
- Use TimeMap as a complementary analytical reference, not as a standalone strategy or trade decision-making tool.
- Adapt displayed historical periods and smoothing settings based on your trading style and market approach.
- Default plot colors are optimized for readability on dark-background charts; adjust as necessary according to your preference and chart color scheme.
This script is published open-source to benefit the entire TradingView community and fully complies with all TradingView script publishing rules and guidelines.

Highest High Line with Multi-Timeframe Supertrend and RSIOverview:
This powerful indicator combines three essential elements for traders:
Highest High Line – Tracks the highest price over a customizable lookback period across different timeframes.
Multi-Timeframe Supertrend – Displays Supertrend values and trend directions for multiple timeframes simultaneously.
Relative Strength Index (RSI) – Shows RSI values across different timeframes for momentum analysis.
Features:
✅ Customizable Highest High Line:
Selectable timeframes: Daily, Weekly, Monthly, Quarterly, Yearly
Adjustable lookback period
✅ Multi-Timeframe Supertrend:
Supports 1min, 5min, 10min, 15min, 30min, 1H, Daily, Weekly, Monthly, Quarterly, Yearly
ATR-based calculation with configurable ATR period and multiplier
Identifies bullish (green) & bearish (red) trends
✅ Multi-Timeframe RSI:
Calculates RSI for the same timeframes as Supertrend
Overbought (≥70) and Oversold (≤30) signals with color coding
✅ Comprehensive Table Display:
A clean, structured table in the bottom-right corner
Displays Supertrend direction, value, and RSI for all timeframes
Helps traders quickly assess trend and momentum alignment
How to Use:
Use the Highest High Line to identify key resistance zones.
Confirm trend direction with Multi-Timeframe Supertrend.
Check RSI values to avoid overbought/oversold conditions before entering trades.
Align multiple timeframes for stronger confirmation of trend shifts.
Ideal For:
✅ Scalpers (lower timeframes: 1m–30m)
✅ Swing Traders (higher timeframes: 1H–D)
✅ Position Traders (Weekly, Monthly, Quarterly)
💡 Tip: Look for Supertrend & RSI confluence across multiple timeframes for higher probability setups.

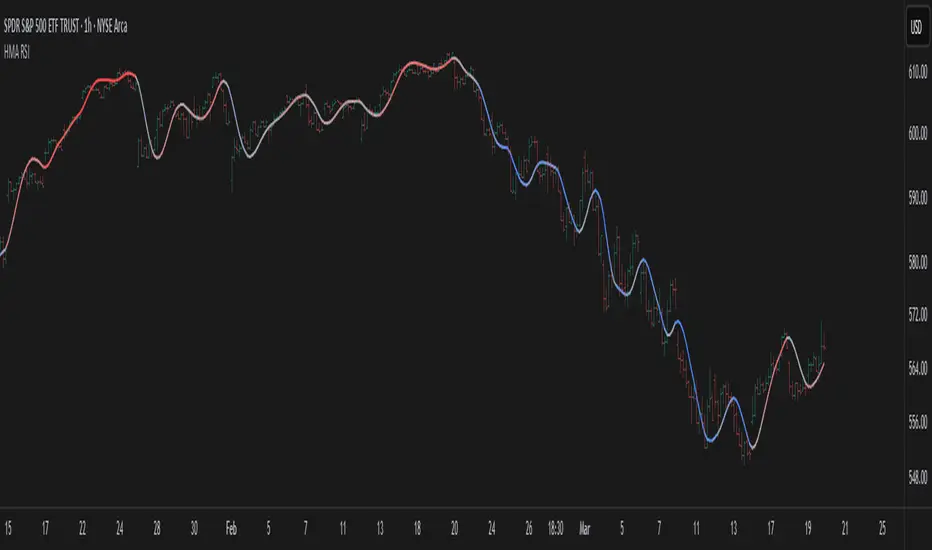
Hull Moving Average Adaptive RSI (Ehlers)Hull Moving Average Adaptive RSI (Ehlers)
The Hull Moving Average Adaptive RSI (Ehlers) is an enhanced trend-following indicator designed to provide a smooth and responsive view of price movement while incorporating an additional momentum-based analysis using the Adaptive RSI.
Principle and Advantages of the Hull Moving Average:
- The Hull Moving Average (HMA) is known for its ability to track price action with minimal lag while maintaining a smooth curve.
- Unlike traditional moving averages, the HMA significantly reduces noise and responds faster to market trends, making it highly effective for detecting trend direction and changes.
- It achieves this by applying a weighted moving average calculation that emphasizes recent price movements while smoothing out fluctuations.
Why the Adaptive RSI Was Added:
- The core HMA line remains the foundation of the indicator, but an additional analysis using the Adaptive RSI has been integrated to provide more meaningful insights into momentum shifts.
- The Adaptive RSI is a modified version of the traditional Relative Strength Index that dynamically adjusts its sensitivity based on market volatility.
- By incorporating the Adaptive RSI, the HMA visually represents whether momentum is strengthening or weakening, offering a complementary layer of analysis.
How the Adaptive RSI Influences the Indicator:
- High Adaptive RSI (above 65): The market may be overbought, or bullish momentum could be fading. The HMA turns shades of red, signaling a possible exhaustion phase or potential reversals.
- Neutral Adaptive RSI (around 50): The market is in a balanced state, meaning neither buyers nor sellers are in clear control. The HMA takes on grayish tones to indicate this consolidation.
- Low Adaptive RSI (below 35): The market may be oversold, or bearish momentum could be weakening. The HMA shifts to shades of blue, highlighting potential recovery zones or trend slowdowns.
Why This Combination is Powerful:
- While the HMA excels in tracking trends and reducing lag, it does not provide information about momentum strength on its own.
- The Adaptive RSI bridges this gap by adding a clear visual layer that helps traders assess whether a trend is likely to continue, consolidate, or reverse.
- This makes the indicator particularly useful for spotting trend exhaustion and confirming momentum shifts in real-time.
Best Use Cases:
- Works effectively on timeframes from 1 hour (1H) to 1 day (1D), making it suitable for swing trading and position trading.
- Particularly useful for trading indices (SPY), stocks, forex, and cryptocurrencies, where momentum shifts are frequent.
- Helps identify not just trend direction but also whether that trend is gaining or losing strength.
Recommended Complementary Indicators:
- Adaptive Trend Finder: Helps identify the dominant long-term trend.
- Williams Fractals Ultimate: Provides key reversal points to validate trend shifts.
- RVOL (Relative Volume): Confirms significant moves based on volume strength.
This enhanced HMA with Adaptive RSI provides a powerful, intuitive visual tool that makes trend analysis and momentum interpretation more effective and efficient.
This indicator is for educational and informational purposes only. It should not be considered financial advice or a guarantee of performance. Always conduct your own research and use proper risk management when trading. Past performance does not guarantee future results.
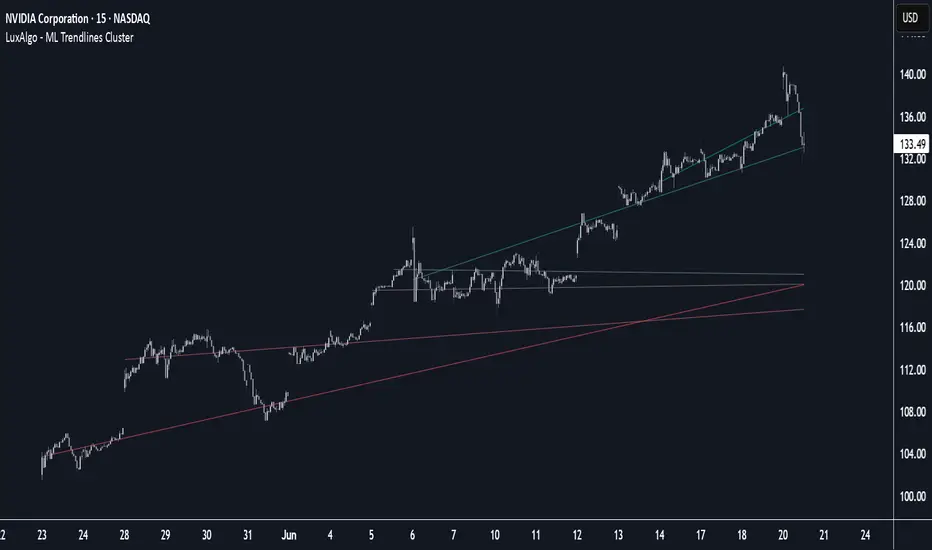
Machine Learning Trendlines Cluster [LuxAlgo]The ML Trendlines Cluster indicator allows traders to automatically identify trendlines using a machine learning algorithm based on k-means clustering and linear regression, highlighting trendlines from clustered prices.
For trader's convenience, trendlines can be filtered based on their slope, allowing them to filter out trendlines that are too horizontal, or instead keep them depending on the user-selected settings.
🔶 USAGE
Traders only need to set the number of trendlines (clusters) they want the tool to detect and the algorithm will do the rest.
By default the tool is set to detect 4 clusters over the last 500 bars, in the image above it is set to detect 10 clusters over the same period.
This approach only focuses on drawing trendlines from prices that share a common trading range, offering a unique perspective to traditional trendlines. Trendlines with a significant slope can highlight higher dispersion within its cluster.
🔹 Trendline Slope Filtering
Traders can filter trendlines by their slope to display only steep or flat trendlines relative to a user-defined threshold.
The image above shows the three different configurations of this feature:
Filtering disabled
Filter slopes above threshold
Filter slopes below threshold
🔶 DETAILS
K-means clustering is a popular machine-learning algorithm that finds observations in a data set that are similar to each other and places them in a group.
The process starts by randomly assigning each data point to an initial group and calculating the centroid for each. A centroid is the center of the group. K-means clustering forms the groups in such a way that the variances between the data points and the centroid of the cluster are minimized.
The trendlines are displayed according to the linear regression function calculated for each cluster.
🔶 SETTINGS
Window Size: Maximum number of bars to get data from
Clusters: Maximum number of clusters (trendlines) to detect
🔹 Optimization
Maximum Iteration Steps: Maximum loop iterations for cluster computation
🔹 Slope Filter
Threshold Multiplier: Multiplier applied to a volatility measure, higher multiplier equals higher threshold
Filter Slopes: Enable/Disable Trendline Slope Filtering, select to filter trendlines with slopes ABOVE or BELOW the threshold
🔹 Style
Upper Zone: Color to display in the top zone
Lower Zone: Color to display in the bottom zone
Lines: Style for the lines
Size: Line size
Lowess Channel + (RSI) [ChartPrime]The Lowess Channel + (RSI) indicator applies the LOWESS (Locally Weighted Scatterplot Smoothing) algorithm to filter price fluctuations and construct a dynamic channel. LOWESS is a non-parametric regression method that smooths noisy data by fitting weighted linear regressions at localized segments. This technique is widely used in statistical analysis to reveal trends while preserving data structure.
In this indicator, the LOWESS algorithm is used to create a central trend line and deviation-based bands. The midline changes color based on trend direction, and diamonds are plotted when a trend shift occurs. Additionally, an RSI gauge is positioned at the end of the channel to display the current RSI level in relation to the price bands.
lowess_smooth(src, length, bandwidth) =>
sum_weights = 0.0
sum_weighted_y = 0.0
sum_weighted_xy = 0.0
sum_weighted_x2 = 0.0
sum_weighted_x = 0.0
for i = 0 to length - 1
x = float(i)
weight = math.exp(-0.5 * (x / bandwidth) * (x / bandwidth))
y = nz(src , 0)
sum_weights := sum_weights + weight
sum_weighted_x := sum_weighted_x + weight * x
sum_weighted_y := sum_weighted_y + weight * y
sum_weighted_xy := sum_weighted_xy + weight * x * y
sum_weighted_x2 := sum_weighted_x2 + weight * x * x
mean_x = sum_weighted_x / sum_weights
mean_y = sum_weighted_y / sum_weights
beta = (sum_weighted_xy - mean_x * mean_y * sum_weights) / (sum_weighted_x2 - mean_x * mean_x * sum_weights)
alpha = mean_y - beta * mean_x
alpha + beta * float(length / 2) // Centered smoothing
⯁ KEY FEATURES
LOWESS Price Filtering – Smooths price fluctuations to reveal the underlying trend with minimal lag.
Dynamic Trend Coloring – The midline changes color based on trend direction (e.g., bullish or bearish).
Trend Shift Diamonds – Marks points where the midline color changes, indicating a possible trend shift.
Deviation-Based Bands – Expands above and below the midline using ATR-based multipliers for volatility tracking.
RSI Gauge Display – A vertical gauge at the right side of the chart shows the current RSI level relative to the price channel.
Fully Customizable – Users can adjust LOWESS length, band width, colors, and enable or disable the RSI gauge and adjust RSIlength.
⯁ HOW TO USE
Use the LOWESS midline as a trend filter —bullish when green, bearish when purple.
Watch for trend shift diamonds as potential entry or exit signals.
Utilize the price bands to gauge overbought and oversold zones based on volatility.
Monitor the RSI gauge to confirm trend strength—high RSI near upper bands suggests overbought conditions, while low RSI near lower bands indicates oversold conditions.
⯁ CONCLUSION
The Lowess Channel + (RSI) indicator offers a powerful way to analyze market trends by applying a statistically robust smoothing algorithm. Unlike traditional moving averages, LOWESS filtering provides a flexible, responsive trendline that adapts to price movements. The integrated RSI gauge enhances decision-making by displaying momentum conditions alongside trend dynamics. Whether used for trend-following or mean reversion strategies, this indicator provides traders with a well-rounded perspective on market behavior.

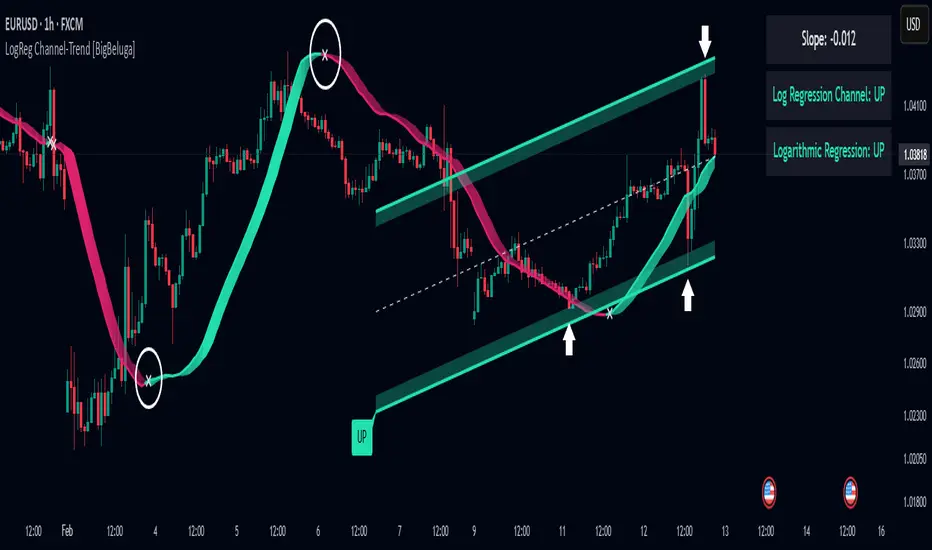
Logarithmic Regression Channel-Trend [BigBeluga]
This indicator utilizes logarithmic regression to track price trends and identify overbought and oversold conditions within a trend. It provides traders with a dynamic channel based on logarithmic regression, offering insights into trend strength and potential reversal zones.
🔵Key Features:
Logarithmic Regression Trend Tracking: Uses log regression to model price trends and determine trend direction dynamically.
f_log_regression(src, length) =>
float sumX = 0.0
float sumY = 0.0
float sumXSqr = 0.0
float sumXY = 0.0
for i = 0 to length - 1
val = math.log(src )
per = i + 1.0
sumX += per
sumY += val
sumXSqr += per * per
sumXY += val * per
slope = (length * sumXY - sumX * sumY) / (length * sumXSqr - sumX * sumX)
average = sumY / length
intercept = average - slope * sumX / length + slope
Regression-Based Channel: Plots a log regression channel around the price to highlight overbought and oversold conditions.
Adaptive Trend Colors: The color of the regression trend adjusts dynamically based on price movement.
Trend Shift Signals: Marks trend reversals when the log regression line cross the log regression line 3 bars back.
Dashboard for Key Insights: Displays:
- The regression slope (multiplied by 100 for better scale).
- The direction of the regression channel.
- The trend status of the logarithmic regression band.
🔵Usage:
Trend Identification: Observe the regression slope and channel direction to determine bullish or bearish trends.
Overbought/Oversold Conditions: Use the channel boundaries to spot potential reversal zones when price deviates significantly.
Breakout & Continuation Signals: Price breaking outside the channel may indicate strong trend continuation or exhaustion.
Confirmation with Other Indicators: Combine with volume or momentum indicators to strengthen trend confirmation.
Customizable Display: Users can modify the lookback period, channel width, midline visibility, and color preferences.
Logarithmic Regression Channel-Trend is an essential tool for traders who want a dynamic, regression-based approach to market trends while monitoring potential price extremes.
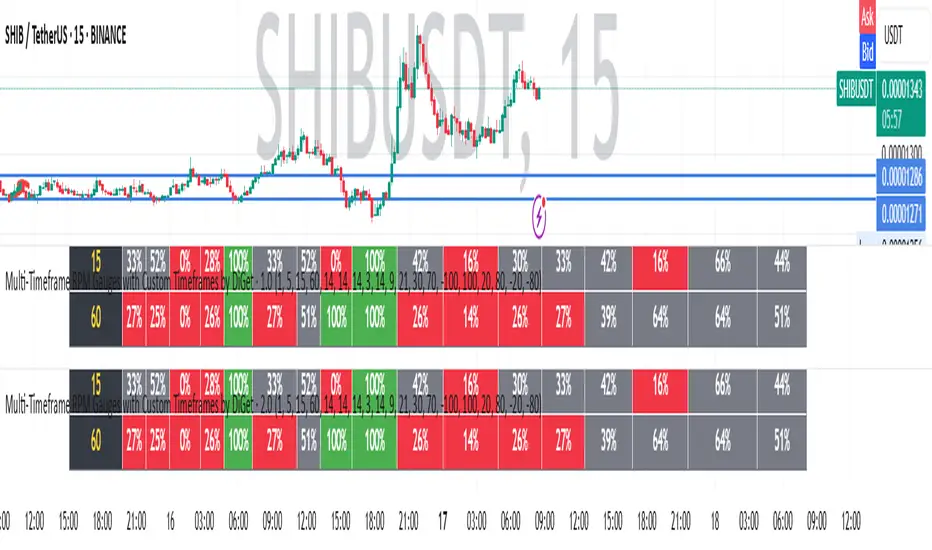
Multi-Timeframe RPM Gauges with Custom Timeframes by DiGetIntroducing the **Multi-Timeframe RPM Gauges with Custom Timeframes + RSI Combos (mod) by DiGet** – a cutting-edge TradingView indicator meticulously crafted to revolutionize your market analysis.
Imagine having a dynamic dashboard right on your chart that consolidates the power of nine essential technical indicators—RSI, CCI, Stochastic, Williams %R, EMA crossover, Bollinger Bands, ATR, MACD, and Ichimoku Cloud—across multiple timeframes. This indicator not only displays each indicator’s score through an intuitive gauge system but also computes a combined metric to provide you with an at-a-glance understanding of market momentum and potential trend shifts.
**Key Features:**
- **Multi-Timeframe Insight:**
Configure up to four custom timeframes (e.g., 1, 5, 15, 60 minutes) to capture both short-term fluctuations and long-term trends, ensuring you never miss critical market moves.
- **Comprehensive Signal Suite:**
Benefit from a harmonious blend of signals. Whether you rely on momentum indicators like RSI and CCI, volatility measures like Bollinger Bands and ATR, or trend confirmations via EMA, MACD, and Ichimoku, every metric is normalized into actionable percentages.
- **Dynamic, Color-Coded Gauge Display:**
A built-in table presents all your data in a clear, color-coded format—green for bullish, red for bearish, and gray for neutral conditions. This visual representation allows you to quickly gauge market sentiment without sifting through complex charts.
- **Customizable Layout:**
Tailor your experience by toggling individual table columns. Whether you want to focus solely on RSI or dive deep into combined metrics like RSI & CCI or RSI & MACD, the choice is yours.
- **Optimized Utility Functions:**
Proprietary functions standardize indicator values into percentage scores, making it simpler than ever to compare different signals and spot opportunities in real time.
- **User-Friendly Interface:**
Designed for both beginners and seasoned traders, the straightforward input settings let you easily adjust technical parameters and timeframes to suit your personal trading strategy.
This indicator is not just a tool—it’s your new trading companion. It equips you with a multi-dimensional view of the market, enabling faster, more informed decision-making. Whether you’re scanning across various assets or drilling down on a single chart, the Multi-Timeframe RPM Gauges empower you to interpret market data with unprecedented clarity.
Add this indicator to your TradingView chart today and experience a smarter, more efficient way to navigate the markets. Join the community of traders who have elevated their analysis—and be ready to receive countless thanks as you transform your trading strategy!
RSI with Trend LinesThe RSI with Trend Lines indicator is a tool designed to analyze the behavior of the Relative Strength Index (RSI) combined with dynamic trend lines. This indicator not only provides the standard RSI reading but also identifies pivot points on the RSI and draws bullish and bearish trend lines based on these points. It also includes customizable options for adjusting trend lines, displaying the RSI moving average, and highlighting key levels such as overbought, oversold, and the center line.
This indicator is ideal for finding and identifying clear trends in the RSI and taking advantage of market breakout or consolidation signals. It also includes a table with the POC value, which represents the price level at which the most trading activity has occurred, indicating the highest liquidity and highest trading volume.
Key Features:
1. Basic RSI:
• Calculates the RSI using a configurable period length (default 14).
• Colors the RSI based on its direction (green for rising, red for falling) and its position relative to the center line (50).
2. Key Levels:
• Displays overbought (70 and 80), oversold (20 and 30), and the center line (50) levels for easy visual interpretation.
3. RSI Moving Average:
• Enables and configures an RSI moving average (SMA, EMA, WMA, or ALMA) to smooth out fluctuations and detect clearer trends.
4. Dynamic Trend Lines:
• Identifies pivot points on the RSI and draws bullish and bearish trend lines.
• Trend lines can be extended into the future or limited to the visible range.
• Includes options to display broken lines (trends that are no longer valid) and customize the style (solid or dashed).
5. Pivot Points:
• Displays the high and low pivot points on the chart for a better understanding of trend changes.
6. Advanced Customization:
• Adjust the pivot point period.
• Control the number of pivot points to consider for trend lines.
• Customize the line thickness and style.
How to Use the Indicator:
1. RSI Interpretation:
• Overbought Zone (RSI > 70): Indicates that the asset may be overvalued and could correct downward.
• Oversold Zone (RSI < 30): Suggests that the asset may be undervalued and could rebound.
• Centerline Crossover (50): A cross above 50 indicates bullish strength, while a cross below suggests weakness.
2. Trend Lines:
• Bullish Lines: Drawn when the RSI forms ascending low pivot points. These lines represent dynamic support.
• Bearish Lines: These are drawn when the RSI forms descending high pivot points. These lines represent dynamic resistance.
• Broken Lines: When a trend line becomes invalid (the RSI breaks the line), they are displayed in a dotted style to highlight the breakout.
3. Possible Trading Signals:
• Buy: When the RSI breaks an upward downtrend line.
• Sell: When the RSI breaks a downward uptrend line.
• Trend Confirmation: When the RSI stays within a valid trend line, it suggests that the current trend is strong.
4. A chart with the POC value:
• The point of control is a price level at which the highest trading volume occurs in a given time period. It is a key component of the Volume Profile indicator, which displays volume by price.
• Use of the POC in trading:
• The POC is used to identify areas of high interest and liquidity for trading.
• The POC provides information about the equilibrium point where buyers and sellers are most evenly matched.
• Therefore, it can be considered a zone of interest, meaning it can act as support or resistance.

DenP Ichimoku Interpreter (DII)A simple indicator using Ishimoku as a basis, giving entry and exit signals.
Components of the Ichimoku Cloud
The Ichimoku system consists of multiple lines that help traders understand market trends, momentum, and potential reversals.
1. Tenkan-Sen (Conversion Line) - Blue
Formula: (Highest High + Lowest Low) / 2 over the last 9 periods (default).
Purpose: Measures short-term trend direction.
Interpretation:
Upward movement: Indicates bullish momentum.
Downward movement: Indicates bearish momentum.
Flat line: Indicates consolidation.
2. Kijun-Sen (Base Line) - Red
Formula: (Highest High + Lowest Low) / 2 over the last 26 periods (default).
Purpose: Represents medium-term trend.
Interpretation:
Price above Kijun-Sen: Bullish signal.
Price below Kijun-Sen: Bearish signal.
Flat Kijun-Sen: Market in consolidation.
3. Senkou Span A (Leading Span A) - Light Green
Formula: (Tenkan-Sen + Kijun-Sen) / 2, plotted 26 periods ahead.
Purpose: Forms one of the Ichimoku Cloud boundaries.
Interpretation:
If Senkou Span A is rising, the market is bullish.
If Senkou Span A is falling, the market is bearish.
4. Senkou Span B (Leading Span B) - Light Red
Formula: (Highest High + Lowest Low) / 2 over the last 52 periods, plotted 26 periods ahead.
Purpose: Forms the second boundary of the Ichimoku Cloud.
Interpretation:
If price is above the cloud, the market is in a strong uptrend.
If price is below the cloud, the market is in a strong downtrend.
If price is inside the cloud, the market is consolidating.
5. Kumo (Cloud)
The area between Senkou Span A and Senkou Span B is shaded.
Green Cloud (Span A above Span B): Bullish trend.
Red Cloud (Span B above Span A): Bearish trend.
The thickness of the cloud represents market volatility.
6. Chikou Span (Lagging Line) - Green
Formula: Current closing price plotted 26 periods back.
Purpose: Confirms trend direction.
Interpretation:
Chikou Span above price 26 periods ago: Bullish.
Chikou Span below price 26 periods ago: Bearish.
Buy and Sell Conditions
The indicator generates buy and sell signals based on Ichimoku components.
1. Kijun Cross (Medium-Term Trend)
Buy Signal: When the closing price crosses above the Kijun-Sen (red line).
Sell Signal: When the closing price crosses below the Kijun-Sen.
2. Cloud Breakout (Senkou Span Cross)
Buy Signal:
When Senkou Span A is above Senkou Span B, and the price crosses above the cloud.
Indicates a strong uptrend.
Sell Signal:
When Senkou Span B is above Senkou Span A, and the price crosses below the cloud.
Indicates a strong downtrend.
3. Chikou Span Confirmation (Momentum Confirmation)
Buy Signal:
If Chikou Span (green) crosses above past price action, it confirms a bullish trend.
Used to validate Kijun and Cloud Buy signals.
Sell Signal:
If Chikou Span crosses below past price action, it confirms a bearish trend.
Visual Signals
The indicator plots triangles on the chart to indicate buy and sell signals:
Kijun Buy Signal: Upward triangle (green).
Kijun Sell Signal: Downward triangle (red).
Cloud Buy Signal: Upward triangle (green) near the cloud.
Cloud Sell Signal: Downward triangle (red) near the cloud.
Chikou Confirmation Buy: Upward triangle (green, confirming previous signals).
Chikou Confirmation Sell: Downward triangle (red, confirming previous signals).
Additional Features
Customizable Colors & Settings: Users can adjust colors, time periods, and display settings.
On-Chart Table: Displays current trend interpretations for easy reference.
How to Use the Indicator?
Check the Cloud Position:
Price above the cloud = bullish.
Price below the cloud = bearish.
Price inside the cloud = consolidation.
Look for Kijun Crosses:
Buy when price crosses above Kijun-Sen.
Sell when price crosses below Kijun-Sen.
Confirm with Chikou Span:
If Chikou Span supports the buy/sell signal, it's more reliable.
Use Cloud Breakouts for Trend Reversals:
If price moves from below to above the cloud = strong buy.
If price moves from above to below the cloud = strong sell.
Adaptive Trend FinderAdaptive Trend Finder - The Ultimate Trend Detection Tool
Introducing Adaptive Trend Finder, the next evolution of trend analysis on TradingView. This powerful indicator is an enhanced and refined version of Adaptive Trend Finder (Log), designed to offer even greater flexibility, accuracy, and ease of use.
What’s New?
Unlike the previous version, Adaptive Trend Finder allows users to fully configure and adjust settings directly within the indicator menu, eliminating the need to modify chart settings manually. A major improvement is that users no longer need to adjust the chart's logarithmic scale manually in the chart settings; this can now be done directly within the indicator options, ensuring a smoother and more efficient experience. This makes it easier to switch between linear and logarithmic scaling without disrupting the analysis. This provides a seamless user experience where traders can instantly adapt the indicator to their needs without extra steps.
One of the most significant improvements is the complete code overhaul, which now enables simultaneous visualization of both long-term and short-term trend channels without needing to add the indicator twice. This not only improves workflow efficiency but also enhances chart readability by allowing traders to monitor multiple trend perspectives at once.
The interface has been entirely redesigned for a more intuitive user experience. Menus are now clearer, better structured, and offer more customization options, making it easier than ever to fine-tune the indicator to fit any trading strategy.
Key Features & Benefits
Automatic Trend Period Selection: The indicator dynamically identifies and applies the strongest trend period, ensuring optimal trend detection with no manual adjustments required. By analyzing historical price correlations, it selects the most statistically relevant trend duration automatically.
Dual Channel Display: Traders can view both long-term and short-term trend channels simultaneously, offering a broader perspective of market movements. This feature eliminates the need to apply the indicator twice, reducing screen clutter and improving efficiency.
Fully Adjustable Settings: Users can customize trend detection parameters directly within the indicator settings. No more switching chart settings – everything is accessible in one place.
Trend Strength & Confidence Metrics: The indicator calculates and displays a confidence score for each detected trend using Pearson correlation values. This helps traders gauge the reliability of a given trend before making decisions.
Midline & Channel Transparency Options: Users can fine-tune the visibility of trend channels, adjusting transparency levels to fit their personal charting style without overwhelming the price chart.
Annualized Return Calculation: For daily and weekly timeframes, the indicator provides an estimate of the trend’s performance over a year, helping traders evaluate potential long-term profitability.
Logarithmic Adjustment Support: Adaptive Trend Finder is compatible with both logarithmic and linear charts. Traders who analyze assets like cryptocurrencies, where log scaling is common, can enable this feature to refine trend calculations.
Intuitive & User-Friendly Interface: The updated menu structure is designed for ease of use, allowing quick and efficient modifications to settings, reducing the learning curve for new users.
Why is this the Best Trend Indicator?
Adaptive Trend Finder stands out as one of the most advanced trend analysis tools available on TradingView. Unlike conventional trend indicators, which rely on fixed parameters or lagging signals, Adaptive Trend Finder dynamically adjusts its settings based on real-time market conditions. By combining automatic trend detection, dual-channel visualization, real-time performance metrics, and an intuitive user interface, this indicator offers an unparalleled edge in trend identification and trading decision-making.
Traders no longer have to rely on guesswork or manually tweak settings to identify trends. Adaptive Trend Finder does the heavy lifting, ensuring that users are always working with the strongest and most reliable trends. The ability to simultaneously display both short-term and long-term trends allows for a more comprehensive market overview, making it ideal for scalpers, swing traders, and long-term investors alike.
With its state-of-the-art algorithms, fully customizable interface, and professional-grade accuracy, Adaptive Trend Finder is undoubtedly one of the most powerful trend indicators available.
Try it today and experience the future of trend analysis.
This indicator is a technical analysis tool designed to assist traders in identifying trends. It does not guarantee future performance or profitability. Users should conduct their own research and apply proper risk management before making trading decisions.
// Created by Julien Eche - @Julien_Eche
Market Structure MTF Trend [Pt]█ Author's Notes
There are numerous market structure indicators in the TradingView library, each offering a unique approach to identifying price action shifts. Market Structure MTF Trend was created with simplicity and flexibility in mind—providing a highly customizable multi-timeframe setup, visually clear trendlines, and straightforward labeling. This combination helps both new and experienced traders easily spot and interpret market structure changes.
█ Overview
Market Structure MTF Trend is a powerful yet user-friendly indicator designed to identify and visualize key turning points in price action. It focuses on two core concepts:
Change of Character (CHoCH): A momentary shift in the market’s behavior, signaling that the current price movement may be losing momentum and could soon reverse.
Break of Structure (BoS): A more definitive event confirming a new price pattern, where the market establishes a fresh trend direction by surpassing previous swing highs or lows.
By combining these signals across up to four different timeframes, even traders unfamiliar with market structure can quickly learn to spot and validate potential trend reversals or continuations.
█ Key Features
Multi-Timeframe Analysis: Monitors CHoCH and BoS events simultaneously on multiple intervals (e.g., 15m, 30m, 60m, 240m), providing a clear, layered understanding of market dynamics.
Straightforward Visual Cues: Labels are placed directly on the chart at swing highs and lows, while colored bars at the bottom give an instant snapshot of whether each timeframe is bullish or bearish.
Configurable Timeframes & Pivot Strength: Easily set up the desired intervals and adjust pivot strength to tune how sensitive the indicator is to minor price fluctuations.
Color-Coded Signals: Different colors help you distinguish between potential early reversals (CHoCH) and confirmed shifts (BoS), ensuring each signal’s importance is immediately clear.
█ Usage & Benefits
Learn Market Structure Basics: For those new to swing highs/lows, CHoCH, and BoS, the script’s on-chart labels and dynamic bar coloring provide a practical, visual way to grasp these concepts.
Spot Reversals Early: CHoCH alerts you to possible shifts in momentum, allowing you to anticipate trend changes before they fully develop.
Confirm Trend Breaks: BoS events confirm that the market has established a new directional bias, reinforcing higher‐probability entry or exit points.
Reduce Noise & Stay Focused: The multi-timeframe setup ensures you won’t overlook larger trends or get lost in smaller fluctuations.
Streamline Decision-Making: Color-coded bars let you gauge overall market sentiment at a glance—ideal for quickly validating trades without juggling multiple charts.
Market Structure MTF Trend is perfect for traders who want to learn or refine their understanding of price action. By integrating multiple timeframes into a single, cohesive interface, this tool highlights both subtle shifts and confirmed breaks in market structure, empowering you to trade with greater insight and confidence.