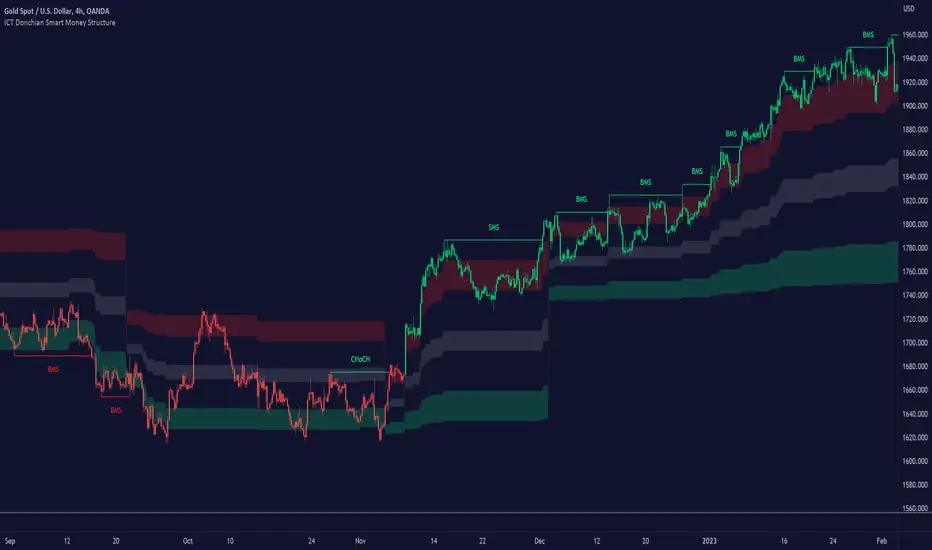
ICT Donchian Smart Money Structure (Expo)█ Concept Overview
The Inner Circle Trader (ICT) methodology is focused on understanding the actions and implications of the so-called "smart money" - large institutions and professional traders who often influence market movements. Key to this is the concept of market structure and how it can provide insights into potential price moves.
Over time, however, there has been a notable shift in how some traders interpret and apply this methodology. Initially, it was designed with a focus on the fractal nature of markets. Fractals are recurring patterns in price action that are self-similar across different time scales, providing a nuanced and dynamic understanding of market structure.
However, as the ICT methodology has grown in popularity, there has been a drift away from this fractal-based perspective. Instead, many traders have started to focus more on pivot points as their primary tool for understanding market structure.
Pivot points provide static levels of potential support and resistance. While they can be useful in some contexts, relying heavily on them could provide a skewed perspective of market structure. They offer a static, backward-looking view that may not accurately reflect real-time changes in market sentiment or the dynamic nature of markets.
This shift from a fractal-based perspective to a pivot point perspective has significant implications. It can lead traders to misinterpret market structure and potentially make incorrect trading decisions.
To highlight this issue, you've developed a Donchian Structure indicator that mirrors the use of pivot points. The Donchian Channels are formed by the highest high and the lowest low over a certain period, providing another representation of potential market extremes. The fact that the Donchian Structure indicator produces the same results as pivot points underscores the inherent limitations of relying too heavily on these tools.
While the Donchian Structure indicator or pivot points can be useful tools, they should not replace the original, fractal-based perspective of the ICT methodology. These tools can provide a broad overview of market structure but may not capture the intricate dynamics and real-time changes that a fractal-based approach can offer.
It's essential for traders to understand these differences and to apply these tools correctly within the broader context of the ICT methodology and the Smart Money Concept Structure. A well-rounded approach that incorporates fractals, along with other tools and forms of analysis, is likely to provide a more accurate and comprehensive understanding of market structure.
█ Smart Money Concept - Misunderstandings
The Smart Money Concept is a popular concept among traders, and it's based on the idea that the "smart money" - typically large institutional investors, market makers, and professional traders - have superior knowledge or information, and their actions can provide valuable insight for other traders.
One of the biggest misunderstandings with this concept is the belief that tracking smart money activity can guarantee profitable trading.
█ Here are a few common misconceptions:
Following Smart Money Equals Guaranteed Success: Many traders believe that if they can follow the smart money, they will be successful. However, tracking the activity of large institutional investors and other professionals isn't easy, as they use complex strategies, have access to information not available to the public, and often intentionally hide their moves to prevent others from detecting their strategies.
Instantaneous Reaction and Results: Another misconception is that market movements will reflect smart money actions immediately. However, large institutions often slowly accumulate or distribute positions over time to avoid moving the market drastically. As a result, their actions might not produce an immediate noticeable effect on the market.
Smart Money Always Wins: It's not accurate to assume that smart money always makes the right decisions. Even the most experienced institutional investors and professional traders make mistakes, misjudge market conditions, or are affected by unpredictable events.
Smart Money Activity is Transparent: Understanding what constitutes smart money activity can be quite challenging. There are many indicators and metrics that traders use to try and track smart money, such as the COT (Commitments of Traders) reports, Level II market data, block trades, etc. However, these can be difficult to interpret correctly and are often misleading.
Assuming Uniformity Among Smart Money: 'Smart Money' is not a monolithic entity. Different institutional investors and professional traders have different strategies, risk tolerances, and investment horizons. What might be a good trade for a long-term institutional investor might not be a good trade for a short-term professional trader, and vice versa.
█ Market Structure
The Smart Money Concept Structure deals with the interpretation of price action that forms the market structure, focusing on understanding key shifts or changes in the market that may indicate where 'smart money' (large institutional investors and professional traders) might be moving in the market.
█ Three common concepts in this regard are Change of Character (CHoCH), and Shift in Market Structure (SMS), Break of Structure (BMS/BoS).
Change of Character (CHoCH): This refers to a noticeable change in the behavior of price movement, which could suggest that a shift in the market might be about to occur. This might be signaled by a sudden increase in volatility, a break of a trendline, or a change in volume, among other things.
Shift in Market Structure (SMS): This is when the overall structure of the market changes, suggesting a potential new trend. It usually involves a sequence of lower highs and lower lows for a downtrend, or higher highs and higher lows for an uptrend.
Break of Structure (BMS/BoS): This is when a previously defined trend or pattern in the price structure is broken, which may suggest a trend continuation.
A key component of this approach is the use of fractals, which are repeating patterns in price action that can give insights into potential market reversals. They appear at all scales of a price chart, reflecting the self-similar nature of markets.
█ Market Structure - Misunderstandings
One of the biggest misunderstandings about the ICT approach is the over-reliance or incorrect application of pivot points. Pivot points are a popular tool among traders due to their simplicity and easy-to-understand nature. However, when it comes to the Smart Money Concept and trying to follow the steps of professional traders or large institutions, relying heavily on pivot points can create misconceptions and lead to confusion. Here's why:
Delayed and Static Information: Pivot points are inherently backward-looking because they're calculated based on the previous period's data. As such, they may not reflect real-time market dynamics or sudden changes in market sentiment. Furthermore, they present a static view of market structure, delineating pre-defined levels of support and resistance. This static nature can be misleading because markets are fundamentally dynamic and constantly changing due to countless variables.
Inadequate Representation of Market Complexity: Markets are influenced by a myriad of factors, including economic indicators, geopolitical events, institutional actions, and market sentiment, among others. Relying on pivot points alone for reading market structure oversimplifies this complexity and can lead to a myopic understanding of market dynamics.
False Signals and Misinterpretations: Pivot points can often give false signals, especially in volatile markets. Prices might react to these levels temporarily but then continue in the original direction, leading to potential misinterpretation of market structure and sentiment. Also, a trader might wrongly perceive a break of a pivot point as a significant market event, when in fact, it could be due to random price fluctuations or temporary volatility.
Over-simplification: Viewing market structure only through the lens of pivot points simplifies the market to static levels of support and resistance, which can lead to misinterpretation of market dynamics. For instance, a trader might view a break of a pivot point as a definite sign of a trend, when it could just be a temporary price spike.
Ignoring the Fractal Nature of Markets: In the context of the Smart Money Concept Structure, understanding the fractal nature of markets is crucial. Fractals are self-similar patterns that repeat at all scales and provide a more dynamic and nuanced understanding of market structure. They can help traders identify shifts in market sentiment or direction in real-time, providing more relevant and timely information compared to pivot points.
The key takeaway here is not that pivot points should be entirely avoided or that they're useless. They can provide valuable insights and serve as a useful tool in a trader's toolbox when used correctly. However, they should not be the sole or primary method for understanding the market structure, especially in the context of the Smart Money Concept Structure.
█ Fractals
Instead, traders should aim for a comprehensive understanding of markets that incorporates a range of tools and concepts, including but not limited to fractals, order flow, volume analysis, fundamental analysis, and, yes, even pivot points. Fractals offer a more dynamic and nuanced view of the market. They reflect the recursive nature of markets and can provide valuable insights into potential market reversals. Because they appear at all scales of a price chart, they can provide a more holistic and real-time understanding of market structure.
In contrast, the Smart Money Concept Structure, focusing on fractals and comprehensive market analysis, aims to capture a more holistic and real-time view of the market. Fractals, being self-similar patterns that repeat at different scales, offer a dynamic understanding of market structure. As a result, they can help to identify shifts in market sentiment or direction as they happen, providing a more detailed and timely perspective.
Furthermore, a comprehensive market analysis would consider a broader set of factors, including order flow, volume analysis, and fundamental analysis, which could provide additional insights into 'smart money' actions.
█ Donchian Structure
Donchian Channels are a type of indicator used in technical analysis to identify potential price breakouts and trends, and they may also serve as a tool for understanding market structure. The channels are formed by taking the highest high and the lowest low over a certain number of periods, creating an envelope of price action.
Donchian Channels (or pivot points) can be useful tools for providing a general view of market structure, and they may not capture the intricate dynamics associated with the Smart Money Concept Structure. A more nuanced approach, centered on real-time fractals and a comprehensive analysis of various market factors, offers a more accurate understanding of 'smart money' actions and market structure.
█ Here is why Donchian Structure may be misleading:
Lack of Nuance: Donchian Channels, like pivot points, provide a simplified view of market structure. They don't take into account the nuanced behaviors of price action or the complex dynamics between buyers and sellers that can be critical in the Smart Money Concept Structure.
Limited Insights into 'Smart Money' Actions: While Donchian Channels can highlight potential breakout points and trends, they don't necessarily provide insights into the actions of 'smart money'. These large institutional traders often use sophisticated strategies that can't be easily inferred from price action alone.
█ Indicator Overview
We have built this Donchian Structure indicator to show that it returns the same results as using pivot points. The Donchian Structure indicator can be a useful tool for market analysis. However, it should not be seen as a direct replacement or equivalent to the original Smart Money concept, nor should any indicator based on pivot points. The indicator highlights the importance of understanding what kind of trading tools we use and how they can affect our decisions.
The Donchian Structure Indicator displays CHoCH, SMS, BoS/BMS, as well as premium and discount areas. This indicator plots everything in real-time and allows for easy backtesting on any market and timeframe. A unique candle coloring has been added to make it more engaging and visually appealing when identifying new trading setups and strategies. This candle coloring is "leading," meaning it can signal a structural change before it actually happens, giving traders ample time to plan their next trade accordingly.
█ How to use
The indicator is great for traders who want to simplify their view on the market structure and easily backtest Smart Money Concept Strategies. The added candle coloring function serves as a heads-up for structure change or can be used as trend confirmation. This new candle coloring feature can generate many new Smart Money Concepts strategies.
█ Features
Market Structure
The market structure is based on the Donchian channel, to which we have added what we call 'Structure Response'. This addition makes the indicator more useful, especially in trending markets. The core concept involves traders buying at a discount and selling or shorting at a premium, depending on the order flow. Structure response enables traders to determine the order flow more clearly. Consequently, more trading opportunities will appear in trending markets.
Structure Candles
Structure Candles highlight the current order flow and are significantly more responsive to structural changes. They can provide traders with a heads-up before a break in structure occurs
-----------------
Disclaimer
The information contained in my Scripts/Indicators/Ideas/Algos/Systems does not constitute financial advice or a solicitation to buy or sell any securities of any type. I will not accept liability for any loss or damage, including without limitation any loss of profit, which may arise directly or indirectly from the use of or reliance on such information.
All investments involve risk, and the past performance of a security, industry, sector, market, financial product, trading strategy, backtest, or individual's trading does not guarantee future results or returns. Investors are fully responsible for any investment decisions they make. Such decisions should be based solely on an evaluation of their financial circumstances, investment objectives, risk tolerance, and liquidity needs.
My Scripts/Indicators/Ideas/Algos/Systems are only for educational purposes!
Sentiment
Cumulative TICK Trend[Pt]Cumulative TICK Trend indicator is a comprehensive trading tool that uses TICK data to define the market's cumulative trend. Trend is shown on ATR EMA bands, which is overlaid on the price chart. Cumulative TICK shown on the bottom pane is for reference only.
Main features of the Cumulative TICK Trend Indicator include:
Selectable TICK Source: You have the flexibility to choose your preferred TICK source from the following options, depending on the market you trade: USI:TICK, USI:TICKQ, USI:TICKI, and USI:TICKA.
TICK Data Type: Select the type of TICK data to use, options include: Close, Open, hl2, ohlc4, hlc3.
Simple Moving Average (SMA): You can choose to apply an SMA on the calculated Cumulative TICK values with a customizable length.
Average True Range (ATR) Bands: It provides the option to display ATR bands with adjustable settings. This includes the ATR period, EMA period, source for the ATR calculation, and the ATR multiplier for the upper band.
Trend Color Customization: You can customize the color of the bull and bear trends according to your preference.
Smooth Line Option: This setting allows you to smooth the ATR Bands with a customizable length.
How it Works:
This indicator accumulates TICK data during market hours (9:30-16:00) as per the New York time zone and resets at the start of a new session or the end of the regular session. This cumulative TICK value is then used to determine the trend.
The trend is defined as bullish if the SMA of cumulative TICK is equal to or greater than zero and bearish if it's less than zero. Additionally, this indicator plots the ATR bands, which can be used as volatility measures. The Upper ATR Band and Lower ATR Band can be made smoother using the SMA, according to the trader's preference.
The plot includes two parts for each trend: a stronger color (Red for bear, Green for bull) when the trend is ongoing, and a lighter color when the trend seems to be changing.
Remember, this tool is intended to be used as part of a comprehensive trading strategy. Always ensure you are managing risk appropriately and consulting various data sources to make informed trading decisions.

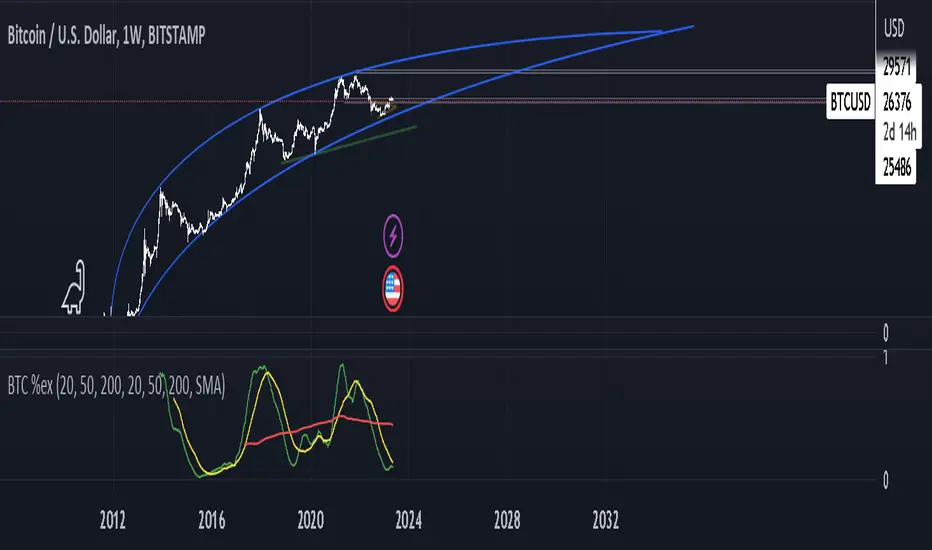
BTC bottom top MACRO indicator based on: Cost per transaction(w)Predicting tops and bottoms in any market is a challenging task, and the Bitcoin market is no exception. Many traders and analysts use a combination of various indicators and models to help them make educated guesses about where the market might be heading. One such metric that can provide valuable insights is the Bitcoin cost per transaction indicator.
Here's how it could potentially be superior to just using price action for predicting macro tops and bottoms:
Transaction Cost as an Indicator of Network Activity: The cost per transaction on the Bitcoin network can give an indication of how much activity is taking place. When transaction costs are high, it may signal increased network usage, which often coincides with periods of market enthusiasm or FOMO (Fear of Missing Out) that can precede market tops. Conversely, lower transaction costs might indicate reduced network activity, potentially signaling a lack of investor interest that might precede market bottoms.
Reflects Real-World Use and Demand: Unlike price action, which can be influenced by speculative trading and may not always reflect the underlying fundamentals, the cost per transaction is directly tied to the use of the Bitcoin network. It offers a more fundamental approach to understanding market dynamics.
Complements Price Action Analysis: While price action can give signals about potential tops and bottoms based on historical price patterns and technical analysis, the cost per transaction can add an additional layer of information by reflecting network activity. In this way, the two can be used together to give a more complete picture of the market.
May Precede Price Changes: Changes in transaction costs could potentially precede price changes, giving advanced warning of tops and bottoms. For instance, a sudden increase in transaction costs might indicate a surge in network activity and investor interest, potentially signaling a market top. On the other hand, a decrease in transaction costs might suggest declining network activity and investor interest, potentially signaling a market bottom.
However, it's important to note that while the cost per transaction can provide valuable insights, it's not a foolproof method for predicting market tops and bottoms. Like all indicators, it should be used in conjunction with other tools and analysis methods, and traders should also consider the broader market context. As always, past performance is not indicative of future results, and all trading and investment strategies carry the risk of loss.
Liquidation Levels on OIThis indicator is used to display estimated contract liquidation prices. When there are dense liquidation areas on the chart, it indicates that there may be a lot of liquidity at that price level. The horizontal lines of different colors on the chart represent different leverage ratios. See below for details.
Let me introduce the principle behind this indicator:
1. When position trading volume increases or decreases significantly higher than usual levels in a specific candlestick chart, it indicates that a large number of contracts were opened during that period. We use the 60-day moving average change as a benchmark line. If the position trading volume changes more than 1.2x, 2x or 3x its MA60 value, it is considered small, medium or large abnormal increase or decrease.
2. This indicator takes an approximate average between high, open, low and close prices of that candlestick as opening price.
3. Since contracts involve liquidity provided by both buyers and sellers with equal amounts of long and short positions corresponding to each contract respectively; since we cannot determine actual settlement prices for contract positions; therefore this indicator estimates settlement prices instead which marks five times (5x), ten times (10x), twenty-five times (25x), fifty times (50x) and one hundred times (100x) long/short settlement prices corresponding to each candlestick chart generating liquidation lines with different colors representing different leverage levels.
4. We can view areas where dense liquidation lines appear as potential liquidation zones which will have high liquidity.
5. We can adjust orders based on predicted liquidation areas because most patterns in these areas will be quickly broken.
6. We provide a density histogram to display the liquidation density of each price range.
Special thanks to the following TradingView community members for providing open-source indicators and contributing to the development of this indicator!
Liquidation - @Mysterysauce
Open Interest Delta - By Leviathan - @LeviathanCapital
Regarding the relationship with the above-mentioned open source indicators:
1. Indicator Liquidation - @Mysterysauce can also draw a liquidation line in the chart, but:
(1) Our indicator generates a liquidation line based on abnormal changes in open interest; their indicator generates a liquidation line based on trading volume.
(2) Our indicator will generate both long and short liquidation lines at the same time; their indicator will only generate a liquidation line in a single direction.
We refer to their method of drawing liquidation lines when drawing our own.
2. Indicator Open Interest Delta - By Leviathan - @LeviathanCapital obtained OI data for Binance USDT perpetual contracts in the code. We refer to their method of obtaining OI data in our code.
============= 中文版本 =============
此指标用于显示估计合约清算价格。当图表上有密集的清算区域时,表示该价格水平可能存在大量流动性。图表上不同颜色的水平线代表不同杠杆比率。详情请参见下面的说明。
让我介绍一下这个指标背后的原理:
1. 当特定蜡烛图对应的合约仓位增加量(OI Delta)显著高于通常水平时,表示在那段时间有大量合约开仓。我们使用OI Delta的60日移动均线作为基准线。如果OI Delta超过其MA60值的1.2倍、2倍或3倍,则认为是小型、中型或大型的异常OI Delta。
2. 该指标将上述蜡烛图高、开、低和收盘价的平均值作为近似的合约开仓价。
3. 由于合约涉及买方和卖方之间相互提供流动性,每个合约对应相等数量的多头和空头头寸。由于我们无法确定合约头寸的实际清算价格,因此该指标估计了清算价格。它标记了与该蜡烛图相对应的多头和空头5倍、10倍、25倍、50倍和100倍的清算价格,生成清算线。不同杠杆水平用不同颜色表示。
4. 我们可以将出现密集清算线的区域视为潜在的清算区域。这些区域将具有高流动性。
5. 我们可以根据预测到的清算区域调整自己的订单,因为根据规律,这些清算区域大部分都会很快被击穿。
6. 我们提供了密度直方图来显示每个价格范围的清算密度
特别感谢以下TradingView社区成员提供开源指标并为该指标的开发做出贡献!
Liquidation - @Mysterysauce
Open Interest Delta - By Leviathan - @LeviathanCapital
与上述开源指标的关系:
1. 指标Liquidation - @Mysterysauce也可以在图中绘制清算线,但是:
(1)我们的指标是基于open interest的异常变化生成的清算线;他们的指标是基于成交量生成的清算线
(2)我们的指标会同时生成多头和空头清算线;他们的指标仅会在单一方向生成清算线
我们的指标在绘制清算线上参考了他们绘制清算线的方式
2. 指标Open Interest Delta - By Leviathan - @LeviathanCapital在代码中获取了Binance USDT永续合约的OI数据。我们在代码中参考他们获取OI数据的方式

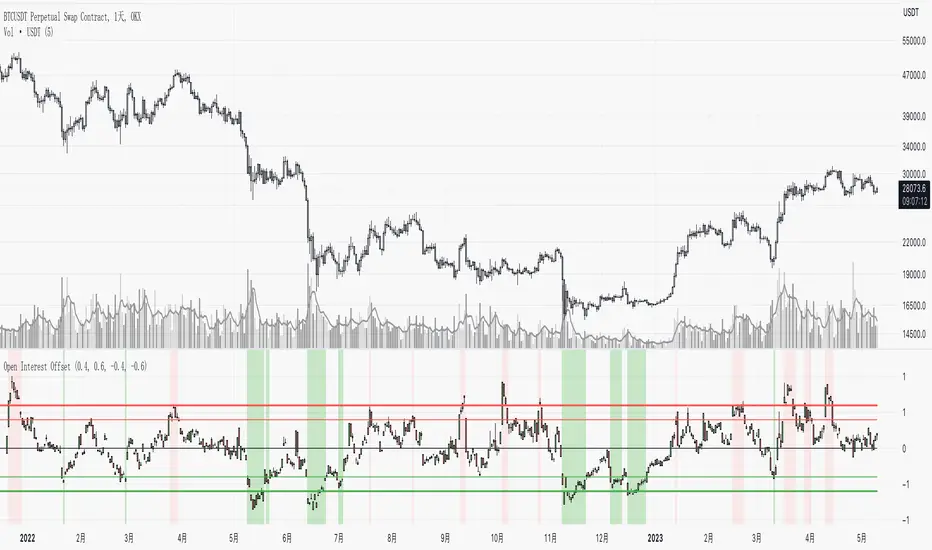
Open Interest OffsetThis indicator is used to display whether there has been an abnormal increase or decrease in recent contract positions. Its usage is similar to the RSI indicator.
Please note that this indicator uses fixed (customizable) thresholds of 0.4 and 0.6 to indicate when abnormal opening and closing occur respectively. For some altcoins, their values may far exceed 0.4 so please adjust accordingly based on your symbol.
(1) When there is an abnormal increase in recent contract positions, the value of the indicator will be above 0.4. This means that there may be a liquidation market situation occurring subsequently. If the market background at this time is rising, it may not be suitable to continue buying because the indicator shows that it is currently overbought. On the contrary, it may be appropriate to sell now.
(2) When there is an abnormal decrease in recent contract positions, the value of the indicator will be below -0.4. This means that a liquidation market situation has occurred recently. If the market background at this time is falling, it may not be suitable to continue shorting because the indicator shows that it is currently oversold. On the contrary, it may be appropriate to buy now.
Special thanks to the following TradingView community members for providing open-source indicators and contributing to the development of this indicator!
Open Interest Delta - By Leviathan - @LeviathanCapital
Regarding the relationship with the above-mentioned open source indicator:
Indicator Open Interest Delta - By Leviathan - @LeviathanCapital obtained OI data for Binance USDT perpetual contracts in the code. We refer to their method of obtaining OI data in our code.
============= 中文版本 =============
该指标用于显示近期合约持仓量是否有异常的增加和减少。它的用法类似于RSI指标
请注意,该指标使用了固定的(可定制的)阈值0.4和0.6来提示异常开仓和平仓的发生。对于某些山寨币而言,指标的数值可能远大于0.4。请根据你所关注的标的自行调整
(1)当近期合约持仓量有异常的增加时,指标的值会在0.4以上。这意味着后续可能有清算行情的发生。若此时市场背景为上涨,此时可能不太适合继续做多,因为指标显示目前处于超买行情。相反,现在可能适合卖出
(2)当近期合约的持仓量有异常的减少时,指标的值会在-0.4以下。这意味着近期已经发生了清算行情。若此时市场背景为下跌,此时可能不太适合继续做空,因为指标显示目前处于超卖行情。相反,现在可能适合买入
特别感谢以下TradingView社区成员提供开源指标并为该指标的开发做出贡献!
Open Interest Delta - By Leviathan - @LeviathanCapital
与上述开源指标的关系:
指标Open Interest Delta - By Leviathan - @LeviathanCapital在代码中获取了Binance USDT永续合约的OI数据。我们在代码中参考他们获取OI数据的方式
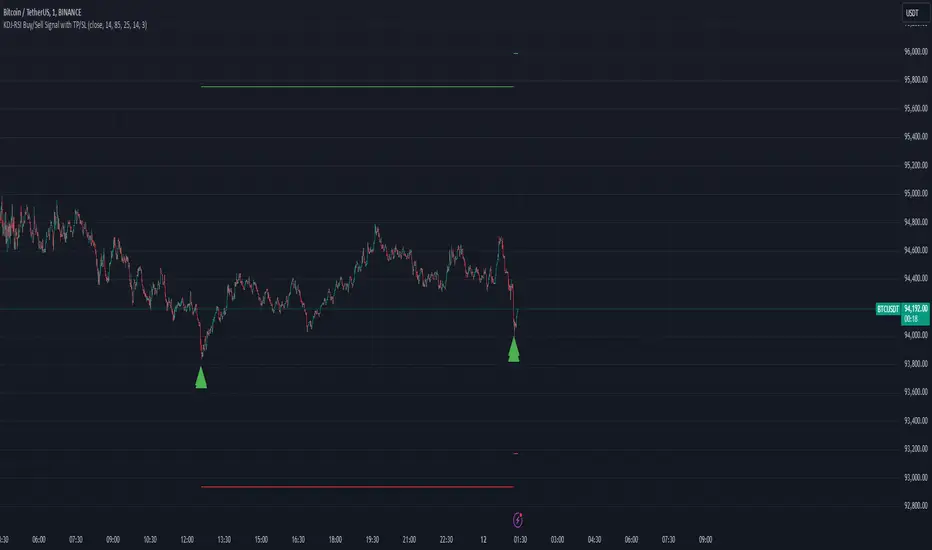
KDJ-RSI Buy/Sell Signal ver. 1It is an indicator combining the RSI indicator and KDJ indicator.
Buy signal will triggers when:
RSI signal positioning below 25
J value crosses below 0
Sell signal will triggers when:
RSI signal positioning above 85
J value crosses above 100
***********
Please take note that this indicator may be not accurate for every chart in the crypto market, but it is most appropriate to use it in BTC/USDT charts, mainly for 1h, 4h, and 1d candles. Not recommended to use it for 1m or 15m leverage trades, this indicator might be altered by FOMO sentiment.
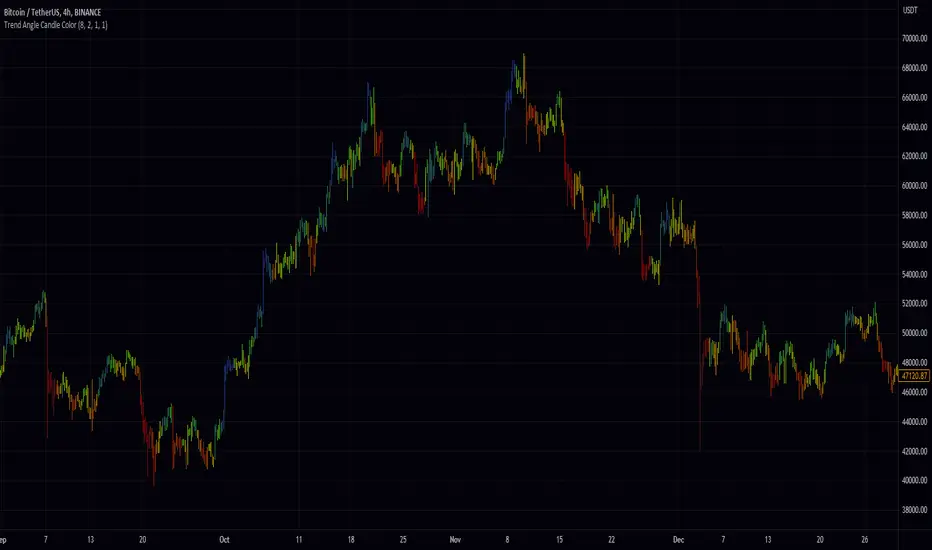
Trend Angle Candle ColorIntroduction:
As a trader, understanding the trend of the market is crucial for making informed decisions. One way to gain insight into the market trend is by using technical indicators, which are mathematical calculations that provide traders with valuable information about price action. In this post, we will explore a unique indicator called the "Trend Angle Candle Color" that not only identifies the trend but also visualizes it using color-coded candlesticks. We'll dive into the script, discuss its key components, and explain how you can benefit from using it in your trading strategy.
Script Overview:
The Trend Angle Candle Color Indicator is written in the Pine Script language for the TradingView platform. The indicator utilizes a combination of Exponential Moving Average (EMA), Average True Range (ATR), and Epanechnikov Kernel function to calculate the trend angle, which is then represented by color-coded candlesticks. The script offers several customizable inputs, such as the length of the lookback period, the scale (sensitivity), and the smoothing factor.
Key Components of the Script:
Inputs:
Length: Determines the lookback period for calculating the trend.
Scale: Adjusts the sensitivity of the indicator.
Smoothing: Controls the degree of smoothing applied to the angle calculation.
Smoothing Factor: Adjusts the weight of the Epanechnikov Kernel function.
Functions:
grad(src): A function that takes an input value and returns a corresponding color from a predefined gradient.
ema(source): An Exponential Moving Average function that smoothens the price data.
atan2(y, x) and degrees(float source): Functions that convert the slope into an angle in radians and then into degrees.
epanechnikov_kernel(_src, _size, _h, _r): A function that applies the Epanechnikov Kernel smoothing method to the angle data.
Calculations:
ATR: Calculates the Average True Range using the EMA function.
Slope: Determines the slope of the price change over the specified lookback period.
Angle_rad: Converts the slope into an angle in radians.
Degrees: Applies the Epanechnikov Kernel smoothing function to the angle data and scales it to a range between 0 to 100.
Visualization:
Colour: Assigns a color to each candlestick based on the calculated degree value using the grad() function.
Barcolor(colour) and plotcandle(): Functions that display the color-coded candlesticks on the chart.
Benefits of Using the Trend Angle Candle Color Indicator:
Easy Visualization: The color-coded candlesticks provide a simple and intuitive way to understand the market trend direction and strength at a glance.
Customizable Parameters: The customizable inputs allow traders to fine-tune the indicator to their preferred settings, suiting their trading style and strategy.
Versatility: The Trend Angle Candle Color Indicator can be used across various timeframes and financial instruments, making it a valuable addition to any trader's toolkit.
Conclusion:
The Trend Angle Candle Color Indicator is a powerful tool that can enhance your trading strategy by providing a visual representation of the market trend. The unique combination of EMA, ATR, and Epanechnikov Kernel smoothing helps create a more accurate and easy-to-understand trend angle calculation. By incorporating this indicator into your trading analysis, you can gain better insight into market dynamics and make more informed trading decisions.
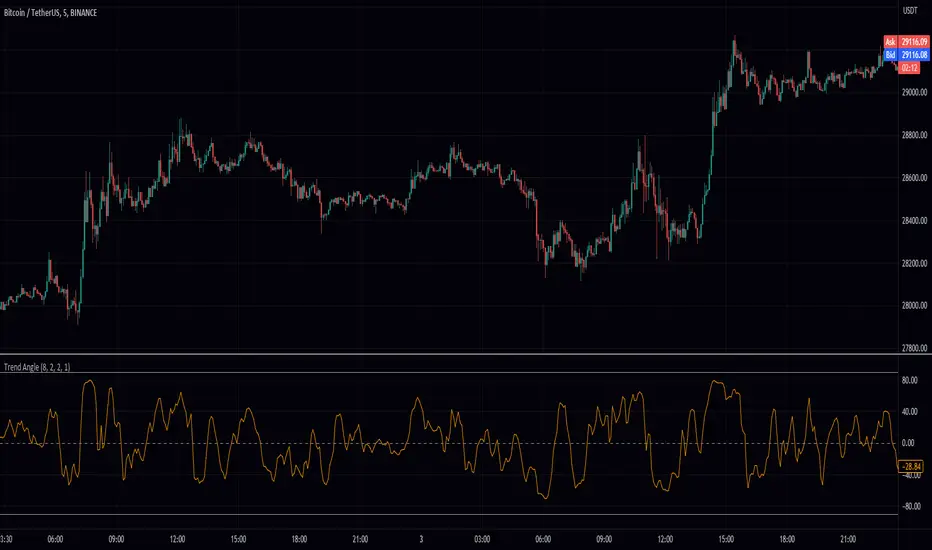
Trend AngleIntroduction:
In today's post, we'll dive deep into the source code of a unique trading tool, the Trend Angle Indicator. The script is an indicator that calculates the trend angle for a given financial instrument. This powerful tool can help traders identify the strength and direction of a trend, allowing them to make informed decisions.
Overview of the Trend Angle Indicator:
The Trend Angle Indicator calculates the trend angle based on the slope of the price movement over a specified period. It uses an Exponential Moving Average (EMA) to smooth the data and an Epanechnikov kernel function for additional smoothing. The indicator provides a visual representation of the trend angle, making it easy to interpret for traders of all skill levels.
Let's break down the key components of the script:
Inputs:
Length: The number of periods to calculate the trend angle (default: 8)
Scale: A scaling factor for the ATR (Average True Range) calculation (default: 2)
Smoothing: The smoothing parameter for the Epanechnikov kernel function (default: 2)
Smoothing Factor: The radius of the Epanechnikov kernel function (default: 1)
Functions:
ema(): Exponential Moving Average calculation
atan2(): Arctangent function
degrees(): Conversion of radians to degrees
epanechnikov_kernel(): Epanechnikov kernel function for additional smoothing
Calculations:
atr: The EMA of the True Range
slope: The slope of the price movement over the given length
angle_rad: The angle of the slope in radians
degrees: The smoothed angle in degrees
Plotting:
Trend Angle: The trend angle, plotted as a line on the chart
Horizontal lines: 0, 90, and -90 degrees as reference points
How the Trend Angle Indicator Works:
The Trend Angle Indicator begins by calculating the Exponential Moving Average (EMA) of the True Range (TR) for a given financial instrument. This smooths the price data and provides a more accurate representation of the instrument's price movement.
Next, the indicator calculates the slope of the price movement over the specified length. This slope is then divided by the scaled ATR to normalize the trend angle based on the instrument's volatility. The angle is calculated using the atan2() function, which computes the arctangent of the slope.
The final step in the process is to smooth the trend angle using the Epanechnikov kernel function. This function provides additional smoothing to the trend angle, making it easier to interpret and reducing the impact of short-term price fluctuations.
Conclusion:
The Trend Angle Indicator is a powerful trading tool that allows traders to quickly and easily determine the strength and direction of a trend. By combining the Exponential Moving Average, ATR, and Epanechnikov kernel function, this indicator provides an accurate and easily interpretable representation of the trend angle. Whether you're an experienced trader or just starting, the Trend Angle Indicator can provide valuable insights into the market and help improve your trading decisions.
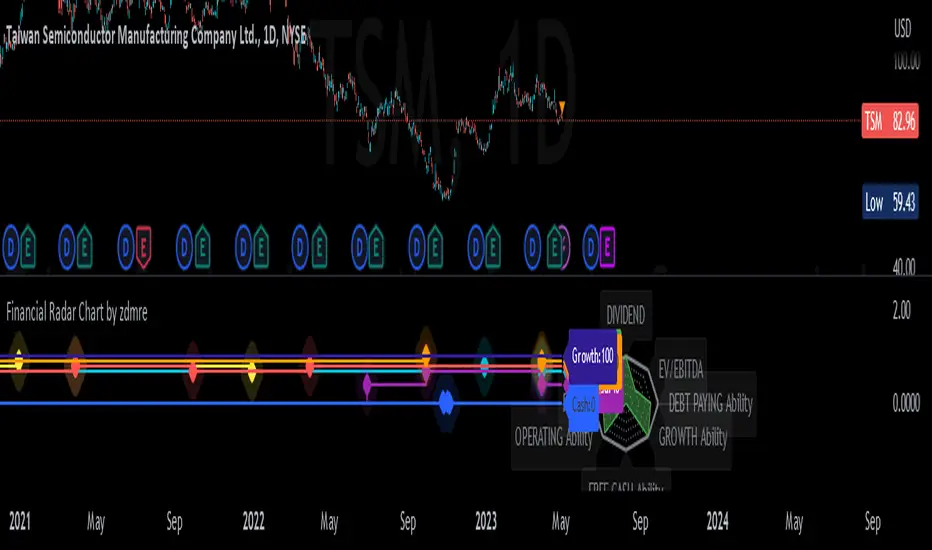
Financial Radar Chart by zdmreRadar chart is often used when you want to display data across several unique dimensions. Although there are exceptions, these dimensions are usually quantitative, and typically range from zero to a maximum value. Each dimension’s range is normalized to one another, so that when we draw our spider chart, the length of a line from zero to a dimension’s maximum value will be the similar for every dimension.
This Charts are useful for seeing which variables are scoring high or low within a dataset, making them ideal for displaying performance.
How is the score formed?
Debt Paying Ability
if Debt_to_Equity < %10 : 100
elif < 20% : 90
elif < 30% : 80
elif < 40% : 70
elif < 50% : 60
elif < 60% : 50
elif < 70% : 40
elif < 80% : 30
elif < 90% : 20
elif < 100% : 10
else: 0
ROIC
if Return_on_Invested_Capital > %50 : 100
elif > 40% : 90
elif > 30% : 80
elif > 20% : 70
elif > 10% : 50
elif > 5% : 20
else: 0
ROE
if Return_on_Equity > %50 : 100
elif > 40% : 90
elif > 30% : 80
elif > 20% : 70
elif > 10% : 50
elif > 5% : 20
else: 0
Operating Ability
if Operating_Margin > %50 : 100
elif > 30% : 90
elif > 20% : 80
elif > 15% : 60
elif > 10% : 40
elif > 0 : 20
else: 0
EV/EBITDA
if Enterprise_Value_to_EBITDA < 3 : 100
elif < 5 : 80
elif < 7 : 70
elif < 8 : 60
elif < 10 : 40
elif < 12 : 20
else: 0
FREE CASH Ability
if Price_to_Free_Cash_Flow < 5 : 100
elif < 7 : 90
elif < 10 : 80
elif < 16 : 60
elif < 18 : 50
elif < 20 : 40
elif < 22 : 30
elif < 30 : 20
elif < 40 : 15
elif < 50 : 10
elif < 60 : 5
else: 0
GROWTH Ability
if Revenue_One_Year_Growth > %20 : 100
elif > 16% : 90
elif > 14% : 80
elif > 12% : 70
elif > 10% : 50
elif > 7% : 40
elif > 4% : 30
elif > 2% : 20
elif > 0 : 10
else: 0
relative performanceThis indicator is built to mesure the performance of a stock vs the index of choice. it is best use for the intraday session because it doesn't take gap into account when doing the calculation. This is how i made my math (using AAPL compared to SPY for simplicity)
(change AAPL / ATR AAPL) - (change SPY / ATR SPY) * beta factor * volume factor
change is calculated open to close for each candle instead of close to close. this is why gap does not affect the calculation
blue columns is an instant snap shot of the RP
red and green columns is the moving average of the blue columns
limit is the max value for the blue line when ploting them on the chart but doesn't affect the calculation
option:
indice: default with SPY but could use any stock
moving average choice: let you choose between EMA or SMA green and red columns
rolling average length : number of bar for the moving average
I made an auto adjust for the 5 min chart and the 2 min chart so you can swithc between both chart and have the same average (default value set to 6x 5min and 15x 2 min, giving you the average of the last 30min)
volume weighing let you choose if you want a volume factor or not. volume factor is only going to multiplie the result of the price move. it cannot move it from positive to negative.
this is the calculation
(volume AAPL / volume SMA AAPL) / (volume SPY / volume sma SPY)
meaning that a higher volume on the thicker compared to it's sma while having a lower volume on SPY will give you a big relative performance.
you can choose the number of bar in the average for the volume.
BETA factor work the same way that the volume factor does. you got to manualy enter your beta. default is set to 1.5
table
top line : blue square is you RP value (same has the blue columns bar) and your reference thicker
middle line : pourcentage move from the open (9:30 open) for your stock on the left and the reference on the right
bottom line : beta on the left and volume factor on the right
feel free to ask question or give modification idea!

Radar RiderThe Radar Rider indicator is a powerful tool that combines multiple technical indicators into a single spider plot, providing traders with a comprehensive view of market conditions. This article will delve into the workings of each built-in indicator and their arrangement within the spider plot. To better understand the structure of the script, let's first examine some of the primary functions and how they are utilized in the script.
Normalize Function: normalize(close, len)
The normalize function takes the close price and a length as arguments and normalizes the price data by scaling it between 0 and 1, making it easier to compare different indicators.
Exponential Moving Average (EMA) Filter: bes(source, alpha)
The EMA filter is used to smooth out data using an exponential moving average, with the given alpha value defining the level of smoothing. This helps reduce noise and enhance the trend-following characteristics of the indicators.
Maximum and Minimum Functions: max(src) and min(src)
These functions find the maximum and minimum values of the input data over a certain period, respectively. These values are used in the normalization process and can help identify extreme conditions in the market.
Min-Max Function: min_max(src)
The min-max function scales the input data between 0 and 100 by dividing the difference between the data point and the minimum value by the range between the maximum and minimum values. This standardizes the data, making it easier to compare across different indicators.
Slope Function: slope(source, length, n_len, pre_smoothing = 0.15, post_smoothing = 0.7)
The slope function calculates the slope of a given data source over a specified length, and then normalizes it using the provided normalization length. Pre-smoothing and post-smoothing values can be adjusted to control the level of smoothing applied to the data before and after calculating the slope.
Percent Function: percent(x, y)
The percent function calculates the percentage difference between two values, x and y. This is useful for comparing the relative change in different indicators.
In the given code, there are multiple indicators included. Here, we will discuss each of them in detail.
EMA Diff:
The Exponential Moving Average (EMA) Diff is the difference between two EMA values of different lengths. The EMA is a type of moving average that gives more weight to recent data points. The EMA Diff helps traders identify trends and potential trend reversals. In the code, the EMA Diff is calculated using the ema_diff() function, which takes length, close, filter, and len_norm as parameters.
Percent Rank EMA Diff:
The Percent Rank EMA Diff is the percentage rank of the EMA Diff within a given range. It helps traders identify overbought or oversold conditions in the market. In the code, the Percent Rank EMA Diff is calculated using the percent_rank_ema_diff() function, which takes length, close, filter, and len_norm as parameters.
EMA Diff Longer:
The EMA Diff Longer is the difference between two EMA values of different lengths, similar to EMA Diff but with a longer period. In the code, the EMA Diff Longer is calculated using the ema_diff_longer() function, which takes length, close, filter, and len_norm as parameters.
RSI Filter:
The Relative Strength Index (RSI) is a momentum oscillator that measures the speed and change of price movements. The RSI Filter is the RSI value passed through a filter to smooth out the data. In the code, the RSI Filter is calculated using the rsi_filter() function, which takes length, close, and filter as parameters.
RSI Diff Normalized:
The RSI Diff Normalized is the normalized value of the derivative of the RSI. It helps traders identify potential trend reversals in the market. In the code, the RSI Diff Normalized is calculated using the rsi_diff_normalized() function, which takes length, close, filter, len_mad, and len_norm as parameters.
Z Score:
The Z Score is a statistical measurement that describes a value's relationship to the mean of a group of values. In the context of the code, the Z Score is calculated for the closing price of a security. The z_score() function takes length, close, filter, and len_norm as parameters.
EMA Normalized:
The EMA Normalized is the normalized value of the EMA, which helps traders identify trends and potential trend reversals in the market. In the code, the EMA Normalized is calculated using the ema_normalized() function, which takes length, close, filter, and len_norm as parameters.
WMA Volume Normalized:
The Weighted Moving Average (WMA) Volume Normalized is the normalized value of the WMA of the volume. It helps traders identify volume trends and potential trend reversals in the market. In the code, the WMA Volume Normalized is calculated using the wma_volume_normalized() function, which takes length, volume, filter, and len_norm as parameters.
EMA Close Diff Normalized:
The EMA Close Diff Normalized is the normalized value of the derivative of the EMA of the closing price. It helps traders identify potential trend reversals in the market. In the code, the EMA Close Diff Normalized is calculated using the ema_close_diff_normalized() function, which takes length, close, filter, len_mad, and len_norm as parameters.
Momentum Normalized:
The Momentum Normalized is the normalized value of the momentum, which measures the rate of change of a security's price. It helps traders identify trends and potential trend reversals in the market. In the code, the Momentum Normalized is calculated using the momentum_normalized() function, which takes length, close, filter, and len_norm as parameters.
Slope Normalized:
The Slope Normalized is the normalized value of the slope, which measures the rate of change of a security's price over a specified period. It helps traders identify trends and potential trend reversals in the market. In the code, the Slope Normalized is calculated using the slope_normalized() function, which takes length, close, filter, and len_norm as parameters.
Trend Intensity:
Trend Intensity is a measure of the strength of a security's price trend. It is based on the difference between the average of price increases and the average of price decreases over a given period. The trend_intensity() function in the code calculates the Trend Intensity by taking length, close, filter, and len_norm as parameters.
Volatility Ratio:
The Volatility Ratio is a measure of the volatility of a security's price, calculated as the ratio of the True Range (TR) to the Exponential Moving Average (EMA) of the TR. The volatility_ratio() function in the code calculates the Volatility Ratio by taking length, high, low, close, and filter as parameters.
Commodity Channel Index (CCI):
The Commodity Channel Index (CCI) is a momentum-based oscillator used to help determine when an investment vehicle is reaching a condition of being overbought or oversold. The CCI is calculated as the difference between the mean price of a security and its moving average, divided by the mean absolute deviation (MAD) of the mean price. In the code, the CCI is calculated using the cci() function, which takes length, high, low, close, and filter as parameters.
These indicators are combined in the code to create a comprehensive trading strategy that considers multiple factors such as trend strength, momentum, volatility, and overbought/oversold conditions. The combined analysis provided by these indicators can help traders make informed decisions and improve their chances of success in the market.
The Radar Rider indicator is a powerful tool that combines multiple technical indicators into a single, easy-to-read visualization. By understanding the inner workings of each built-in indicator and their arrangement within the spider plot, traders can better interpret market conditions and make informed trading decisions.

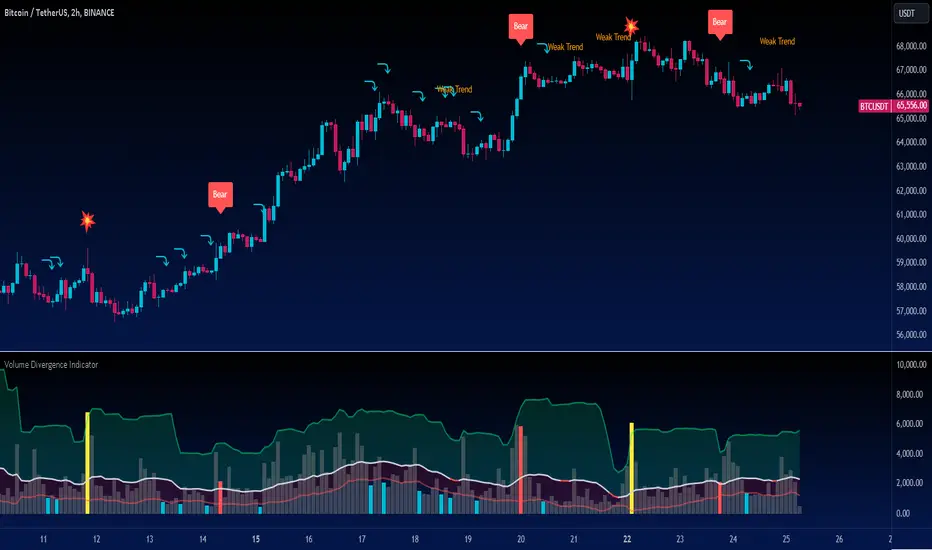
Volume Divergence IndicatorThe Volume Divergence Indicator is a powerful tool that can help traders identify potential price reversals in the market by analyzing volume data. The indicator has several features, including divergences signals, volume spikes, volume contractions, and volume trend signals.
Unlike most divergence indicators, this one is focused on providing non-repainting alerts. That is why I chose not to use pivot points.
The Volume Divergence Indicator can be used as an overlay or a non-overlay. The overlay mode displays the indicator on top of the price chart, while the non-overlay mode displays the indicator below the price chart.
The indicator has five alerts that can be used to generate alerts:
Bullish Divergence : This alert is generated when prices are making lower lows, but volume is making higher lows. This suggests that the selling pressure is weakening, and a bullish reversal may be imminent.
Bearish Divergence : This alert is generated when prices are making higher highs, but volume is making lower highs. This suggests that the buying pressure is weakening, and a bearish reversal may be imminent.
Volume Spike : This alert is generated when volume spikes above a certain threshold, such as two standard deviations above the moving average. This suggests that there is unusual buying or selling activity in the market, and traders may want to pay attention to the price movements that follow.
Volume Contraction : This alert is generated when volume contracts to a certain level, such as two standard deviations below the moving average. This suggests that there is little buying or selling activity in the market, and traders may want to be cautious until volume picks up again.
Volume Trend : This alert is generated when volume trends above or below the moving average for a certain number of periods, such as five or ten. This suggests that there is a sustained increase or decrease in buying or selling pressure, and traders may want to adjust their trading strategy accordingly.
To customize the indicator settings, users can adjust the following inputs:
Choose overlay mode: select either Overlay or Non-Overlay
Price and volume lookback: set the number of bars to look back for price and volume data
Bull and bear sensitivity: adjust the sensitivity of the bullish and bearish divergences
Volume MA length: set the length of the moving average used to calculate volume spikes and contractions
Sensitivity of spikes: adjust the sensitivity of the volume spikes
Sensitivity of contractions: adjust the sensitivity of the volume contractions
Trend sensitivity: set the number of periods to identify the volume trend
The Volume Divergence Indicator can be a valuable addition to any trader's toolkit. It can help traders identify potential price reversals in the market, as well as unusual buying or selling activity.
I am open to suggestions for further updates or additions.
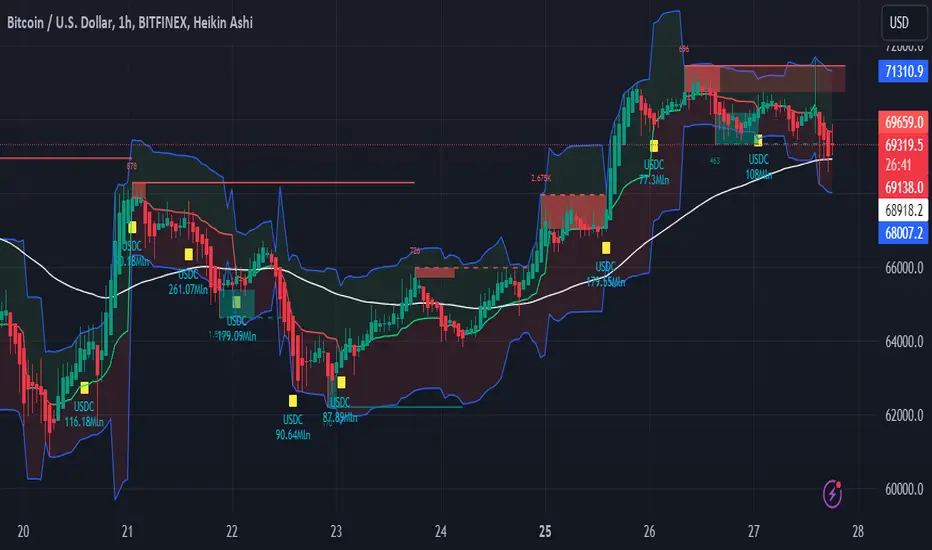
USDT Inflow TrackerUSDT INFLOW TRACKER
What does this script do? It looks for important inflow from USDT and write it below or above your chart.
Does it matter? Yes because Tether with planned USDT inflow highly manipulate the crypto market.
With this simple script you can study what and when something strange is going to happen on your favourite token.
HOW IT WORKS?
Pretty simple. It just continuosly check USDT (and USDC) Market Cap and verify if the last candle is way higher than last one. If it was way higher than expected it plot a green square and write a note with the total Inflow of USDT in the crypto market (not specifcially for your token)
Now you can see when an important inflow is done and start to plan your entry and exit strategy in the crypto market.
AUTOSET
With Autoset you can rely on standard values
5min TF : Inflow greater than of 15 mln (in 1 candle)
30min TF : Inflow greater than of 150 mln (in 1 candle)
60min TF : Inflow greater than of 300 mln (in 1 candle)
1Day TF : Inflow greater than of 900 mln (in 1 candle)
So you can check your favourite coin in no time looking for a good trading position
MANUAL SETTINGS
Otherwise you can set directly your Inflow to track based on your needs.
In the example below I've set to check everytime an Inflow of 25mln USDT or greater was done.
As you can see it highly influence the relative token.
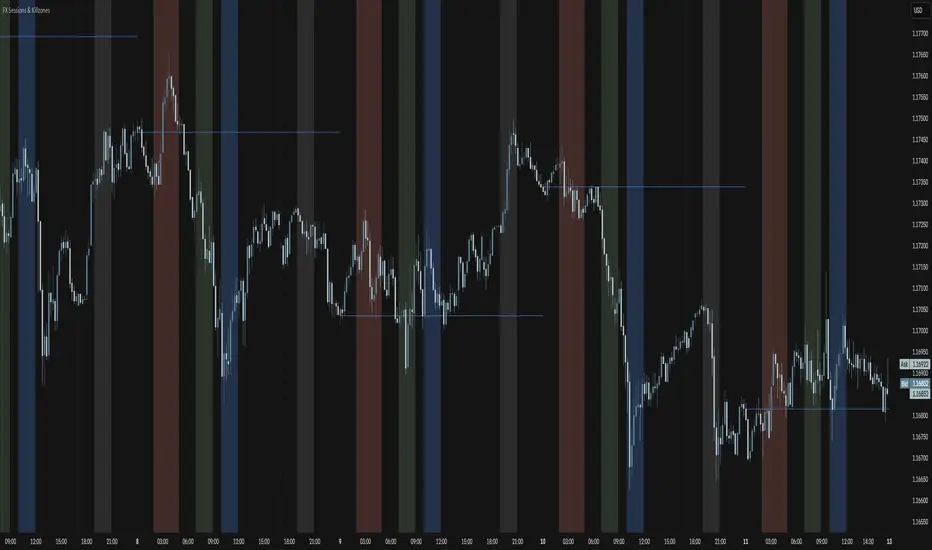
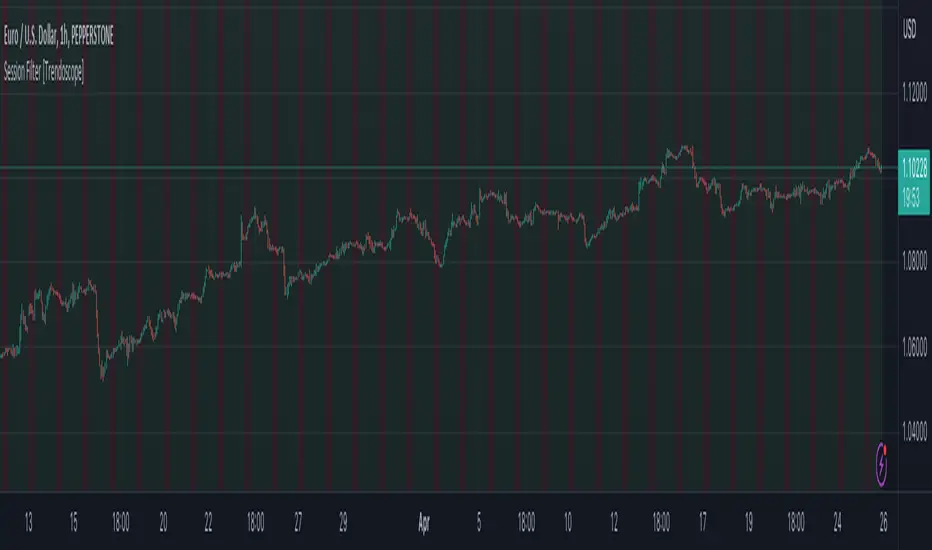
Session Filter [Trendoscope]🎲 Session Filter: A Customisable Trading Indicator for Defining Preferred Trade Sessions
Session Filter is a simple trading indicator that enables traders to define their preferred trading sessions and optimise their approach based on individual preferences. By providing a range of flexible customisation options, Session Filter can help traders reduce risk, increase accuracy, by helping them to adhere to their trading sessions. Features include
🎯 Customisable Trading Sessions
One of the key features of Session Filter is the ability to select from four different trading sessions. These sessions are designed to be flexible, making it easy to tailor your approach to specific markets, assets, and trading styles. By selecting the sessions that are most relevant to your strategy, you can reduce the risk of making trades during less favourable market conditions.
For example, if you prefer to trade during the Asian session, you can set the session times to "Asian Session" in input settings. This will highlight the specific times when the Asian markets are open, allowing you to focus your trading activity during these periods. By doing so, you can avoid trading during times when the market is less active or more volatile.
🎯 Customisable Timezone and Days of the Week:
In addition to customisable trading sessions, Session Filter also allows users to select a timezone and specific days of the week. This ensures that the displayed trading zones and signals are aligned with your local time, and that you can tailor your approach to your preferred schedule. This is particularly useful for traders who have other commitments, or who prefer to focus on specific markets or assets on certain days.
For example, if you are based in New York and prefer to trade during the European session, you can select the "European Session" option in Session Filter and adjust the timezone to reflect your local time. You can also select specific days of the week when you prefer to trade during the European session, such as Tuesday through Thursday. This allows you to optimize your approach based on your personal preferences and schedule.
🎯 Easy Visual Interpretation:
Session Filter uses green and red overlays on the chart to indicate the trading zones, making it easy for users to visually identify their trading sessions
For example, when a green overlay is displayed on the chart, this indicates that the market is within the selected trading session and that it may be a good time to start trade. Conversely, when a red overlay is displayed, this indicates that the market is outside of the selected trading session and that it may be a good time close all trading. By providing this visual feedback, Session Filter helps traders stay focused and disciplined, and avoid making impulsive trading decisions.
🎯Force Exit Signal for Risk Management:
Session Filter also offers the ability to generate a force exit signal when not in any of the selected sessions. This can be used in conjunction with alerts to exit all trades outsize session zone.
For example, if you are using Session Filter to trade during the European session, but the market is particularly volatile during a specific day, the force exit signal will be generated to indicate that it may be a good time to exit your trade. This helps you avoid potential losses and stay disciplined during periods of market turbulence.
🎯External Signal Plots:
In addition to the chart overlays, Session Filter also plots signals on the data window that can be used as external inputs in other indicators and strategies. This feature allows traders to incorporate the signals generated by Session Filter into their existing trading systems and this can be used as additional filters on an existing strategy or methodology.
🎯Alerts using Alert Conditions
Alerts are provided for start and end of session so that users can make use of it to set auto turn on or off their bots.
Settings are pretty simple and are explained here.
Range Sentiment Profile [LuxAlgo]The Range Sentiment Profile indicator is inspired from the volume profile and aims to indicate the degree of bullish/bearish variations within equidistant price areas inside the most recent price range.
The most bullish/bearish price areas are highlighted through lines extending over the entire range.
🔶 SETTINGS
Length: Most recent bars used for the calculation of the indicator.
Rows: Number of price areas the price range is divided into.
Use Intrabar: Use intrabar data to compute the range sentiment profile.
Timeframe: Intrabar data timeframe.
🔶 USAGE
This tool can be used to easily determine if a certain price area contain more significant bullish or bearish price variations. This is done by obtaining an estimate of the accumulation of all the close to open variations occurring within a specific profile area.
A blue range background indicates a majority of bullish variations within each area while an orange background indicates a majority of bearish variations within each area.
Users can easily identify the areas with the most bullish/bearish price variations by looking at the bullish/bearish maximums.
It can be of interest to see where profile bins might have no length, these can indicate price areas with price variations with alternating signs (bullish variations are followed by a bearish sign) and similar body. They can also indicate a majority of either bullish or bearish variations alongside a minority of more significant opposite variations.
These areas can also provide support/resistance, as such price entering these areas could reverse.
Users can obtain more precise results by allowing the profile to use intrabar data. This will change the calculation of the profile, see the details section for more information.
🔶 DETAILS
The Range Sentiment Profile's design is similar to the way a volume profile is constructed.
First the maximum/minimum values over the most recent Length bars are obtained, these define the calculation range of the profile.
The range is divided into Rows equidistant areas. We then see if price lied within a specific area, if it's the case we accumulate the difference between the closing and opening price for that specific area.
Let d = close - open . The length of the bin associated to a specific area is determined as follows:
length = Width / 100 * Area / Max
Where Area is the accumulated d within the area, and Max the maximum value between the absolute value of each accumulated d of all areas.
The percentage visible on each bin is determined as 100 multiplied by the accumulated d within the area divided by the total absolute value of d over the entire range.
🔹 Intrabar Calculation
When using intrabar data the range sentiment profile is calculated differently.
For a specific area and candle within the interval, the accumulated close to open difference is accumulated only if the intrabar candle of the user selected timeframe lies within the area.
This can return more precise results compared to the standard method, at the cost of a higher computation time.

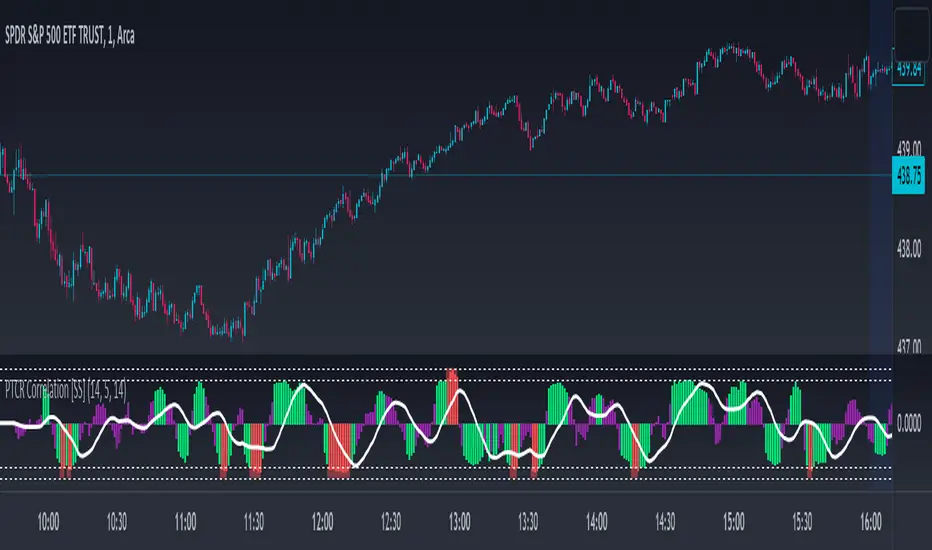
Put to Call Ratio CorrelationHello!
Excited to share this with the community!
This is actually a very simple indicator but actually usurpingly helpful, especially for those who trade indices such as SPX, IWM, QQQ, etc.
Before I get into the indicator itself, let me explain to you its development.
I have been interested in the use of option data to detect sentiment and potential reversals in the market. However, I found option data on its own is full of noise. Its very difficult if not impossible for a trader to make their own subjective assessment about how option data is reflecting market sentiment.
Generally speaking, put to call ratios generally range between 0.8 to 1.1 on average. Unless there is a dramatic pump in calls or puts causing an aggressive spike up to over this range, or fall below this range, its really difficult to make the subjective assessment about what is happening.
So what I thought about trying to do was, instead of looking directly at put to call ratio, why not see what happens when you perform a correlation analysis of the PTC ratio to the underlying stock.
So I tried this in pinescript, pulling for Tradingview's ticker PCC (Total Equity Put to Call Ratio) and using the ta.correlation function against whichever ticker I was looking at.
I played around with this idea a bit, pulled the data into excel and from this I found something interesting. When there is a very significant negative or positive correlation between PTC ratio and price movement, we see a reversal impending. In fact, a significant negative or positive correlation (defined as a R value of 0.8 or higher or -0.8 or lower) corresponded to a stock reversal about 92% of the time when data was pulled on a 5 minute timeframe on SPY.
But wait, what is a correlation?
If you are not already familiar, a correlation is simply a statistical relationship. It is defined with a Pearson R correlation value which ranges from 0 (no correlation) to 1 (significant positive correlation) and 0 to -1 (significant negative correlation).
So what does positive vs negative mean?
A significant positive correlation means the correlation is moving the same as the underlying. In the case of this indicator, if there is a significant positive correlation could mean the stock price is climbing at the same time as the PTC ratio.
Inversely, it could mean the stock price is falling as well as the PTC ratio.
A significant negative correlation means the correlation is moving in the opposite direction. So in this case, if the stock price is climbing and the PTC ratio is falling proportionately, we would see a significant negative correlation.
So how does this work in real life?
To answer this, let's get into the actual indicator!
In the image above, you will see the arrow pointing to an area of significant POSITIVE correlation.
The indicator will paint the bars on the actual chart purple (customizable of course) to signify this is an area of significant correlation.
So, in the above example this means that the PTC ratio is increase proportionately to the increase in the stock price in the SAME direction (Puts are going up proportionately to the stock price). Thus, we can make the assumption that the underlying sentiment is overwhelmingly BEARISH. Why? Because option trading activity is significantly proportionate to stock movement, meaning that there is consensus among the options being traded and the movement of the market itself.
And in the above example we will see, the stock does indeed end up selling:
In this case, IWM fell roughly 1 point from where there was bearish consensus in the market.
Let's use this same trading day and same example to show the inverse:
You will see a little bit later, a significant NEGATIVE correlation developed.
In this case identified, the stock wise RISING and the PTC ratio was FALLING.
This means that Puts were not being bought up as much as calls and the sentiment had shifted to bullish .
And from that point, IWM ended up going up an additional 0.75 points from where there was a significant INVERSE correlation.
So you can see that it is helpful for identifying reversals. But what is also can be used for is identifying areas of LOW conviction. Meaning, areas where there really is no relationship between option activity and stock movement. Let's take spy on the 1 hour timeframe for this example:
You can see in the above example there really is no consensus in the option trading activity with the overarching sentiment. The price action is choppy and so too is option trading activity. Option traders are not pushing too far in one direction or the other. We can also see the lack of conviction in the option trading activity by looking at the correlation SMA (the white line).
When a ticker is experiencing volatile and good movement up and down, the SMA will generally trade to the top of the correlation range (roughly + 1.0) and then make a move down to the bottom (roughly - 1.0), see the example below:
When the SMA is not moving much and accumulating around the centerline, it generally means a lot of indecision.
Additional Indicator Information:
As I have said, the indicator is very simple. It pulls the data from the ticker PCC and runs a correlation assessment against whichever ticker you are on.
PCC pulls averaged data from all equities within the market and is not limited to a single equity. As such, its helpful to use this with indices such as SPY, IWM and QQQ, but I have had success with using it on individual tickers such as NVDA and AMD.
The correlation length is defaulted to 14. You can modify it if you wish, but I do recommend leaving it at this as the default and the testing I have done with this have all been on the 14 correlation length.
You can chose to smooth the SMA over whichever length of period you wish as well.
When the indicator is approaching a significant negative or positive relationship, you will see the indicator flash red in the upper or lower band to signify the relationship. As well, the chart will change the bar colour to purple:
Everything else is pretty straight forward.
Let me know your questions/comments or suggestions around the indicator and its applications.
As always, no indicator is meant to provide a single, reliable strategy to your trading regimen and no indicator or group of indicators should be relied on solely. Be sure to do your own analysis and assessments of the stock prior to taking any trades.
Safe trades everyone!
Put-Call Bias IndicatorThe Put-Call Bias Indicator provides a visual representation of the relative bias towards put options using CBOE data. This script calculates the Put/All ratio, displaying the difference as compared to an even 50% ratio as columns on the chart. A positive value indicates a higher proportion of puts being bought compared to the total number of options contracts.
The indicator uses weekly CBOE data to determine the Put/Call ratio, making it suitable for analyzing longer-term trends in options trading sentiment. The gray columns represent the bias towards puts, with the green horizontal line at 0 acting as a reference point to quickly identify the prevailing bias.
In addition to providing an overview of market sentiment, this indicator can also be used as a contrarian indicator. A high Put/All ratio may suggest that the market is overly bearish, potentially signaling a bullish reversal, while a low ratio may indicate an overly bullish market, potentially pointing to a bearish reversal. Please note that this indicator should be used in conjunction with other technical analysis tools and indicators for a comprehensive understanding of the market.
(This is a new version of an old script bc previous version was deleted by TradingView; republishing with a more verbose description)

COT-index rangeA graph showing the commercials (part of COT-data) positioning in relation to its own range, X periods back. I usually choose the look-back period to equal approximately one year. This will be around 52 on a weekly chart and 250 on a daily chart.
In my opinion a high data-point for the commercials is bullish and vice versa. But instead of only looking att absolute values I now look more at how the commercials are positioned compared to the previous 12 och 6 months.
Example:
a) if COT-index range = 0.8, then the commercials are in the 80th percentile for this specific look-back period, i.e. the commercials has only been more bullish 20% of the time and more bearish 80% of the time.
b) a) if COT-index range = 0.5, then the commercials are in the 50th percentile for this specific look-back period, i.e. the commercials has been more bullish 50% of the time and more bearish 50% of the time.
c) if COT-index range = 0.2, then the commercials are in the 20th percentile for this specific look-back period, i.e. the commercials has been more bullish 80% of the time and more bearish 20% of the time.
In other words, a high reading is bullish and a low reading is bearish.

Trend Reversal System with SR levelsHello All,
This is the Trend Reversal System with Support/Resistance levels script. long time ago I published it as closed source but now I upgraded it and and published as open-source with a different name. I hope it would be useful for you all while trading/analyzing.
The script has some parts in it: Setup, Count, SR levels, Risk levels & Targets . Now lets check them:
Setup Part: it has two part, Buy or Sell Setup. one of them can be active only. Buy setup: if current close checks if current is lower/equal than the close of the 5. bar. if yes then the script increases number of buy setup. and if it reaches 9 then the script checks if current low is lower/equal than the lows of last 3. and 4. bars, or if the low of the last bar is lower/equal than the lows of last 3. and 4. bars. if yes then the script increases the buy setup by 1. if these conditions met then it puts the label 'S' , same for Sell setup. S labels on both setup are potential reversals.
Count Part: If buy or sell setup reaches the 9 then Count part starts from 1. lets see buy count: If current close is lower/equal than the low of the 3. bar and buy count is lower than 12 or low of the bar 13 is less than or equal to the close of bar 8 then buy count increase or it's completed. if it's completed then the script puts C label, and it's potential reversal. of course there are some conditions that can cancel the count buy/sell or recycle/restart.
By using Setup and Count levels the script can show Support/Resistance Levels, Risk levels & Targets. SR levels are potential reversal levels.
Lets see some example screenshots:
Support/Resistance levels:
Potential Reversal levels and how setup/counts are shown:
Count part can recycle and the script shows it as 'R' , ( you can see the conditions for Recycle in the script ):
Count can be cancelled and and it's shown as 'x'
If the scripts find 9 on Setup or 13 on Count then it checks if it's a good level to buy/sell and if it decides it's good level then it shows TRSSetup Buy/Sell or TRSCount Buy/Sell and also shows the target. in following example the script checks and decide it's a good level to take long position. it can be aggressive or conservative, Conservative is recommended.
Enjoy!

Net Positions (Net Longs & Net Shorts) - By LeviathanThis script is an experimental indicator that visualizes the entering and exiting of long and short positions in the market. It also includes other useful tools, such as NL/NS Profile, NL/NS Delta, NL/NS Ratio, Volume Heatmap, Divergence finder, Relative Strength Index of Net Longs and Net Shorts, EMAs and VWMAs and more.
To avoid misinterpretation, it's important to understand some basics. The “real” ratio between net long and net short positions in a given market is always 1:1. A futures contract is an agreement between two parties to buy or sell an underlying asset at an agreed-upon price. Each contract has a long side and a short side, with one party agreeing to buy (long) and the other party agreeing to sell (short) the asset at the agreed-upon price. The long position holder anticipates that the asset's price will rise, while the short position holder expects it to fall. Because every futures contract involves both a buyer and a seller, it is impossible to have more net longs than net shorts or vice versa (in terms of the net value). For every long position opened, there must be a corresponding short position taken by another market participant (and vice versa), thus maintaining the 1:1 ratio between longs and shorts. While there can be an imbalance in the number of traders/accounts holding long and short contracts, the net value of positions held on each side remains 1 to 1.
Open Interest (OI) is a metric that tracks the number of open (unsettled) contracts in a given market. For example, Open Interest of 100 BTC means that there are currently 100 BTC worth of longs and 100 BTC worth of shorts open in the market. There may be more traders on one side holding smaller positions, and fewer traders on the other side holding larger positions, but the net value of positions on one side is equal to the net value of positions on the other side → 100 BTC in longs and 100 BTC in shorts (1:1). Consider a scenario in which a trader decides to open a long position for 1 BTC at a price of HKEX:30 ,000. For this long order to be executed, a counterparty must take the opposite side of the contract by placing an order to short 1 BTC at the same price of HKEX:30 ,000. When both the long and short orders are matched and executed, the open interest increases by 1 BTC, reflecting the addition of this new contract to the market.
Changes in Open Interest essentially tell us 3 things:
- OI Increase - new positions entered the market (both longs and shorts!)
- OI Decrease - positions exited the market (both longs and shorts!)
- OI Flat - no change in open positions due to low activity or simply lots of transfers of contracts
However, different concepts can be used to analyze sentiment, aggressiveness, and activity in the market by analyzing data such as Open Interest, price, volume, etc. This indicator combines Open Interest data and price action to simplify the visualization of positions entering and exiting the market. It is based on the following concept:
Increase in Open Interest + Increase in price = Longs Opening
Decrease in Open Interest + Decrease in price = Longs Closing
Increase in Open Interest + Decrease in price = Shorts Opening
Decrease in Open Interest + Increase in price = Shorts Closing
When "Longs Opening" occurs, the OI Delta value is added to the running total of Net Longs, and when "Longs Closing" occurs, the OI Delta value is subtracted from the running total of Net Longs.
When "Shorts Opening" occurs, the OI Delta value is added to the running total of Net Shorts, and when "Shorts Closing" occurs, the OI Delta value is subtracted from the running total of Net Shorts.
To summarize:
Net Longs: Cumulative value of Longs Opening and Longs Closing (LO - LC)
Net Shorts: Cumulative value of Shorts Opening and Shorts Closing (SO - SC)
Net Delta: Net Longs - Net Shorts
Net Ratio: Net Longs / Net Shorts
This is the fundamental logic of how this script functions, but it also includes several other tools and options. Here is an overview of the settings:
Type:
- Net Positions (display values of Net Longs, Net Shorts, Net Delta, Net Ratio as described above)
- Relative Strength (display Net Longs, Net Shorts, Net Delta, Net Ratio in the form of a momentum oscillator that measures the speed and change of movements. Same logic as RSI for price)
Display as:
- Candles (display the data in the form of candlesticks)
- Lines (display the data in the form of candlesticks)
- Columns (display the data in the form of columns)
Cumulation:
- Visible Range (data is cumulated from the first visible bar on your chart)
- Full Data (data is cumulated from the beginning)
Quoted in:
- Base Currency (all data is presented in the pair’s base currency eg. BTC)
- Quote Currency (all data is presented in the pair’s quote currency eg USDT)
OI Sources
- Pick the sources from where the data is collected (if available).
Net Positions:
- NET LONGS (show/hide Net Longs plot, choose candle colors, choose line color)
- NET SHORTS (show/hide Net Shorts plot, choose candle colors, choose line color)
- NET DELTA (show/hide Net Delta plot, choose candle colors, choose line color)
- NET RATIO (show/hide Net Ratio plot, choose candle colors, choose line color)
Moving Averages:
- Type (choose between EMA and Volume Weighted Moving Average)
- NET LONGS (show/hide NL moving average plot, choose length, choose color)
- NET SHORTS (show/hide NS moving average plot, choose length, choose color)
- NET DELTA (show/hide ND moving average plot, choose length, choose color)
- NET RATIO (show/hide NR moving average plot, choose length, choose color)
Profile:
- Profile Data (choose the source data of the profile)
- Value Area % (set the percentage width of profile’s value area)
- Positions (set the position of the profile to left or right of the visible range)
- Node Size (set the relative size of nodes to make them appear smaller or larger)
- Rows (select the amount of rows displayed by the profile to control granularity)
- POC (show/hide POC- Point Of Control and select its color)
- VA (show/hide VA- Value Area and select its color)
Divergence finder
- Source (choose the source data used by the script to compare it with price pivot points)
- Maximum distance (the maximum distance between two divergent pivot points)
- Lookback Bars Left (the number of bars to the left of the current bar that the function will consider when looking for a pivot point)
- Lookback Bars Right (the number of bars to the right of the current bar that the function will consider when looking for a pivot point)
Stats:
- Show/Hide the Stats table
- Bars Back (choose the length of data analyzed for stats in number of bars)
- Position (choose the position of the Stats table)
- Select Data you want to display in the Stats table
Additional Settings:
- Volume Heatmap (show/hide volume heatmap and select its color)
- Label Offset (select how much the plot label is shifted to the right
- Position Relative Strength Length (select the length used in the calculation)
- Value Label (show/hide OI Delta values when candles are displayed)
- Plot Labels (show/hide the labels next to the plot)
- Wicks (show/hide wick when candles are displayed)
Code used for generating profiles is taken from @KioseffTrading's "Profile Any Indicator" script (used with author's permission)

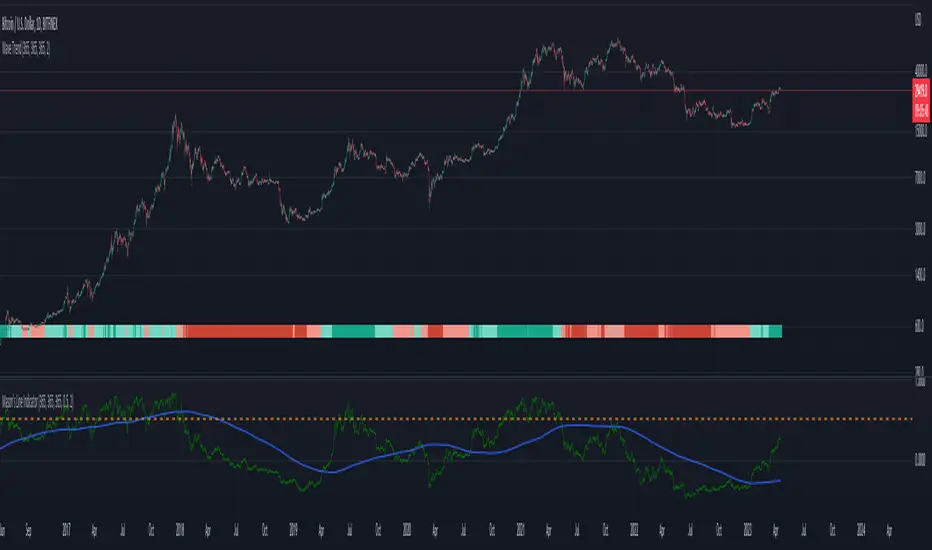
Wave TrendThe Wave Trend indicator is based on the Mason’s Line Indicator.
This indicator is a sentiment analysis tool designed to help traders understand and analyze market trends. It works by calculating the average investor satisfaction of a group of investors. The results are displayed as colored squares at the bottom of the chart. For more information, read the description of the Mason's Line Indicator.
This indicator is not developed for use on short timeframes. It is an indicator that is best suited for longer timeframes, ideal for swing trading or long-term trading.
There are two main display parameters:
Display the coloured squares according to the distance to the sma (default value).
Display the squares according to the position of satisfaction in relation to the scale of the indicator.
there are two secondary settings for each of these options:
Display the squares by normalizing the values of the dataset between 0 and 1.
Display the squares without normalizing the value of the dataset between 0 and 1 (default value).
Please note that the Wave Trend Indicator is not a guarantee of future market performance and should be used in conjunction with proper risk management. Always ensure that you have a thorough understanding of the indicator’s methodology and its limitations before making any investment decisions. Additionally, past performance is not indicative of future results.
Boftei's StrategyI wrote this strategy about a year ago, but decided to publish it just now. I have not been able to implement this strategy in the market. If you can, then I will be happy for you.
This strategy is based on my "Botvenko Script". (It finds the difference between the logarithms of closing prices from different days.) (Check this script in my profile)
Then the strategy makes trades when the "Botvenko Script" indicator crosses the levels set earlier and manually selected for each currency pair/shares: long/short opening/closing levels, long/short re-entry levels. (They are drawn with horizontal dotted lines.) The names of these lines are: buy/sell level, long/short retry - too low/high, long close up/down, dead - close the short. Manual selection of each of the parameters provides a qualitative entry of the strategy into the deal. However, without restraining mechanisms, the strategy enters into rather controversial deals. In order to avoid going long/short during bear/bull markets, which is unacceptable, I added a fan of EMA lines.
The fan consists of several EMA lines, which are set according to Fibonacci numbers (21, 55, 89, 144). If the lines in the fan are arranged in ascending order (ema_21>ema_55 and ema_55>ema_89 and ema_89>ema_144), then this indicates a bull market, during which I banned shorting. And vice versa: during the bear market (ema_21<ema_55 and ema_55<ema_89 and ema_89<ema_144) I banned long trading. If these two inequalities are not met, then this indicates that the market is flat, and during it it is allowed to enter any transactions, because a flat is a good moment to catch massive movements in the future by entering a transaction. (This is all visualized using semi-transparent thick lines of green, yellow and red colors.)
By default, all parameters are adjusted for the btc/usd (bitstamp) pair. Best of all, the strategy shows itself if 1 candle = 1 day.
At the time of writing, on the pair btcusd (bitstamp) (1d) with pyramiding = 1, the strategy shows a profit of 64728896%. If pyramiding is increased by 1, then the profit will be greater, but I still prefer pyramiding = 1.
There is a possibility that my strategy is doing complete nonsense. I don't vouch for her.
If you select parameters for other pairs of currencies/stocks, then you should not change anything in the fan of lines.
That's all, probably.
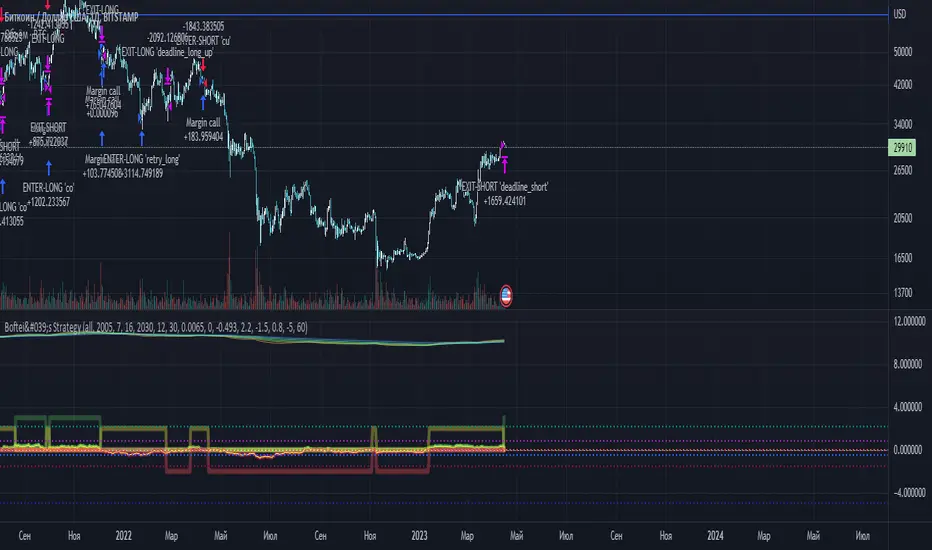
FX Sessions & Killzones ETJust another sessions indicator. Among all the many existing ones, I didn't find anything simple that would cover my needs and that would actually be correct.
New York time is forced here for plotting the stripes so you don't need to worry about the time zone currently set on your chart. The indicator will be accurate during Daylight Saving Time (which, in 2023 for example, started on Sunday, 12 March , 02:00:00 and will be in effect until Sunday, 5 November, 02:00:00).