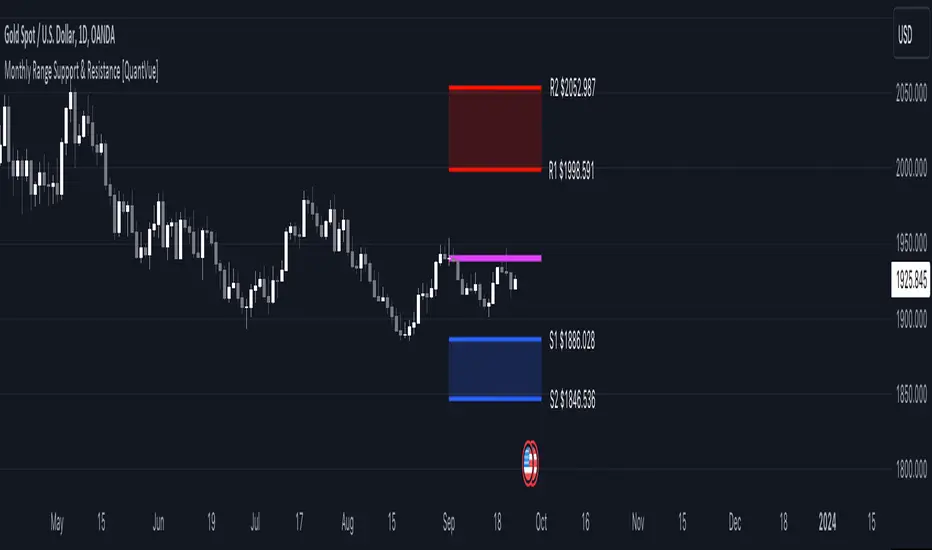
Monthly Range Support & Resistance [QuantVue]The Monthly Range Support & Resistance Levels is an advanced analytical tool designed to assess monthly price movements and provide potential support and resistance levels.
This tool examines the average monthly price fluctuations over the past 7 months (default), and creates support and resistance levels based on the opening price.
The indicator also considers a standard deviation multiplier.
This enables traders and investors to identify potential price zones.
The support and resistance levels are dynamically updated every month.
Users can also choose to view previous daily levels as well.
Customizable settings for this tool include:
-Averaging Period: Adjust the number of months to calculate the average monthly range.
-Standard Deviation Multiplier: Modify the standard deviation multiplier to fine-tune the sensitivity of the support and resistance levels. A higher multiplier will result in wider levels, accommodating higher price fluctuations.
-Toggle Support & Resistance Prices: Easily switch on or off the display of support and resistance price levels.
-Show Monthly Open Line: Display the monthly opening price as a reference point on the chart.
-Show Previous Levels: Choose whether to display past daily support and resistance levels.
Note: this indicator works on a 1 hour timeframe or higher
Give this indicator a BOOST and COMMENT your thoughts!
We hope you enjoy.
Cheers!
Resistence
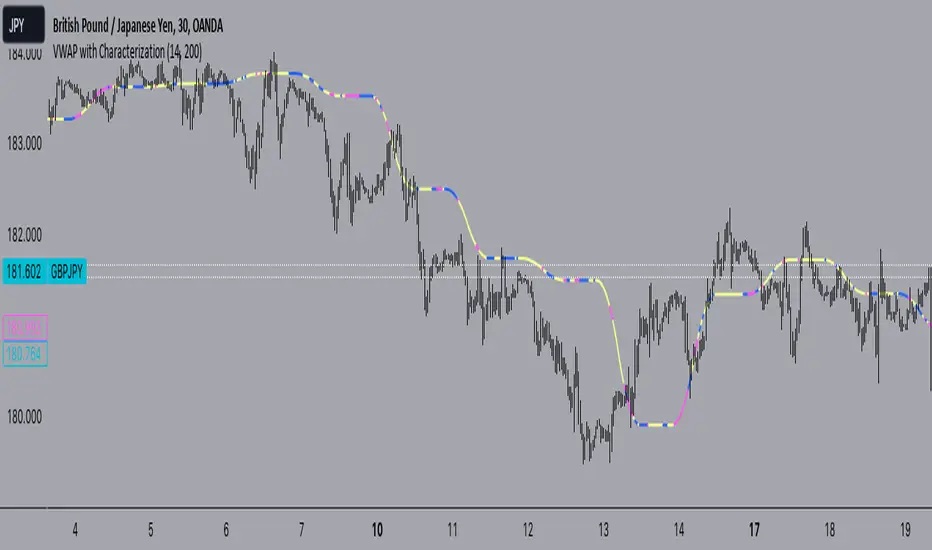
VWAP with CharacterizationThis indicator is a visual representation of the VWAP (Volume Weighted Average Price), it calculates the weighted average price based on trading volume. Essentially, it provides a measure of the average price at which an asset has traded during a given period, but with a particular focus on trading volume. In our case, the indicator calculates the VWAP for the current trading symbol, using a predefined simple moving average (SMA) with a period of 14. This volume-weighted moving average offers a clearer view of the behavior of the VWAP and, of consequence of market dynamics.
One of the distinctive features of this indicator is its ability to provide a more "linear" representation of the data. This means that the data is "smoothed" to remove noise, allowing you to more easily identify the direction of the market trend. This smoother representation is especially useful because the financial market can be subject to significant fluctuations and volatility, and this indicator can help get a more stable view of the trend.
The indicator also offers a visualization of the market trend in a very intuitive way. Using an evaluation of the highs and lows of the last 10 days, determine whether the market is in an uptrend, downtrend, or no trend at all. To make this evaluation even clearer and more immediate, the indicator line is colored dynamically. When the trend is bullish, the line is blue, while in case of a bearish trend, it takes on a distinctive color, such as pink. If the trend is not defined, the line will be colored differently, for example light yellow. This coloration gives traders an immediate visual indication of the prevailing trend, allowing them to make more informed decisions regarding trading operations.
One potential strategy involves watching candles when they cross the VWAP line strongly. If, for example, a candlestick breaks above the VWAP line, we may look for retest areas near key support levels to gauge a potential long entry. In other words, we would consider that the price may have the potential to rise further after breaking above the VWAP line, and we would look to enter a long position to take advantage of this opportunity.
On the other hand, if a candlestick crosses below the VWAP line, we might consider looking for retest areas near the VWAP line itself, which now serves as potential resistance. This could indicate a possible short entry opportunity, as the price may struggle to break above the resistance represented by the VWAP line after breaking it down. In this case, we would look to take advantage of the expected continuation of the downtrend.
In both cases, the idea is to exploit significant movements across the VWAP line as signals of potential reversal or continuation of the trend. This strategy can help identify key entry points based on price behavior relative to the VWAP line.
Encapsulation BoxThe “Encapsulation Box” indicator is designed to locate areas of the chart where the highs and lows of candlesticks are “embedded” or enclosed within the body of a previous candlestick. This setup indicates a significant contraction in the market and can provide important trading signals. Here's how it works in more detail:
Detecting contraction: The indicator looks for situations where the price range of the candles is very narrow, i.e. when subsequent candles have highs and lows that are contained within the range of a previous candle. This condition indicates a contraction in the market before a possible directional move.
When a contraction is detected, the indicator draws a rectangle around the area where the highs and lows of the candles are embedded. The rectangle has its upper vertex corresponding to the maximum of the candles involved and its lower vertex corresponding to the minimum. The width of the rectangle is defined by can be customized by the user.
A key feature of this indicator is the horizontal line drawn outside the rectangle. This line is positioned in the middle of the rectangle and represents 50% of the range of the rectangle itself. This line acts as a significant support or resistance level depending on the direction the contraction breaks.
The indicator can generate buy or sell signals when a break in the rectangle or horizontal line occurs. For example, if the price breaks above the rectangle and the horizontal line, it could generate a buy signal, indicating a possible uptrend. Conversely, if the price breaks below the rectangle and the horizontal line, it could generate a sell signal, indicating a possible downtrend.

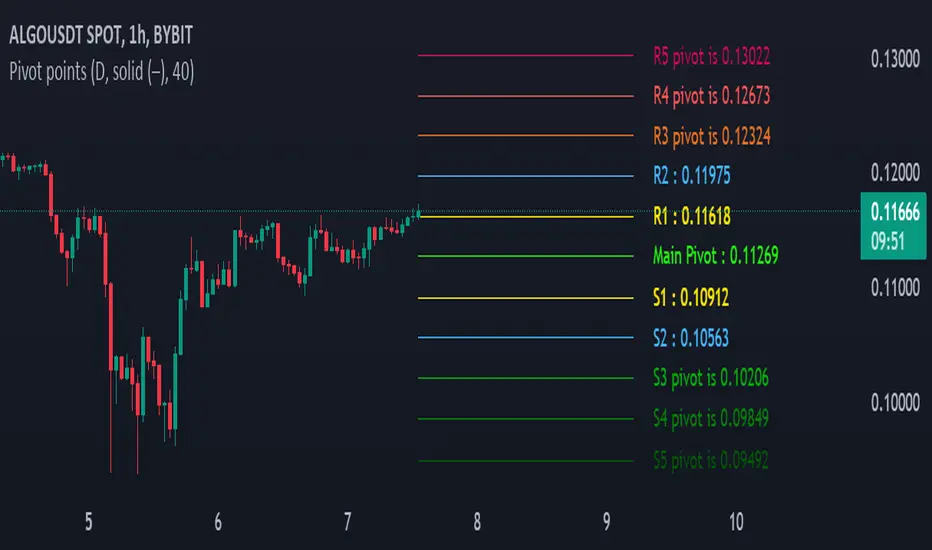
Pivot Points [MisterMoTA]The Pivot Points indicator by MisterMoTA allow users to get pivots points calculated from last candle high, low and close on any timeframe from 1 minute to weekly.
This will help users that are trading ins small timeframes to see the pivots that are near their timeframes and not only daily timeframe.
Here is an example on the chart from nex image the timeframe is set to 1 minute and pivot points displayed are at 15 minutes :
The users have control on pivots colors, pivot labels colors, text color from labels, decimal numbers displayed in the labels and style of the pivots lines.
Please follow me for other script like this one.
Kind regards,
MisterMoTA
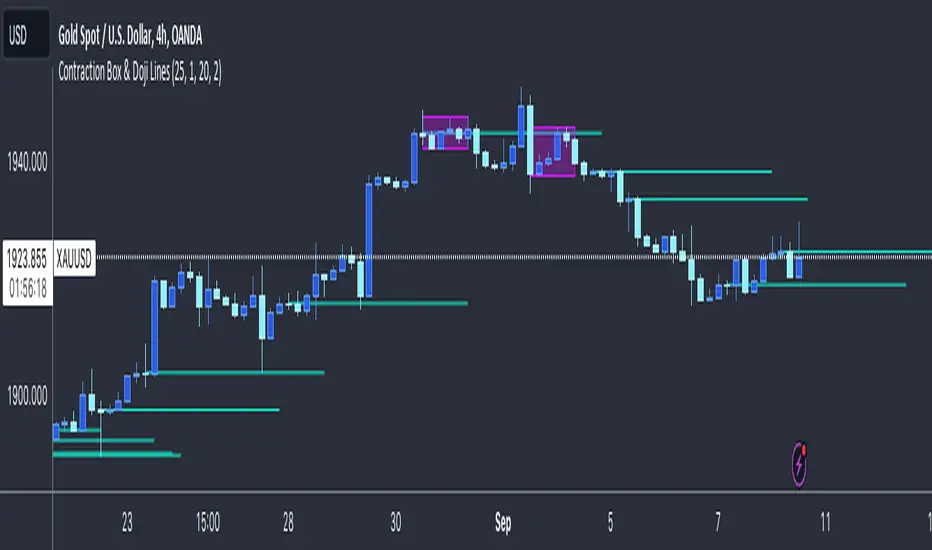
Contraction Box & Doji LinesContraction & Doji Lines indicator is designed to identify and visualize potential support and resistance levels on a price chart. It does this by detecting doji candlestick patterns and drawing horizontal lines from the middle of the doji bodies to the right. Additionally, it also highlights price contraction zones with colored boxes.
The indicator first identifies doji candlestick patterns that it suggests indecision in the market, a horizontal line and these horizontal lines can act as potential support or resistance levels. Traders can observe price reactions around these lines. If the price approaches a line and bounces off it, it may indicate a significant level in the market.
In addition to doji lines, this indicator also highlights price contraction zones. When a contraction zone is detected, a colored box is drawn to highlight this zone. The box extends from the fifth bar ago (left side) to the current bar (right side), with the highest high and lowest low of the identified zone. The color and width of this box can be customized using the "Box Line Border Color," "Box Background Color," and "Box Width" parameters.
A possible strategy could be can use the doji lines as potential support and resistance levels to make trading decisions. For example, if the price breaks above a doji line and holds, it may indicate a bullish signal.
The colored boxes highlight areas of price contraction, which often precede significant price movements. Traders can use these zones to anticipate potential breakouts or breakdowns.
For example, you might enter a long (buy) position if it anticipate a breakout from a contraction zone with a target price set above the breakout level. Conversely, you might enter a short (sell) position if they anticipate a breakdown from a contraction zone with a target price set below the breakdown level.
Support & Resistance PROHi Traders!
The Support & Resistance PRO
A simple and effective indicator that helped me a bunch!
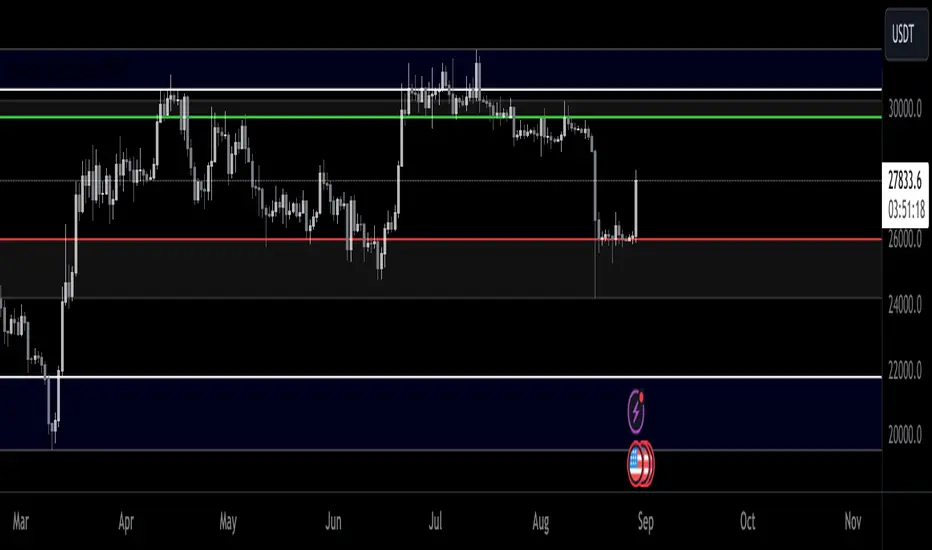
This indicator will chart simple support and resistance zones on 2 time frames of your choice.
It uses a 30 day lookback period and will find the last high and low.
Each zone is built from the highest/lowest closure, and the highest/lowest wick, creating a liquid zone between the 2.
It is perfect for people trading support and resistance, watching key areas, scalping zones and much more!
*You can change the time frames you are looking at and the lookback period.
*The example in the picture is looking at the Daily and Weekly zones on BTC.
Engulfing Box & LinesThe "Engulfing Box & Lines" indicator aims to spot and highlight Engulfing candlestick patterns within a trend. These patterns can provide valuable indications of a possible trend reversal, and the indicator underlines them through the use of colored rectangles and horizontal lines. To fully understand the functioning and use of this indicator, let's explore its key elements and associated strategies.
Identification of Engulfing Patterns:
The indicator focuses on detecting two types of Engulfing candles:
Bullish Engulfing: Occurs when a bullish candle (open lower than close) completely encloses the body of the previous bearish candle. This could indicate a possible upside reversal.
Bearish Engulfing: Occurs when a bearish candle (opening higher than closing) entirely engulfs the body of the previous bullish candle. This could signal a potential bearish reversal.
Using the EMA 200:
The indicator uses the 200-period Exponential Moving Average (EMA) as a reference to determine the position of the candles with respect to the long-term trend. When the price is above the 200 EMA, the bullish Engulfing candles are highlighted with a green box, while below the 200 EMA, red boxes are shown for the bearish Engulfing candles.
Size of Boxes and Lines:
The colored boxes represent the size of the body of the candle that caused the Engulfing. Additionally, a horizontal line is drawn close to the body of the candle, serving as the fulcrum of the indicator.
Trading Strategies:
This indicator can be used for different trading strategies:
Trend Continuation: During a positive trend, the onset of an engulfing pattern suggests a possible continuation of the trend. The horizontal lines represent potential support areas, where the price could bounce. Traders might consider buying during such bounces.
Retracements and Entries: Lines can act as support or resistance zones, depending on the trend. When the price approaches a line, a retracement could occur. Traders might move to a lower timeframe to spot entry signals, using the line as a reference.
Closing Positions: Lines could also be used to define exit levels. For example, a trader might decide to exit a position when the price approaches a resistance line.
Confirmations with Other Indicators: The indicator could be used in conjunction with other technical tools, such as oscillators or candlestick analysis, to confirm signals and improve the accuracy of trading decisions.

HTF Support & Resistance [QuantVue]The "HTF Support / Resistance" indicator highlights critical price levels across multiple timeframes helping you recognize major support/resistance areas.
Whether you're a day trader needing to understand the current day's price action, or a long-term investor looking to analyze yearly trends, this indicator can be a valuable addition to your trading toolkit.
The daily levels, which can be enabled or disabled according to your preference, will give you insights into the open, high, and low levels for the current and previous day.
Similarly, weekly levels provide information for the current and previous weeks, while monthly levels cover the current and previous months.
In addition, the indicator offers more extended views through its quarterly and yearly levels. These will help you understand long-term trends and major support/resistance areas, and they can be particularly beneficial for major support/resistance levels.
Features:
🔹Visualization: View support and resistance levels from Daily, Weekly, Monthly, Quarterly, and Yearly timeframes.
🔹Customizable Appearance: Tailor the display colors and line styles for each level according to your preferences.
🔹Clear Labeling: Each level is clearly labeled for quick identification.
🔹Extension Option: Opt to extend the support and resistance lines across the chart for better visualization.
Give this indicator a BOOST and COMMENT your thoughts!
We hope you enjoy.
Cheers.

Price breakout and reversal [TCS] | PAThis indicator is designed to identify potential breaks and reversals in price movements for a financial instrument.
The indicator displays several elements to assist users in spotting specific market conditions:
1. High and Low Pivots : The indicator marks the highest and lowest points on the price chart within a customizable lookback period. These pivots represent important turning points in the price movement and serve as reference levels for potential breakouts and reversals.
2. Fair Value Line : A horizontal line is drawn at the midpoint between the high and low pivots. This line represents the "fair value" based on the recent price action. Traders may consider this level as a reference for evaluating the price's deviation from its average value.
3. Bullish Breakouts : When the closing price of the financial instrument crosses above the high pivot the indicator identifies a potential bullish breakout. This suggests a possible buying opportunity.
4. Bearish Breakouts : Conversely, a bearish breakout is identified when the closing price crosses below the low pivot. This may indicate a selling opportunity.
5. Fair Value Breakouts : In addition to regular breakouts, the indicator can detect breakouts based on the fair value line. If the closing price crosses above or below the fair value line, it may signal a fair value breakout, indicating the price's potential return to its average level.
6. Reversals : Reversal patterns are essential in technical analysis. The indicator identifies potential bullish and bearish reversals .
The indicator enhances its visual signals with geometric shapes (triangles and diamonds) placed above or below the price bars to represent different types of breakouts and reversals.
Moreover, the indicator can be configured to send alerts to the user when any of these specific events occur, helping traders stay informed and respond promptly to potential trading opportunities.
Please note that this code is for educational purposes only and should not be used for trading without further testing and analysis.

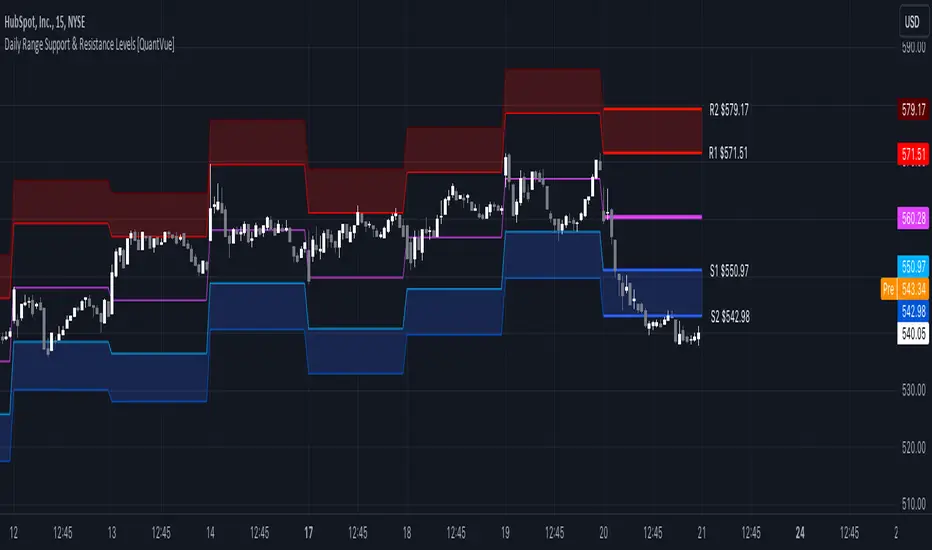
Daily Range Support & Resistance Levels [QuantVue]The Daily Range Support & Resistance Levels is an advanced analytical tool designed to assess daily price movements and provide potential support and resistance levels.
This tool examines the average daily price fluctuations over the past 150 trading days, and creates support and resistance levels based on the opening price.
The indicator also considers a standard deviation multiplier.
This enables traders and investors to identify potential price zones.
The support and resistance levels are dynamically updated every day.
Users can also choose to view previous daily levels as well.
Customizable settings for this tool include:
-Averaging Period: Adjust the number of days to calculate the average daily range.
-Standard Deviation Multiplier: Modify the standard deviation multiplier to fine-tune the sensitivity of the support and resistance levels. A higher multiplier will result in wider levels, accommodating higher price fluctuations.
-Toggle Support & Resistance Prices: Easily switch on or off the display of support and resistance price levels.
-Show Daily Open Line: Display the daily opening price as a reference point on the chart.
-Show Previous Levels: Choose whether to display past daily support and resistance levels.
Note: this indicator works best on 5 or 15 minute charts.
Give this indicator a BOOST and COMMENT your thoughts!
We hope you enjoy.
Cheers.
Sessioned EMA - Frozen EMA in post market hoursWhy I develop this indicator?
In future indices, post market data with little volume distort the moving average seriously. This indicator is to eliminate the distortion of data during low volume post market hours.
How to use?
There is a time session setting in the indicator, you can set the cash hour time, moving average outside the session will be frozen.
What this indicator gives you
This indicator give you a more make sense ema pattern, the ema lines are more respected by the prices when you set the session properly.
Setup
1. Session setting
In US indices, such as NQ, ES etc, when there was data release at 0830 hr, huge volume transaction order appears, that makes the 0830 price data important that should be included in your ema trend line calculating. If that is the case, I will set the session begin from 0830, otherwise, I start the session at 0930. Golden rule : Price with huge volume counts.
2. Time zone
The coding is decided for GMT+8 time zone, you may amend the code to fit your timezone.

Price Action Box RetracementsThe Price Action Box Retracements Indicator offers a fresh perspective on price analysis, departing from the conventional fixed-length lookback period commonly used in trading indicators. This indicator embraces a more flexible and adaptable approach, taking into account changes in price action behavior and avoiding overfitting. With a design philosophy rooted in the principle of "Keep it simple, stupid!" (KISS), this indicator allows users to customize just one variable: Price Box Size.
Imagine the price action as a journey within a box or channel, defined by significant pivots from the past that act as support and resistance levels. The Price Action Box Retracements Indicator visualizes the midpoints between these pivots, representing half-point retracements. By adjusting the "Price Box Size" variable, users can select the size of the price action box that the script will identify on the chart. A larger value will look for a larger box/channel, meaning the price will stay within it for a longer duration. Think of it as switching to a slower timeframe without changing the chart resolution.
The indicator plots a median line within the price action box, which changes color based on the position of the price action within the box. When the price action is trading below the median, the line is displayed in red, indicating a potential for short entries. Conversely, when the price action is above the box median, the line turns green, suggesting opportunities for long entries. An orange color is used when the price action breaks outside the box, signaling the start of a new trend or a measured move where the box size is expected to double.
Sudden changes in the median location are crucial signals that the price action has broken outside its previous box and created a new one. Usually, the price action will attempt to return back and test its old box boundaries or median (support/resistance) before continuing further. If the new box is positioned above the previous one, it indicates an upward channel (uptrend), while a box below the previous one suggests a descending channel (downtrend). A flat median line represents a ranging market, where the price action lacks a clear directional bias.
In addition to the median plot, the script also offers a pivot-anchored moving average, assisting traders in identifying smaller trends and potential entry points within a larger price action box.
Experience a new approach to price analysis with the Price Action Box Retracements Indicator and enhance your trading strategies with simplicity and flexibility.

TRADE WITH MACDThis indicator is used to identify the trend through the background color and by using the MACD indicator information and summarizing the moving average information and identifying the trend through the integration of information and then warning the fall and growth of the price of Bitcoin relative to the successful entry into any transaction by the trader. it helps
Some features of this indicator:
- The table draws the time frames in the desired time period quickly and accurately
- Identifying and inserting ascending and descending trends
- View the chart of five moving averages (9, 20, 50, 100, 200) at the same time
- Draw charts automatically or draw a chart with the desired interval length and desired start time
- Automatic updating of price data charts
- Changing the background color and warning in separate time frames from the current time frame as desired by the trader

Fibonacci Levels on Any Indicator [By MUQWISHI]▋ INTRODUCTION :
A “Fibonacci Levels on Any Indicator” can be applied to any indicator to draw Fibonacci levels based on provided conditions of two price points to produce a sequence of horizontal line levels starting from 0% to 100% in addition to extension levels. The 0% level is measured as the start of retracement, while the 100% level is the beginning of the extension levels. This tool was developed to be easy to add to any indicator, and it could be valuable to some traders in terms of managing trades by setting targets and reducing risk in the trend direction.
_______________________
▋ USAGE:
➤ NEEDS TO IDENTIFY 4 ELEMENTS:
1. Starting Point. What’re the conditions / When will the drawing of the Fibonacci levels begin?
2. Ending Point. What’re the conditions / When will the drawing of the Fibonacci levels end?
3. High Point. What is the price for a 100% Fibonacci level (0% for the downside)?
4. Low Point. What is the price for a 0% Fibonacci level (100% for the downside)?
➤ STARTING & ENDING POINTS CONDITIONS:
Need to specify the condition when the drawing of Fibonacci levels starts and ends, and the indicator shows different prepared conditions.
New Phase: Import a value (plot) from an existing indicator, where its status changes from NaN to a real number.
Crosses Above/Below: Import a value(1) (plot) from an existing indicator, where it crosses above/below value(2).
Reversal Up/Down: Import a value(1) (plot) from an existing indicator, where it rises/decreases than the previous value(1).
First/Last Bar: Useful to draw stationary Fibonacci levels.
➤ UPPER & LOWER PIVOTS (0% & 100%):
Need to specify the two price points representing 0% & 100% Fibonacci levels to expose the sequence of Fibonacci lines.
Upper Pivot. By default, the ATR Upper Band. It’s possible to import a custom value from an existing indicator.
Lower Pivot. By default, the ATR Lower Band. It’s possible to import a custom value from an existing indicator.
➤ FIBONACCI STYLING OPTIONS:
Ability to customize line & label style, color, reverse, and hide/show levels.
_______________________
▋ IMPLEMENTATION:
Here are some examples of implementing the indicator.
Note: All presented examples below are for demonstration purposes, and they're not trading suggestions.
# Example 1: (Reversal Up/Down)
We want to implement Fibonacci levels on the Hull MA by mohamed982 . Our requirements are as follows:
Fibonacci levels start when the Hull MA reverses up.
Fibonacci levels end when the Hull MA reverses down.
Upper Pivot is the ATR Upper Band.
Lower Pivot is the ATR Lower Band.
After adding the required indicator (Hull MA), here’re the implementation and results
# Example 2: (Crosses Above/Below)
We want to implement Fibonacci Level on the Squeeze Momentum by LazyBear . Our requirements are as follows:
Fibonacci levels start when the Squeeze Momentum histogram crosses above 0.
Fibonacci levels end when the Squeeze Momentum histogram crosses below 0.
Upper Pivot is the Bollinger Upper Band.
Lower Pivot is the Bollinger Lower Band.
After adding the required indicators (Squeeze Momentum & Bollinger Band), here’re the implementation and results
# Example 3: (Crosses Above/Below)
We want to implement Fibonacci Level on the Crossing Moving Averages. Our requirements are as follows:
Fibonacci levels start when the 20-EMA crosses above 100-MA.
Fibonacci levels end when the 20-EMA crosses below 100-MA.
Upper Pivot is the ATR Upper Band.
Lower Pivot is the ATR Lower Band.
After adding the required indicators (20-EMA & 100-MA), here’re the implementation and results
# Example 4: (New Phase: When the previous value is NaN, and the current value is a real number.)
We want to implement Fibonacci Level on the Supertrend. Our requirements are as follows:
Fibonacci levels start when an up-Supertrend (green) line shows up.
Fibonacci levels end when a down-Supertrend (red) line shows up.
Upper Pivot is the down-Supertrend.
Lower Pivot is the up-Supertrend.
After adding the required indicator (Supertrend), here’re the implementation and results
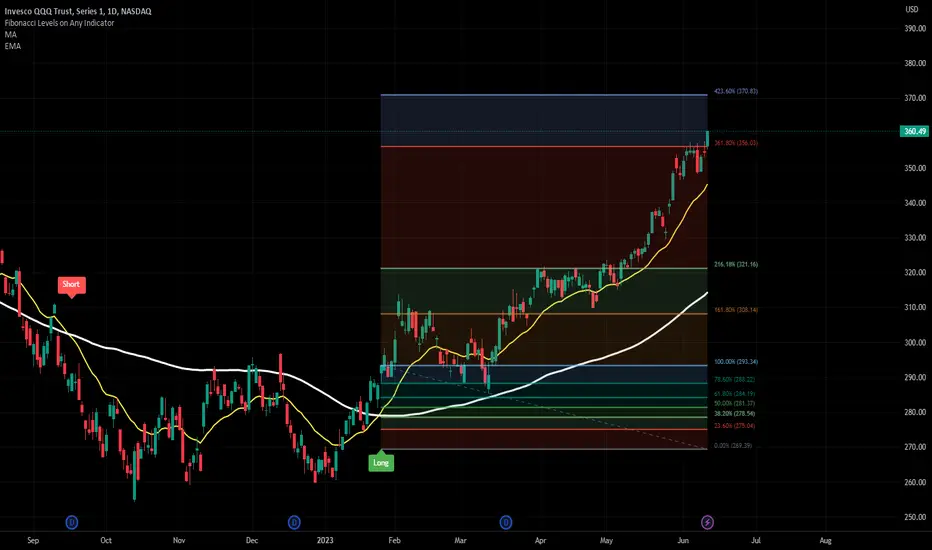
# Example 5: (First/Last Bar)
We want to implement Fibonacci Level between two points, 330 & 300. Our requirements are as follows:
Fibonacci levels start at first bar on the chart.
Fibonacci levels end at last bar on the chart.
Upper Pivot is 330.
Lower Pivot is 300.
Here’re the implementation and results.
To customize the number of bars back (like 50 bars)
_______________________
▋ Final Comments:
The “Fibonacci Levels on Any Indicator” is made to apply on other indicators for planning Fibonacci Levels.
It can be implemented in different ways, along with presented examples.
This indicator does not work with plots that were developed by drawing classes.
Please let me know if you have any questions.
Thank you.
Best Support And Resistance Indicator V1 [ForexBee]This Indicator Identifies and draws the support and resistance Zones On the Chart
🔶Overview
The support and resistance indicator is a technical indicator that will plot the support zone and resistance zone on the candlestick chart. It determines the price touches to find the strong support resistance zones.
The support and resistance indicator is the most basic technical analysis in trading. Instead of drawing zones manually, this indicator can save you time by plotting zones automatically.
🔶Working
There are specific characteristics of a valid support and resistance zone. Price always bounces upward from the support zone while it bounces downward from the resistance zone. On the other hand, when a breakout of the support or resistance zone happens, the price trends toward the breakout.
🔶Valid support zone
When the price touches a zone two to three times and bounces in a bullish direction, it is a good support zone.
The main point is that you should always find the bounces in clear price swings. The touches or bounces of the price must not be in the form of a choppy market. Price always moves in the form of swings or waves.
🔶Valid resistance zone
When the price touches a zone two to three times with a bounce in a bearish direction, then a valid resistance zone forms.
Here the price bounces must be in the form of swings or waves. You must avoid a choppy market.
So the support and resistance zone indicator finds these parameters on the chart and draws only valid zones.
🔶Settings of indicator
There are two inputs available in the indicator.
Number of bars for swing
The number of bars for the swing bars represents the size of the swing for a valid support or resistance touch. This parameter helps to filter the ranging price. the default value is 10.
Number of Tests for valid support and resistance
In this indicator, the number of pivots represents the support or resistance touches. so if you select the number 3, the indicator will only draw a zone with three touches.
🔶Features
There are the following features that this indicator identifies automatically, so you don’t need to do manual work.
Identify the valid support and resistance zones
Add the confluence of swings or waves during zone identification
Choppy market filter
We are also adding the feature of a candlestick pattern at the zone, which will be added in the next update.

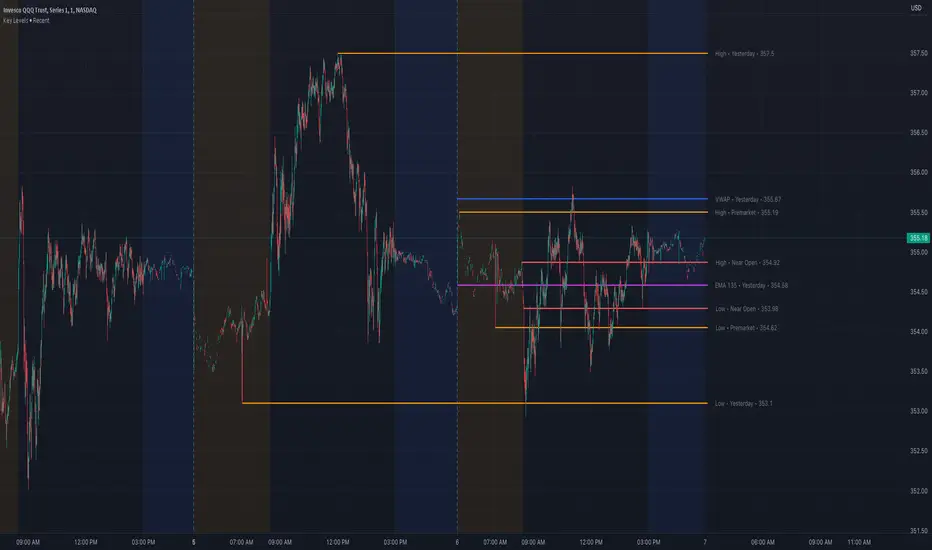
Key Levels (Open, Premarket, & Yesterday)OVERVIEW
This indicator automatically identifies and draws recent high-probability support and resistance levels (recent key levels). Specifically, yesterdays highs / lows, premarket highs / lows, as well as yesterdays end of day Volume Weighted Average Price and trader specified Moving Average.
This is most useful on charts with intraday time frames (1 minute, 5 minute etc.) commonly used for day trading. This is not ideal for larger time frames (greater than 1 hour) commonly used for swing trading or identifying larger trends.
INPUTS
You can configure:
Line size, style, and colors
Label colors
Which key levels you want to see
Moving Average Parameters
Market Hours and Time Zone
DEV NOTES
This script illustrates:
A method for iterative management of more complex data objects (not just discrete values) with loops and arrays.
Golden ZoneIntroducing the "Golden Zone" indicator, a powerful tool that simplifies the Fibonacci indicator by creating a clear Golden Zone to identify potential future price movements. The Golden Zone is a supply or demand zone that corresponds to the 61.8% and 50% Fibonacci retracement levels. These levels are important because they often mark zones where the price reacts, making it an essential area for traders to watch.
The script plots the Fibonacci levels in the background, enabling traders to identify potential support and resistance levels quickly. The Golden Zone is highlighted with a yellow filled area, making it easy to spot on the chart. Traders use this zone to identify areas where the stock price may react, either bouncing off the support level or encountering resistance at the resistance level.
For example, if a stock price is moving up and reaches the Golden Zone, a trader may look for signs of resistance and consider selling the stock if the price begins to move back down. Conversely, if a stock price is moving down and reaches the Golden Zone, a trader may look for signs of support and consider buying the stock if the price begins to move back up.
The "Golden Zone" indicator is highly versatile and can be used in all markets, whether you are a swing trader or a day trader. It can be combined with other strategies, such as an EMA crossover strategy or price action, or as an area of confluence.
In summary, the "Golden Zone" indicator is a must-have tool for traders looking to identify potential price movements and locate key support and resistance levels. Its user-friendly inputs and clear display make it a valuable addition to any trading arsenal.
So, the "Golden Zone" indicator is like a magic tool that helps people who trade in the stock market find valuable things to buy or sell. And with its ability to identify key support and resistance levels, it can help traders make better-informed decisions when buying or selling stocks.
I hope you like it!

Patrick Walker Flat BaseThis pine script is provide recent support and resistance.
Script will use ema8, ema21, sma50 and sma200 to generate the support and resistance line.
Inspired from Patrick Walker style of trading. This is my personal logic i build studying the charts.
There is 3 types of resistance generated by this script.
1) top resistance 1
when ema8 > ema21 and low > ema8 and gap between ema21 and sma50 is less than 10% and in last 3 days previous 4th days highs is not crossed by close.
2) top resistance 2
when close/open below ema21 and ema8 > ema21 and high >= ema8 and ema21 > sma50 and gap between ema21 and sma50 is less than 10%
3) bottom resistance
when ema8 < ema21 and close/open cross above ema8 but high < ema21

ICT NWOG/NDOG & EHPDA [LuxAlgo]This indicator displays New Week/Day Opening Gaps alongside Event Horizon PD Arrays which were conceptualized by a trader, ICT.
🔶 SETTINGS
Show: Determines if new week opening gaps (NWOG) or new day opening gaps (NDOG) are shown.
Amount: Controls the amount of most recent NWOGs/NDOGs to display on the chart.
Show EHPDA: Displays Event Horizons PD arrays.
🔶 USAGE
New Week/Day Opening Gaps are generally used as potential support or resistance areas.
Trader ICT describes that under consolidating market conditions, price tends to revert towards the opening gap area. This is consistent with other analysis suggesting that price has a tendency to come back toward gaps, ultimately looking to fill them.
ICT also introduces a novel concept, the "Event Horizon PD Array" (EHPDA) which are intermediary levels constructed from the average between the neighboring NWOGs or NDOGs.
EHPDA's are described by ICT as levels that "will not allow price to escape to the NWOG that will create a surge towards the NWOG it got too "close" to but has not yet reached."

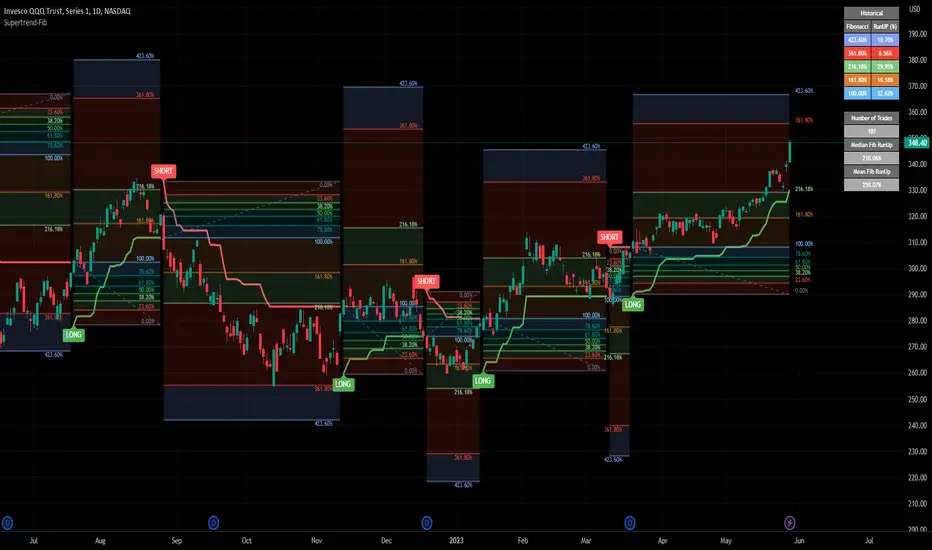
Fibonacci Levels Based on Supertrend [By MUQWISHI]A “ Fibonacci Levels Based on Supertrend ” indicator is supertrend indicator planned with Fibonacci retracements levels. Fibonacci retracements provides a sequence of levels starting from 0% to 100% in addition to extension levels. 0% is measured to be the initial Supertrend line, and 100% is the previous Supertrend line where it has been broken by candle. This tool could be valuable in terms of managing trades by setting targets and reducing the risk in the trend direction.
█ OVERVIEW
█ INDICATOR SETTINGS
Please let me know if you have any questions.
Thank you.
Trend crossierHello there!
I would like to share my script.
This is S/R levels indicator based on custom range for each step used for computing minimum/maximum of the range.
For example - we predefined step with 50 candles as one, after we have got the minimum and maximum of it - we come to the next 50 candles and do the same to it.
Finaly - we have got 20 lines for 10 steps.
After that - we set the ( SMA * mult) to have step between lines and if N of lines in range of step from eachother(if a+step > b and b+step > c ...) we call it a strong level.
It is not my idea(but my code), so I do not claim the uniqueness of this idea (the customer asked me to code it, but I also read about this method in open sources before).
The second thing - vectors of current trend direction on different timeframes.
For this task I took the same ranges, but ema () of each range. After first step it has an array with N values.
The next thing it does is take out "chain" one by one on each iteration. How does it do that? We take new AVG with neighbor values.
If we have 10 length at start - after iteration it becomes 9. So it repeats computing till length is 2.
After we have 2 points left - we can plot the line using indexes.
This way we can see the trend direction on different timeframes.
Feel free to use, change, put into another scripts. You can even never use it!
The right to publish this particular code was issued by the customer.
Have fun!

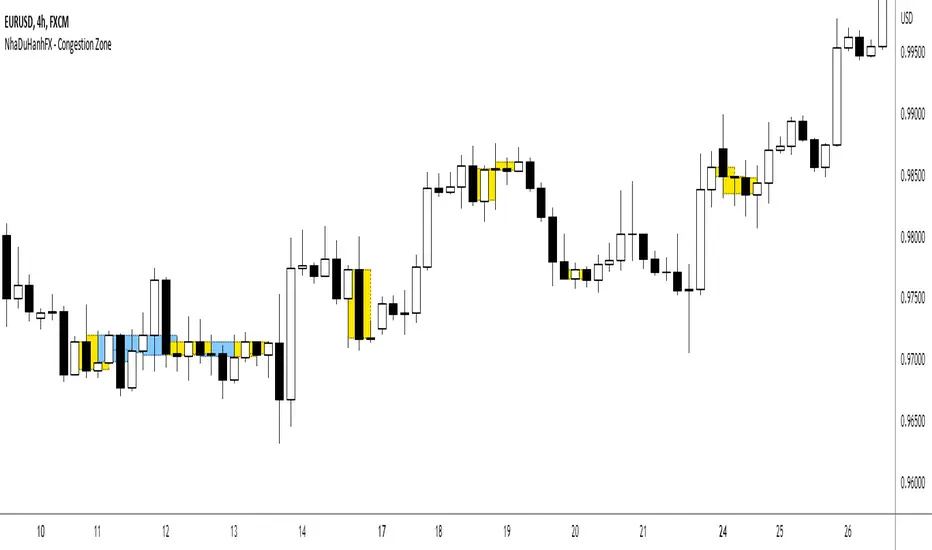
NhaDuHanhFX - Congestion Zone (Complete & Incomplete)
When the market is trending, the momentum is strong, the price often moves quickly in one direction. In the higher time frame, we see that the closing price of the candlestick is often far away from the previous candlesticks.
When the market is sideways, the momentum is weak, and prices often move slowly around an area. In the higher time frame, we see that the closing price of the candlestick is usually within the range of the previous candlesticks.
The Congestion Zone is a price action indicator that marks out such a sideways market area. It has many patterns: Complete and incomplete patterns.
- Complete Congestion Zone (Default): It includes at least 3 candlesticks that the next candlestick has a closing price within the previous candlestick range. Then, if a candlestick closes outside the range of the previous candlestick, it is a sign that the market has most likely ended the sideway, moving into a trending state.
- Incomplete Congestion Zone (Settings Option): It is more complex Congestion patterns. It also marks out sideways of the market. However, during the congestion formation, the price tried to break out of the zone with a candlestick closing outside the previous candlestick , right after that the price turns back and continues to congest.
In addition to using the Congestion Zone to predict if the market is likely to have moved from sideways to trending. The Congestion Zone is also used as a Support & Resistance area. When the price goes away and returns to the Congestion Zone, it will likely reverse.
Pay attention to the price area that previously appeared a lot of congestion zone. It is more likely to reverse.
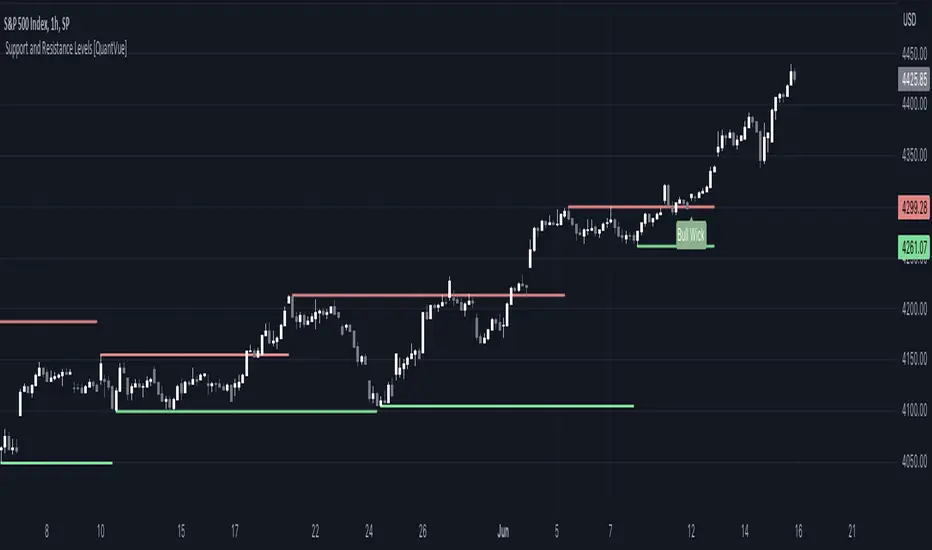
Sup/Res Levels [QuantVue]Shows basic pivot point of support and resistance levels. Will show alerts for break of sup. or res. Allows for a volume filter for sup. res. breaks as well.
"B" means break of either a Sup. or Res. level with volume greater than the threshold.
"Bull/Bear Wick" means bullish/bearish candle on break.
Left - number of bars left hand side of the pivot .
Right - number of bars right hand side of the pivot .
Volume Thres. - the threshold value (%) for the Volume.
This indicator is useful to filter our insignificant breaks of sup. or res. Can help trader determine when to sit on their hands, or enter a trade.