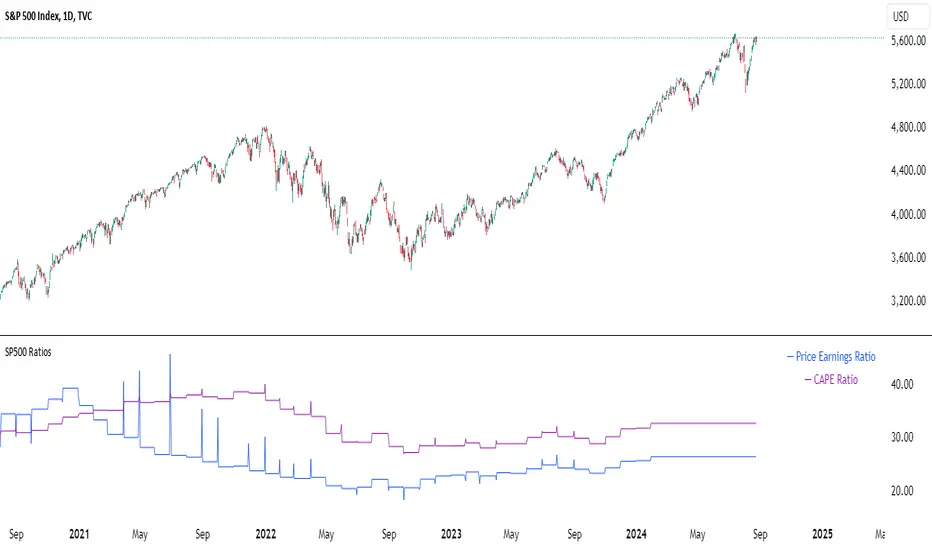
SP500 RatiosThe "SP500 Ratios" indicator is a powerful tool developed for the TradingView platform, allowing users to access a variety of financial ratios and inflation-adjusted data related to the S&P 500 index. This indicator integrates with Nasdaq Data Link (formerly known as Quandl) to retrieve historical data, providing a comprehensive overview of key financial metrics associated with the S&P 500.
Key Features
Price to Sales Ratio: Quarterly ratio of price to sales (revenue) for the S&P 500.
Dividend Yield: Monthly dividend yield based on 12-month dividend per share.
Price Earnings Ratio (PE Ratio): Monthly price-to-earnings ratio based on trailing twelve-month reported earnings.
CAPE Ratio (Shiller PE Ratio): Monthly cyclically adjusted PE ratio, based on average inflation-adjusted earnings over the past ten years.
Earnings Yield: Monthly earnings yield, the inverse of the PE ratio.
Price to Book Ratio: Quarterly ratio of price to book value.
Inflation Adjusted S&P 500: Monthly S&P 500 level adjusted for inflation.
Revenue Per Share: Quarterly trailing twelve-month sales per share, not adjusted for inflation.
Earnings Per Share: Monthly real earnings per share, adjusted for inflation.
User Configuration
The indicator offers flexibility through user-configurable options. You can choose to display or hide each metric according to your analysis needs. Users can also adjust the line width for better visibility on the chart.
Visualization
The selected data is plotted on the chart with distinct colors for each metric, facilitating visual analysis. A dynamic legend table is also generated in the top-right corner of the chart, listing the currently displayed metrics with their associated colors.
This indicator is ideal for traders and analysts seeking detailed insights into the financial performance and valuations of the S&P 500, while benefiting from the customization flexibility offered by TradingView.
Ratios
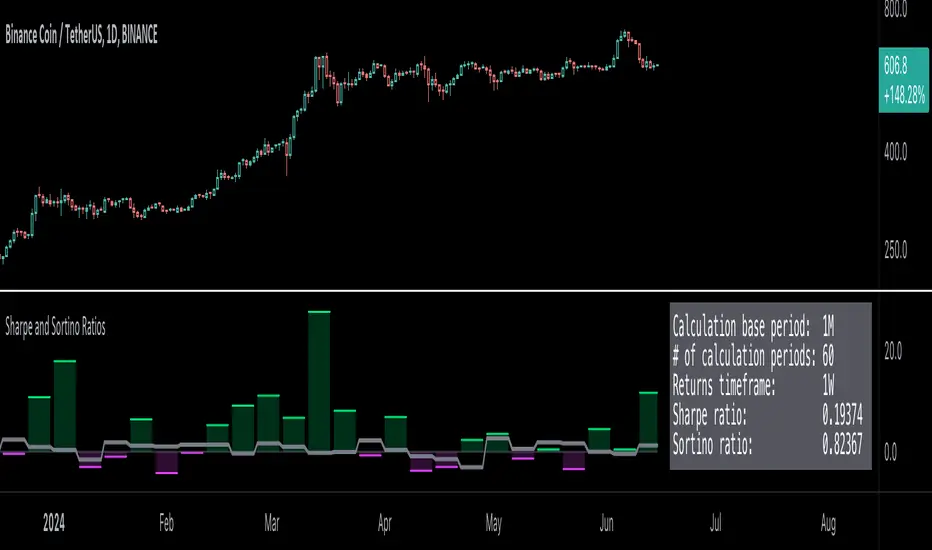
Sharpe and Sortino Ratios█ OVERVIEW
This indicator calculates the Sharpe and Sortino ratios using a chart symbol's periodic price returns, offering insights into the symbol's risk-adjusted performance. It features the option to calculate these ratios by comparing the periodic returns to a fixed annual rate of return or the returns from another selected symbol's context.
█ CONCEPTS
Returns, risk, and volatility
The return on an investment is the relative gain or loss over a period, often expressed as a percentage. Investment returns can originate from several sources, including capital gains, dividends, and interest income. Many investors seek the highest returns possible in the quest for profit. However, prudent investing and trading entails evaluating such returns against the associated risks (i.e., the uncertainty of returns and the potential for financial losses) for a clearer perspective on overall performance and sustainability.
The profitability of an investment typically comes at the cost of enduring market swings, noise, and general uncertainty. To navigate these turbulent waters, investors and portfolio managers often utilize volatility , a measure of the statistical dispersion of historical returns, as a foundational element in their risk assessments because it provides a tangible way to gauge the uncertainty in returns. High volatility suggests increased uncertainty and, consequently, higher risk, whereas low volatility suggests more stable returns with minimal fluctuations, implying lower risk. These concepts are integral components in several risk-adjusted performance metrics, including the Sharpe and Sortino ratios calculated by this indicator.
Risk-free rate
The risk-free rate represents the rate of return on a hypothetical investment carrying no risk of financial loss. This theoretical rate provides a benchmark for comparing the returns on a risky investment and evaluating whether its excess returns justify the risks. If an investment's returns are at or below the theoretical risk-free rate or the risk premium is below a desired amount, it may suggest that the returns do not compensate for the extra risk, which might be a call to reassess the investment.
Since the risk-free rate is a theoretical concept, investors often utilize proxies for the rate in practice, such as Treasury bills and other government bonds. Conventionally, analysts consider such instruments "risk-free" for a domestic holder, as they are a form of government obligation with a low perceived likelihood of default.
The average yield on short-term Treasury bills, influenced by economic conditions, monetary policies, and inflation expectations, has historically hovered around 2-3% over the long term. This range also aligns with central banks' inflation targets. As such, one may interpret a value within this range as a minimum proxy for the risk-free rate, as it may correspond to the minimum rate required to maintain purchasing power over time. This indicator uses a default value of 2% as the risk-free rate in its Sharpe and Sortino ratio calculations. Users can adjust this value from the "Risk-free rate of return" input in the "Settings/Inputs" tab.
Sharpe and Sortino ratios
The Sharpe and Sortino ratios are two of the most widely used metrics that offer insight into an investment's risk-adjusted performance . They provide a standardized framework to compare the effectiveness of investments relative to their perceived risks. These metrics can help investors determine whether the returns justify the risks taken to achieve them, promoting more informed investment decisions.
Both metrics measure risk-adjusted performance similarly. However, they have some differences in their formulas and their interpretation:
1. Sharpe ratio
The Sharpe ratio , developed by Nobel laureate William F. Sharpe, measures the performance of an investment compared to a theoretically risk-free asset, adjusted for the investment risk. The ratio uses the following formula:
Sharpe Ratio = (𝑅𝑎 − 𝑅𝑓) / 𝜎𝑎
Where:
• 𝑅𝑎 = Average return of the investment
• 𝑅𝑓 = Theoretical risk-free rate of return
• 𝜎𝑎 = Standard deviation of the investment's returns (volatility)
A higher Sharpe ratio indicates a more favorable risk-adjusted return, as it signifies that the investment produced higher excess returns per unit of increase in total perceived risk.
2. Sortino ratio
The Sortino ratio is a modified form of the Sharpe ratio that only considers downside volatility , i.e., the volatility of returns below the theoretical risk-free benchmark. Although it shares close similarities with the Sharpe ratio, it can produce very different values, especially when the returns do not have a symmetrical distribution, since it does not penalize upside and downside volatility equally. The ratio uses the following formula:
Sortino Ratio = (𝑅𝑎 − 𝑅𝑓) / 𝜎𝑑
Where:
• 𝑅𝑎 = Average return of the investment
• 𝑅𝑓 = Theoretical risk-free rate of return
• 𝜎𝑑 = Downside deviation (standard deviation of negative excess returns, or downside volatility)
The Sortino ratio offers an alternative perspective on an investment's return-generating efficiency since it does not consider upside volatility in its calculation. A higher Sortino ratio signifies that the investment produced higher excess returns per unit of increase in perceived downside risk.
The risk-free rate (𝑅𝑓) in the numerator of both ratio formulas acts as a baseline for comparing an investment's performance to a theoretical risk-free alternative. By subtracting the risk-free rate from the expected return (𝑅𝑎−𝑅𝑓), the numerator essentially represents the risk premium of the investment.
Comparison with another symbol
In addition to the conventional Sharpe and Sortino ratios, which compare an instrument's returns to a risk-free rate, this indicator can also compare returns to a user-specified benchmark symbol , allowing the calculation of Information ratios .
An Information ratio is a generalized form of the Sharpe ratio that compares an investment's returns to a risky benchmark , such as SPY, rather than a risk-free rate. It measures the investment's active return (the difference between its returns and the benchmark returns) relative to its tracking error (i.e., the volatility of the active return) using the following formula:
𝐼𝑅 = (𝑅𝑝 − 𝑅𝑏) / 𝑇𝐸
Where:
• 𝑅𝑝 = Average return on the portfolio or investment
• 𝑅𝑏 = Average return from the benchmark instrument
• 𝑇𝐸 = Tracking error (volatility of 𝑅𝑝 − 𝑅𝑏)
Comparing returns to a benchmark instrument rather than a theoretical risk-free rate offers unique insights into risk-adjusted performance. Higher Information ratios signify that the investment produced higher active returns per unit of increase in risk relative to the benchmark. Conventional choices for non-risk-free benchmarks include major composite indices like the S&P 500 and DJIA, as the resulting ratios can provide insight into the effectiveness of an investment relative to the broader market.
Users can enable this generalized calculation for both the Sharpe and Sortino ratios by selecting the "Benchmark symbol returns" option from the "Benchmark type" dropdown in the "Settings/Inputs" tab.
It's crucial to note that this indicator compares the charts symbol's rate of change (return) to the rate of change in the benchmark symbol. Consequently, not all symbols available on TradingView are suitable for use with these ratios due to the nature of what their values represent. For instance, using a bond as a benchmark will produce distorted results since each bar's values represent yields rather than prices, meaning it compares the rate of change in the yield. To maintain consistency and relevance in the calculated ratios, ensure the values from the compared symbols strictly represent price information.
█ FEATURES
This indicator provides traders with two widely used metrics for assessing risk-adjusted performance, generalized to allow users to compare the chart symbol's price returns to a fixed risk-free rate or the returns from another risky symbol. Below are the key features of this indicator:
Timeframe selection
The "Returns timeframe" input determines the timeframe of the calculated price returns. Users can select any value greater than or equal to the chart's timeframe. The default timeframe is "1M".
Periodic returns tracking
This indicator compounds and collects requested price returns from the selected timeframe over monthly or daily periods, similar to how the Broker Emulator works when calculating strategy performance metrics on trade data. It employs the following logic:
• Track returns over monthly periods if the chart's data spans at least two months.
• Track returns over daily periods if the chart's data spans at least two days but not two months.
• Do not track or collect returns if the data spans less than two days, as the amount of data is insufficient for meaningful ratio calculations.
The indicator uses the returns collected from up to a specified number of periods to calculate the Sharpe and Sortino ratios, depending on the available historical data. It also uses these periodic returns to calculate the average returns it displays in the Data Window.
Users can control the maximum number of periods the indicator analyzes with the "Max no. of periods used" input in the "Settings/Inputs" tab. The default value is 60 periods.
Benchmark specification
The "Benchmark return type" input specifies the benchmark type the indicator compares to the chart symbol's returns in the ratio calculations. It features the following two options:
• "Risk-free rate of return (%)": Compares the price returns to a user-specified annual rate of return representing a theoretical risk-free rate (e.g., 2%).
• "Benchmark symbol return": Compares the price returns to a selected benchmark symbol (e.g., "AMEX:SPY) to calculate Information ratios.
When comparing a chart symbol's returns to a specified benchmark symbol, this indicator aligns the times of data points from the benchmark with the times of data points from the chart's symbol to facilitate a fair comparison between symbols with different active sessions.
Visualization and display
• The indicator displays the periodic returns requested from the specified "Returns timeframe" in a separate pane. The plot includes dynamic colors to signify positive and negative returns.
• When the "Returns timeframe" value represents a higher timeframe, the indicator displays background highlights on the main chart pane to signify when a new value is available and whether the return is positive or negative.
• When the specified benchmark return type is a benchmark symbol, the indicator displays the requested symbol's returns in the separate pane as a gray line for visual comparison.
• Within the separate pane, the indicator displays a single-cell table that shows the base period it uses for periodic returns, the number of periods it uses in the calculation, the timeframe of the requested data, and the calculated Sharpe and Sortino ratios.
• The Data Window displays the chart symbol and benchmark returns, their periodic averages, and the Sharpe and Sortino ratios.
█ FOR Pine Script™ CODERS
• This script utilizes the functions from our RiskMetrics library to determine the size of the periods, calculate and collect periodic returns, and compute the Sharpe and Sortino ratios.
• The `getAlignedPrices()` function in this script requests price data for the chart's symbol and a benchmark symbol with consistent time alignment by utilizing spread symbols , which helps facilitate a fair comparison between different symbol types. Retrieving prices from spreads avoids potential information loss and data misalignment that can otherwise occur when using separate requests from each symbol's context when those symbols have different sessions or data times.
• For consistency, the `getAlignedPrices()` function includes extended hours and dividend adjustment modifiers in its data requests. Additionally, it includes other settings inherited from the chart's context, such as "settlement-as-close" preferences for fair comparison between futures instruments.
• This script uses the `changePercent()` function from our ta library to calculate the percentage changes of the requested data.
• The newly released `force_overlay` parameter in display-related functions allows indicators to display visuals on the main chart and a separate pane simultaneously. We use the parameter in this script's bgcolor() call to display background highlights on the main chart.
Look first. Then leap.
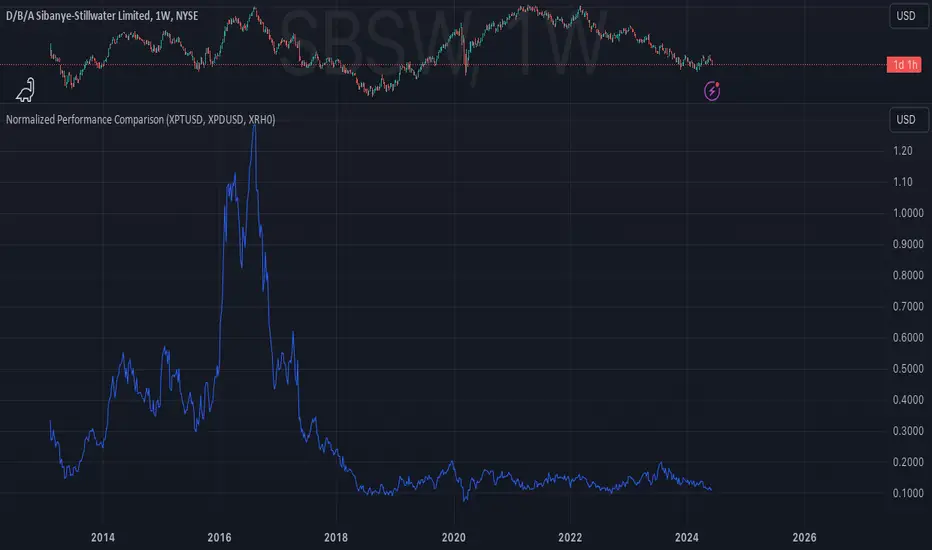
Normalized Performance ComparisonThis script visualizes the relative performance of a primary asset against a benchmark composed of three reference assets. Here's how it works:
User Inputs:
- Users specify ticker symbols for three reference assets (default: Platinum, Palladium, Rhodium).
Data Retrieval:
- Fetches closing prices for the primary asset (the one the script is applied to) and the three reference assets.
Normalization:
- Each asset's price is normalized by dividing its current price by its initial price at the start of the chart. This allows for performance comparison on a common scale.
Benchmark Creation:
- The normalized prices of the three reference assets are combined to create a composite benchmark.
Ratio Calculation:
- Computes the ratio of the normalized primary asset price to the combined normalized benchmark price, highlighting relative performance.
Plotting:
- Plots this ratio as a blue line on the chart, showing the primary asset's performance relative to the benchmark over time.
This script helps users quickly assess how well the primary asset is performing compared to a set of reference assets.
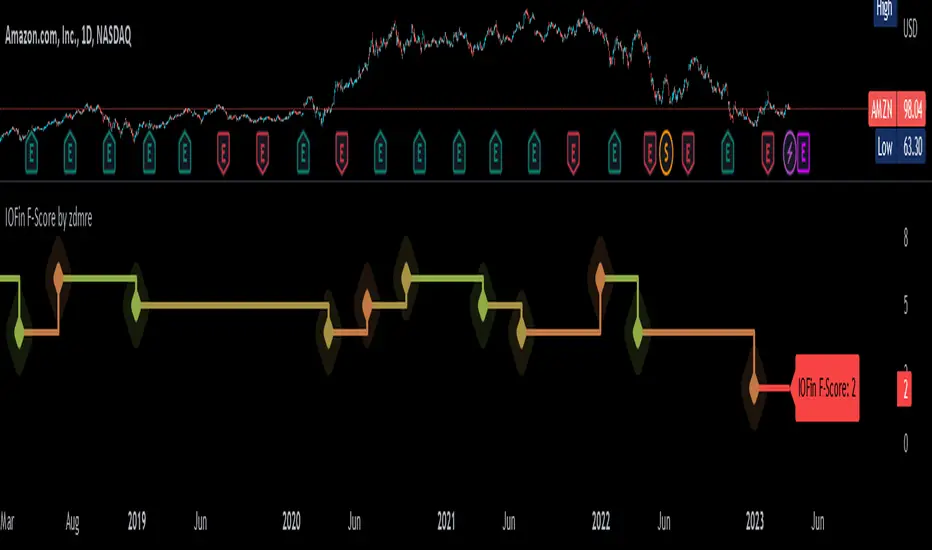
IOFin F-Score by zdmre🗣The IOFin F-Score is a discrete score between zero and ten that reflects ten criteria used to determine the strength of a firm's financial position.
🗣It is used to determine the best value stocks, with ten being the best and zero being the worst.
The IOFin F-Score broken down into the following categories:
Profitability
Equity, cash flow, liquidity, and source of funds
Operating efficiency
Criteria Include:
Price to book (P/B) lower than 3 (1 point)
Debt to Equity (D/E) lower than 0.5 (1 point)
Price to FreeCashFlow (P/FCF) equal to or lower than 20 (1 point)
Peg Ratio lower than 1 (1 point)
Sustainable Growth Rate higher than 0.3 (1 point)
Return on Assets (ROIC) higher than 0.07 (1 point)
Return on Equity (ROE) higher than 0.3 (1 point)
EnterpriseValue/Ebitda lower than 10 (1 point)
Quick Ratio equal to or higher than 1 (1 point)
Operating Margin higher than 0.15 (1 point)
Fiveral: Repulsion/Golden Radio HackAnother in a series of experimental indicators using logarithmic scale visualisation.
This one extends into some work on I've been doing on 'the cube', but Pine isn't liking multiple log lines even when the equations are included for each plotted variable, meaning, no variables used in the definition of a variable, as is done here. As a result, accuracy of this indicator can't be guaranteed between scales, or during use.
Have at it, and enjoy!

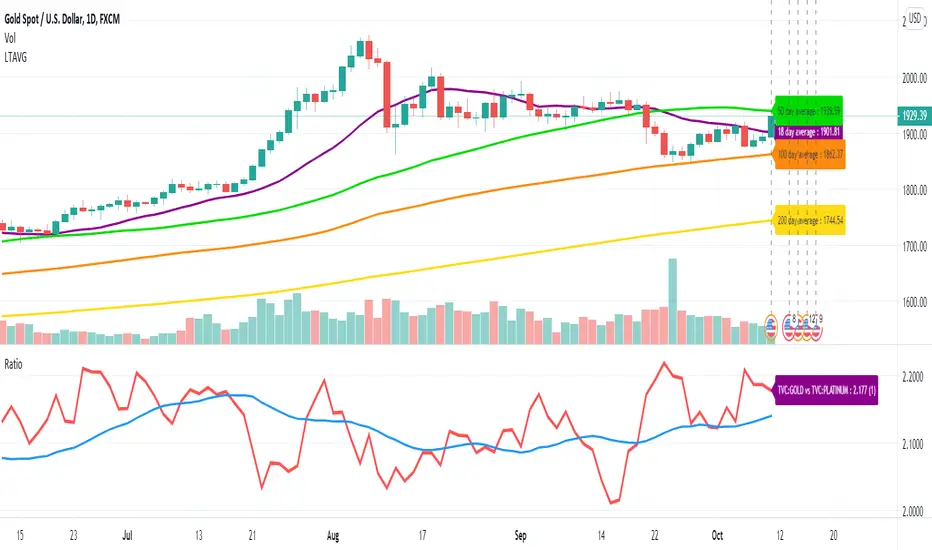
Precious Metal RatiosThis is a script that shows the ratios of precious metals, including Gold, Silver, Platinum, Palladium, Copper, Aluminum, and Steel.
You can choose your desired base currency and quote currency. The default ratio is Gold/Silver, where Gold is the base currency and Silver is the quote.
To use, just select your current timeframe from the menu.
Includes an option for repainting -- default value is true, meaning the script will repaint the current bar.
False = Not Repainting = Value for the current bar is not repainted, but all past values are offset by 1 bar.
True = Repainting = Value for the current bar is repainted, but all past values are correct and not offset by 1 bar.
In both cases, all of the historical values are correct, it is just a matter of whether you prefer the current bar to be realistically painted and the historical bars offset by 1, or the current bar to be repainted and the historical data to match their respective price bars.
As explained by TradingView,`f_security()` is for coders who want to offer their users a repainting/no-repainting version of the HTF data.

Ratio Between Two SymbolsThis scripts displays the ratio of any two symbols. The ratio is shown on a second chart.
A multiplier may be added to the ratio, and moving average is calculated.