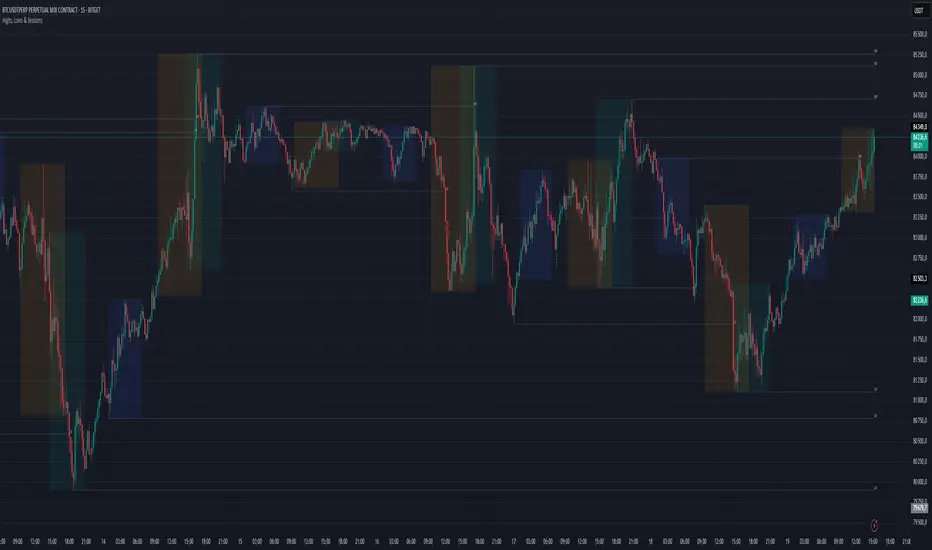
Live SessionsLive sessions plots the highs and lows of the previous for sessions.
It also marks when these are broken by price.
Default Time Frames are:
London Session = "0000-0600", "UTC-4"
New York Session = "0830-1230", "UTC-4"
Asia Session = "1800-0000", "UTC-4"
New York Close Session = "1330-1630", "UTC-4"
Useful for highlighting when price has gone through a previous session high or low and quickly seeing where liquidity still lies.
Точки разворота и уровни

Highs, Lows & SessionsHigh Low & Sessions Indicator - Purpose & Usage
The High Low & Sessions indicator is designed to provide key price levels and session-based market insights to help traders make informed decisions. It focuses on daily highs/lows, weekly highs/lows, and major trading sessions to identify support, resistance, and volatility patterns.
Key Functions of the High Low & Sessions Indicator:
Tracks Daily & Weekly Highs and Lows
Previous Day’s High & Low: Helps traders identify breakout points and potential reversals.
Previous Week’s High & Low: Provides key resistance/support levels for swing trading strategies.
Trading Session Zones
London Session: High volatility, often setting the daily trend.
New York Session: Strong liquidity, continuation or reversal of the London move.
Asian Session (Tokyo & Sydney): Lower volatility, potential accumulation phase.
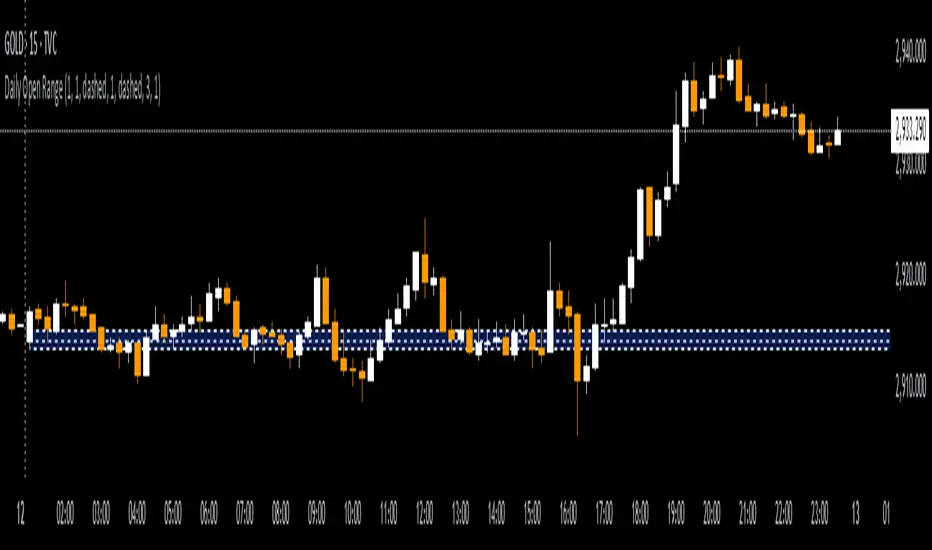
Daily Open Rangethis indicator draw the open of the day with a box of high and low ( +1 and -1 ) automatically , you have the ability to select which hour you want to to draw from the inputs and you have the ability to change the style of the range as well
OANDA:XAUUSD
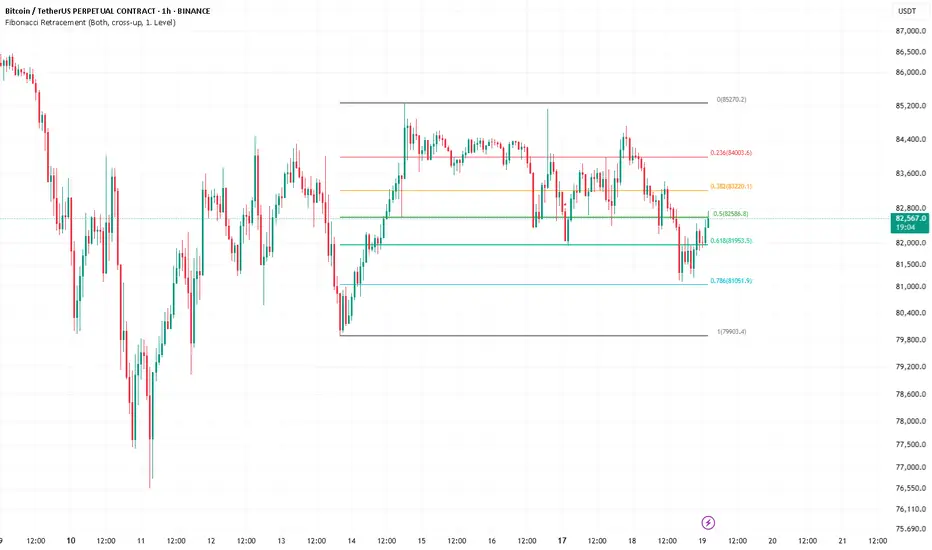
Fibonacci - DolphinTradeBot
OVERVIEW
The 'Fibonacci - DolphinTradeBot' indicator is a Pine Script-based tool for TradingView that dynamically identifies key Fibonacci retracement levels using ZigZag price movements. It aims to replicate the Fibonacci Retracement tool available in TradingView’s drawing tools. The indicator calculates Fibonacci levels based on directional price changes, marking critical retracement zones such as 0, 0.236, 0.382, 0.5, 0.618, 0.786, and 1.0 on the chart. These levels are visualized with lines and labels, providing traders with precise areas of potential price reversals or trend continuation.
HOW IT WORKS ?
The indicator follows a zigzag formation. After a large swing movement, when new swings are formed without breaking the upper and lower levels, it places Fibonacci levels at the beginning and end points of the major swing movement."
▪️(Bullish) Structure :High → HigherLow → LowerHigh
▪️(Bearish) Structure :Low → LowerHigh → HigherLow
▪️When Fibonacci retracement levels are determined, a "📌" mark appears on the chart.
▪️If the price closes outside of these levels, a "❌" mark will appear.
USAGE
This indicator is designed to plot Fibonacci levels within an accumulation zone following significant price movements, helping you identify potential support and resistance. You can adjust the pivot periods to customize the zigzag settings to your preference. While classic Fibonacci levels are used by default, you also have the option to input custom levels and assign your preferred colors.
Set the Fibonacci direction option to "upward" to detect only bullish structures, "downward" to detect only bearish structures, and "both" to see both at the same time.
"To view past levels, simply enable the ' Show Previous Levels ' option, and to display the zigzag lines, activate the ' Show Zigzag ' setting."
ALERTS
The indicator, by default, triggers an alarm when both a level is formed and when a level is broken. However, if you'd like, you can select the desired level from the " Select Level " section in the indicator settings and set the alarm based on one of the conditions below.
▪️ cross-up → If the price breaks the Fibonacci level to the upside.
▪️ cross-down → If the price breaks the Fibonacci level to the downside.
▪️ cross-any → If the price breaks the Fibonacci level in any direction.
Initial BalanceInitial Balance Pro – Precision Trading with Market Open Dynamics
The Initial Balance Pro indicator is designed to provide traders with a clear, structured view of the market's opening price action, helping to identify key levels for intraday trading. It automatically calculates and plots the initial balance (IB) high and low, allowing traders to gauge early market sentiment and potential breakout zones.
Features:
✅ Customizable Initial Balance Period – Set your preferred IB range, whether the first 30, 60, or any custom minutes after market open.
✅ Breakout & Rejection Zones – Visually highlight key areas where price action may find support, resistance, or breakout opportunities.
✅ Midpoint & Extension Levels – Identify the IB midpoint and customizable extension levels to anticipate possible price targets.
✅ Session Flexibility – Works across various trading sessions, including pre-market and post-market hours.
✅ Alerts & Notifications – Get notified when price breaches IB levels, helping you stay ahead of key moves.
Why Use Initial Balance?
The initial balance is a fundamental concept in market profile analysis. Institutional traders often set their positions within this range, making it a crucial reference point for potential trend continuation or reversal. When price breaks above or below the IB, it can signal high-probability trade opportunities, especially when combined with volume and order flow analysis.
Perfect For:
📈 Futures & Forex Traders – Utilize the IB for breakout and mean-reversion strategies.
📊 Equity & Options Traders – Identify key levels for intraday momentum plays.
🔍 Price Action Traders – Improve trade execution with a structured market approach.
Optimize your intraday trading strategy with Initial Balance Pro , giving you a refined edge in market structure and price action analysis. 🚀

Key Levels by MoneyTribe21This custom script provides real-time tracking of key market price levels, helping traders identify critical support and resistance zones. It dynamically updates throughout the trading session, making it ideal for intraday trading, breakout strategies, and market structure analysis.
Features:
Real-Time Tracking of Key Price Levels:
ATH (All-Time High): Tracks the highest price ever reached for the asset.
PDH (Previous Day High): Marks the high of the last trading day,
PDL (Previous Day Low): Marks the low of the last trading day, serving as dynamic support.
Resistance Level: Based on the current day’s high, signaling potential price rejection points.
Support Level: Based on the current day’s low, indicating potential price bounces.
Daily Open Price: Tracks the exact market open price at the start of the trading session.
Works Across All Timeframes:
Designed for intraday, swing, and long-term trading.
Automatically adjusts levels for Forex, Stocks, Crypto, and Indices.
Fully Customizable Settings:
Modify line colors, thickness, and styles for better chart readability.
Enable/disable specific levels based on trading preference.
Works on all TradingView-compatible brokers and platforms.
How to Use This Indicator:
Breakout & Reversal Trading:
If price breaks above PDH, it may indicate bullish momentum.
If price breaks below PDL, it may signal a bearish continuation.
ATH levels can act as strong resistance zones—watch for breakouts or rejection.
Dynamic Support & Resistance:
Resistance Level (Current Day High): If price fails to break, it may signal a reversal.
Support Level (Current Day Low): If price bounces off, it may confirm a strong uptrend.
Daily Open for Trend Confirmation:
Above Daily Open: Market sentiment is bullish.
Below Daily Open: Market sentiment is bearish.
Customization Options:
Toggle individual price levels ON/OFF for a clutter-free chart.
Customize colors, line styles, and alerts for better visualization.
Set alerts for breakouts & retests of key levels.
Ideal for Traders Who:
Want high-probability support & resistance zones in real-time.
Trade breakouts, reversals, or trend continuations.
Use market structure analysis for informed decision-making.
Need automatic price tracking instead of drawing levels manually.
Compatible with all TradingView timeframes & assets (Forex, Stocks, Crypto, Indices).
Designed for both beginner and advanced traders.
Add this indicator to your chart and start tracking key levels instantly.

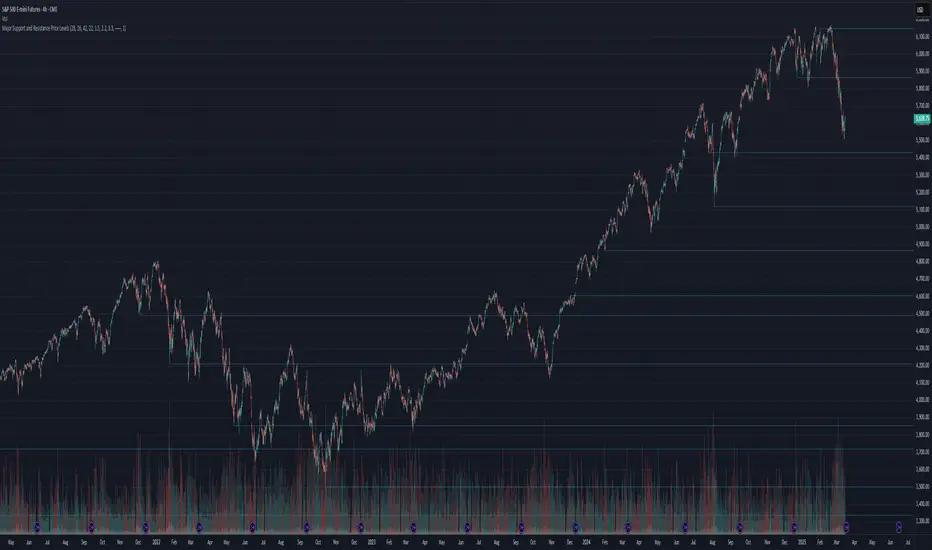
Major Support and Resistance Price LevelsThis indicator is to be used to automatically plot Major Support and Resistance Price Levels. This is not a TREND support/resistance identifier. This is strictly for auto-plotting historically important price levels.
I would suggest adjusting the support/resistance filter before adjusting the sensistivity levels as I've testing out the setting quite a bit, but as always, do what works best for your chart.
If there is an input that you would like to have me add, let me know and I'll see what I can do.
Things to Consider:
Currently this works best on the 4H through 3D chart for Identifying major price levels; however lower timeframes do still work. Because of the large swings that can be typical when coming from Afterhours trading into Market hours, timeframes under 2H can create some false positives. This is obviously not as much of an issue on crypto or forex.
I will be working on allowing lower or higher timeframes with this indicator in order to circumvent the need to jump back to other timeframes and reference them if they are under that 2h threshold.
Future Updates:
Plotting different timeframe's results on a lower or higher timeframe.
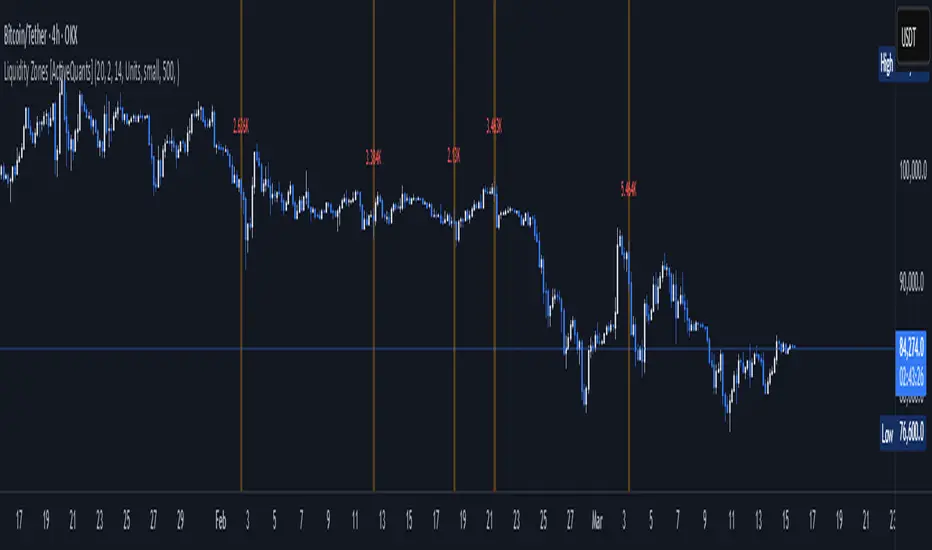
Liquidity Zones [ActiveQuants]The Liquidity Zones indicator detects price areas where high trading volume coincides with below-average volatility , critical zones where large players often accumulate or distribute positions. Ideal for spotting potential reversal points and strategic liquidity pools.
Core Detection Formula
Liquidity Zone = (Volume > SMA(Volume, Length) × Multiplier) AND (Short-Term Volatility < 0.5 × Average Volatility)
Volume Surge Detection
Compares current volume to its SMA (user-defined length).
Multiplies threshold with " Volume Threshold Multiplier " parameter.
Volatility Contraction Filter
Calculates 5-bar volatility (standard deviation of closes).
Compares to average volatility over " Price Std. Dev. Length " period.
Requires short-term volatility < 50% of average.
█ KEY FEATURES
Merging Consecutive Zones
If the " Merge Consecutive Zones " option is enabled, the indicator will:
Calculate the number of consecutive bars that meet the liquidity zone criteria.
Sum the volume of these consecutive bars.
Display only the most recent label for the merged zone (previous labels in the sequence are removed).
Displays volume in either
Raw units (" Units ").
Dollar-equivalent (" Currency Value ") using closing price.
Alerts
An alert condition is built into the script. Traders can selectively enable alerts via TradingView’s alert system. Whenever a liquidity zone is detected, an alert is triggered with the message: " High-volume and low-volatility zone detected! ".
█ USER INPUTS
- Liquidity Zones Color
Sets the background color for liquidity zones.
Default: Orange (with 70 transparency).
- Volume SMA Length
Determines the number of bars over which the volume simple moving average is calculated.
Default: 20 bars.
- Volume Threshold Multiplier
Multiplies the volume SMA to establish a threshold. A bar’s volume must exceed this product to be considered high volume.
Default: 2.0.
- Price Std. Dev. Length
The period used to calculate the standard deviation of the closing prices. This is the basis for measuring average volatility.
Default: 14 bars.
- Zone Volume
A toggle to display a label with the volume value on liquidity zones.
Allows you to choose how the volume is displayed: Units (shows raw volume) or Currency Value (multiplies volume by the current closing price).
Allows you to choose the font size of the volume label.
- Merge Consecutive Zones
When enabled, volumes from consecutive liquidity zones are summed into a single total, and only the most recent label is displayed (previous labels in the sequence are removed).
Default: Enabled.
- Show Last
Specifies the number of bars back that the indicator will evaluate and plot liquidity zones.
Default: 500 bars.
- Timeframe
Analysis period.
Default: Chart.
█ CONCLUSION
The Liquidity Zones indicator is a powerful tool for traders seeking to identify key areas on the chart where liquidity is concentrated, characterized by high volume and low volatility . With customizable settings for volume analysis and volatility measurement , this indicator can be integrated into a wide range of trading strategies. It not only highlights these zones visually but also provides volume data labels and alerts for timely decision-making.
█ IMPORTANT NOTES
⚠ Volume and Volatility Settings: Adjust the Volume SMA Length , Volume Threshold Multiplier , and Price Std. Dev. Length to suit the typical trading volume and volatility of the asset you are analyzing.
⚠ Confirmed Bars Only: Signals are generated only on confirmed bars. This minimizes false signals due to intra-bar noise and also prevents indicator repainting .
⚠ Risk Management: Liquidity zones may signal areas of potential accumulation or distribution, but they should be used in conjunction with other technical analysis tools (e.g., support/resistance levels, trendlines, or momentum indicators). Trading involves risk, and it is recommended to combine this indicator with proper risk management techniques.
█ RISK DISCLAIMER
Trading involves substantial risk of loss. Liquidity zones indicate potential interest areas but don't guarantee price reactions. Always confirm with additional analysis and proper risk management. Past performance is not indicative of future results.
📈 Happy trading! 🚀
New York Open LinesThis indicator marks key New York trading session opens on the chart. It draws horizontal lines at the New York Midnight Open (00:00 NY time) and the New York Economic Open (08:30 NY time) prices.
Key Features:
1) Customizable Line Styles & Colors:
* Users can choose between solid, dotted, or dashed lines.
* Colors are customizable for each open level.
2) Timeframe-Based Logic:
* For timeframes above 30 minutes:
- It retrieves the midnight (NYMO) and 8:30 AM (ETO) open prices using request.security_lower_tf().
- The script ensures the price is stored only once per day.
* For 30-minute timeframes and below:
- The script draws lines at the exact open prices as bars appear.
3) Line Management:
* The lines extend for 24 hours from the open.
* The previous day's lines are removed to keep the chart clean.
4) Session Reset:
* At the start of a new trading day, the stored NYMO and ETO prices reset to na to prepare for the next session.
This helps traders quickly identify key New York session levels, often used for support, resistance, and breakout trading strategies.

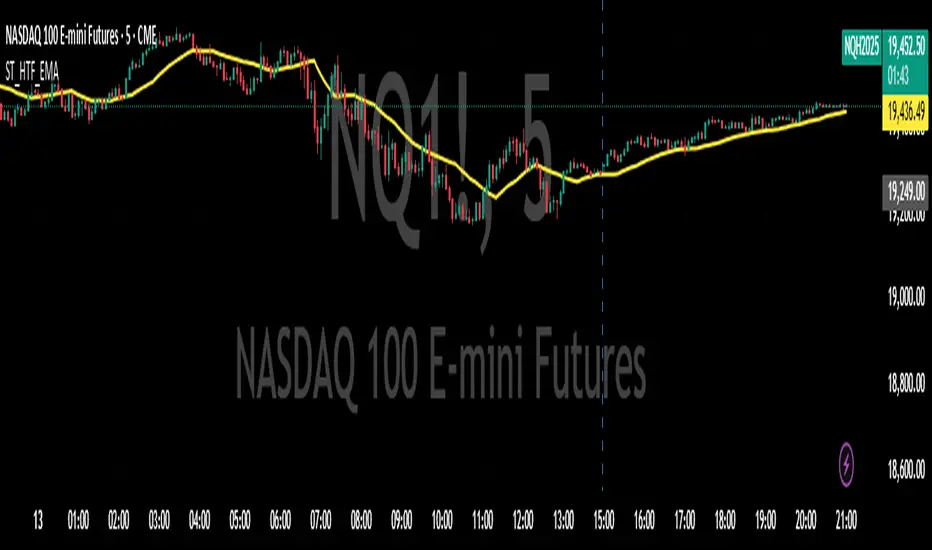
ST_HTF_EMA### **ST_HTF_EMA – Higher Timeframe EMA Overlay**
#### **Description:**
The **ST_HTF_EMA** indicator plots a **21-period Exponential Moving Average (EMA)** from a **higher timeframe** onto the current chart. This allows traders to track key trend levels from a larger perspective while trading on a lower timeframe.
#### **Features:**
- **Customizable Timeframe:** The EMA is sourced from a user-defined timeframe (default: **5-minute**).
- **EMA Calculation:** Uses the **21-period EMA** for smoothing price action and identifying trend direction.
- **Envelope Bands (Optional):** A **0.75% envelope** can be toggled on to create upper and lower bands around the EMA for potential dynamic support/resistance zones.
- **Overlay on Chart:** The EMA and envelope bands are plotted directly on the price chart for easy visibility.
#### **How to Use:**
- Use the **EMA as a trend guide**—price above the EMA suggests bullish momentum, while price below indicates bearish momentum.
- Enable the **envelope bands** (if needed) to spot price deviations from the mean for possible reversal or continuation trades.
#### **Customization:**
- Modify the **timeframe** to adapt the EMA to different market structures.
- Adjust the **envelope percentage** to fine-tune sensitivity.
#### **Visuals:**
- The **EMA is plotted in yellow** for clear visibility.
- **Envelope bands (if enabled)** appear in yellow, with a subtle background highlight.
This indicator is ideal for traders who rely on **higher timeframe trend confirmation** while making decisions on lower timeframes. 🚀
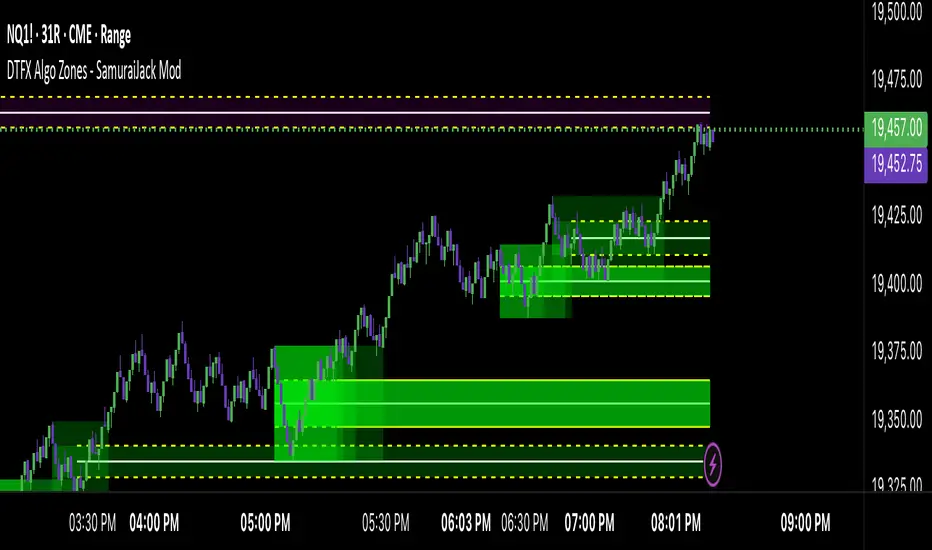
DTFX Algo Zones [SamuraiJack Mod]CME_MINI:NQ1!
Credits
This indicator is a modified version of an open-source tool originally developed by Lux Algo. I literally modded their indicator to create the DTFX Algo Zones version, incorporating additional features and refinements. Special thanks to Lux Algo for their original work and for providing the open-source code that made this development possible.
Introduction
DTFX Algo Zones is a technical analysis indicator designed to automatically identify key supply and demand zones on your chart using market structure and Fibonacci retracements. It helps traders spot high-probability reversal areas and important support/resistance levels at a glance. By detecting shifts in market structure (such as Break of Structure and Change of Character) and highlighting bullish or bearish zones dynamically, this tool provides an intuitive framework for planning trades. The goal is to save traders time and improve decision-making by focusing attention on the most critical price zones where market bias may confirm or reverse.
Logic & Features
• Market Structure Shift Detection (BOS & CHoCH): The indicator continuously monitors price swings and marks significant structure shifts. A Break of Structure (BOS) occurs when price breaks above a previous swing high or below a swing low, indicating a continuation of the current trend. A Change of Character (ChoCH) is detected when price breaks in the opposite direction of the prior trend, often signaling an early trend reversal. These moments are visually marked on the chart, serving as anchor points for new zones. By identifying BOS and ChoCH in real-time, the DTFX Algo Zones indicator ensures you’re aware of key trend changes as they happen.
• Auto-Drawn Fibonacci Supply/Demand Zones: Upon a valid structure shift, the indicator plots a Fibonacci-based zone between the breakout point and the preceding swing high/low (the source of the move). This creates a shaded area or band of Fibonacci retracement levels (for example 38.2%, 50%, 61.8%, etc.) representing a potential support zone in an uptrend or resistance zone in a downtrend. These supply/demand zones are derived from the natural retracement of the breakout move, highlighting where price is likely to pull back. Each zone is essentially an auto-generated Fibonacci retracement region tied to a market structure event, which traders can use to anticipate where the next pullback or bounce might occur.
• Dynamic Bullish and Bearish Zones: The DTFX Algo Zones indicator distinguishes bullish vs. bearish zones and updates them dynamically as new price action unfolds. Bullish zones (formed after bullish BOS/ChoCH) are typically highlighted in one color (e.g. green or blue) to indicate areas of demand/support where price may bounce upward. Bearish zones (formed after bearish BOS/ChoCH) are shown in another color (e.g. red/orange) to mark supply/resistance where price may stall or reverse downward. This color-coding and real-time updating allow traders to instantly recognize the market bias: for instance, a series of bullish zones implies an uptrend with multiple support levels on pullbacks, while consecutive bearish zones indicate a downtrend with resistance overhead. As old zones get invalidated or new ones appear, the chart remains current with the latest key levels, eliminating clutter from outdated levels.
• Flexible Customization: The indicator comes with several options to tailor the zones to your trading style. You can filter which zones to display – for example, show only the most recent N zones or limit to only bullish or only bearish zones – helping declutter the chart and focus on recent, relevant levels. There are settings to control zone extension (how far into the future the zones are drawn) and to automatically invalidate zones once they’re no longer relevant (for instance, if price fully breaks through a zone or a new structure shift occurs that supersedes it). Additionally, the Fibonacci retracement levels within each zone are customizable: you can choose which retracement percentages to plot, adjust their colors or line styles, and decide whether to fill the zone area for visibility. This flexibility ensures the DTFX Algo Zones can be tuned for different markets and strategies, whether you want a clean minimalist look or detailed zones with multiple internal levels.
Best Use Cases
DTFX Algo Zones is a versatile indicator that can enhance various trading strategies. Some of its best use cases include:
• Identifying High-Probability Reversal Zones: Each zone marks an area where price has a higher likelihood of stalling or reversing because it reflects a significant prior swing and Fibonacci retracement. Traders can watch these zones for entry opportunities when the market approaches them, as they often coincide with order block or strong supply/demand areas. This is especially useful for catching trend reversals or pullbacks at points where risk is lower and potential reward is higher.
• Spotting Key Support and Resistance: The automatically drawn zones act as dynamic support (below price) and resistance (above price) levels. Instead of manually drawing Fibonacci retracements or support/resistance lines, you get an instant map of the key levels derived from recent price action. This helps in quickly identifying where the next bounce (support) or rejection (resistance) might occur. Swing traders and intraday traders alike can use these zones to set alerts or anticipate reaction areas as the market moves.
• Trend-Following Entries: In a trending market, the indicator’s zones provide ideal areas to join the trend on pullbacks. For example, in an uptrend, when a new bullish zone is drawn after a BOS, it indicates a fresh demand zone – buying near the lower end of that zone on a pullback can offer a low-risk entry to ride the next leg up. Similarly, in a downtrend, selling rallies into the highlighted supply zones can position you in the direction of the prevailing trend. The zones effectively serve as a roadmap of the trend’s structure, allowing trend traders to buy dips and sell rallies with greater confidence.
• Mean-Reversion and Range Trading: Even in choppy or range-bound markets, DTFX Algo Zones can help find mean-reversion trades. If price is oscillating sideways, the zones at extremes of the range might mark where momentum is shifting (ChoCH) and price could swing back toward the mean. A trader might fade an extended move when it reaches a strong zone, anticipating a reversion. Additionally, if multiple zones cluster in an area across time (creating a zone overlap), it often signifies a particularly robust support/resistance level ideal for range trading strategies.
In all these use cases, the indicator’s ability to filter out noise and highlight structurally important levels means traders can focus on higher-probability setups and make more informed trading decisions.
Strategy – Pullback Trading with DTFX Algo Zones
One of the most effective ways to use the DTFX Algo Zones indicator is trading pullbacks in the direction of the trend. Below is a step-by-step strategy to capitalize on pullbacks using the zones, combining the indicator’s signals with sound price action analysis and risk management:
1. Identify a Market Structure Shift and Trend Bias: First, observe the chart for a recent BOS or ChoCH signal from the indicator. This will tell you the current trend bias. For instance, a bullish BOS/ChoCH means the market momentum has shifted upward (bullish bias), and a new demand zone will be drawn. A bearish structure break indicates downward momentum and creates a supply zone. Make sure the broader context supports the bias (e.g., if multiple higher timeframe zones are bullish, focus on long trades).
2. Wait for the Pullback into the Zone: Once a new zone appears, don’t chase the price immediately. Instead, wait for price to retrace back into that highlighted zone. Patience is key – let the market come to you. For a bullish setup, allow price to dip into the Fibonacci retracement zone (demand area); for a bearish setup, watch for a rally into the supply zone. Often, the middle of the zone (around the 50% retracement level) can be an optimal area where price might slow down and pivot, but it’s wise to observe price behavior across the entire zone.
3. Confirm the Entry with Price Action & Confluence: As price tests the zone, look for confirmation signals before entering the trade. This can include bullish reversal candlestick patterns (for longs) or bearish patterns (for shorts) such as engulfing candles, hammers/shooting stars, or doji indicating indecision turning to reversal. Additionally, incorporate confluence factors to strengthen the setup: for example, check if the zone overlaps with a key moving average, a round number price level, or an old support/resistance line from a higher timeframe. You might also use an oscillator (like RSI or Stochastic) to see if the pullback has reached oversold conditions in a bullish zone (or overbought in a bearish zone), suggesting a bounce is likely. The more factors aligning at the zone, the more confidence you can have in the trade. Only proceed with an entry once you see clear evidence of buyers defending a demand zone or sellers defending a supply zone.
4. Enter the Trade and Manage Risk: When you’re satisfied with the confirmation (e.g., price starts to react positively off a demand zone or shows rejection wicks in a supply zone), execute your entry in the direction of the original trend. Immediately set a stop-loss order to control risk: for a long trade, a common placement is just below the demand zone (a few ticks/pips under the swing low that formed the zone); for a short trade, place the stop just above the supply zone’s high. This way, if the zone fails and price continues beyond it, your loss is limited. Position size the trade so that this stop-loss distance corresponds to a risk you are comfortable with (for example, 1-2% of your trading capital).
5. Take Profit Strategically: Plan your take-profit targets in advance. A conservative approach is to target the origin of the move – for instance, in a long trade, you might take profit as price moves back up to the swing high (the 0% Fibonacci level of the zone) or the next significant zone or resistance level above. This often yields at least a 1:1 reward-to-risk ratio if you entered around mid-zone. More aggressive trend-following traders may leave a portion of the position running beyond the initial target, aiming for a larger move in line with the trend (for example, new higher highs in an uptrend). You can also trail your stop-loss upward behind new higher lows (for longs) or lower highs (for shorts) as the trend progresses, locking in profit while allowing for further gains.
6. Monitor Zone Invalidation: Even after entering, keep an eye on the behavior around the zone and any new zones that may form. If price fails to bounce and instead breaks decisively through the entire zone, respect that as an invalidation – the market may be signaling a deeper reversal or that the signal was false. In such a case, it’s better to exit early or stick to your stop-loss than to hold onto a losing position. The indicator will often mark or no longer highlight zones that have been invalidated by price, guiding you to shift focus to the next opportunity.
Risk Management Tips:
• Always use a stop-loss and don’t move it farther out in hope. Placing the stop just beyond the zone’s far end (the swing point) helps protect you if the pullback turns into a larger reversal.
• Aim for a favorable risk-to-reward ratio. With pullback entries near the middle or far end of a zone, you can often achieve a reward that equals or exceeds your risk. For example, risking 20 pips to make 20+ pips (1:1 or better) is a prudent starting point. Adjust targets based on market structure – if the next resistance is 50 pips away, consider that upside against your risk.
• Use confluence and context: Don’t take every zone signal in isolation. The highest probability trades come when the DTFX Algo Zone aligns with other analysis (trend direction, chart patterns, higher timeframe support/resistance, etc.). This filtered approach will reduce trades taken in weak zones or counter-trend traps.
• Embrace patience and selectivity: Not all zones are equal. It can be wise to skip very narrow or insignificant zones and wait for those that form after a strong BOS/ChoCH (indicating a powerful move). Larger zones or zones formed during high-volume times tend to produce more reliable pullback opportunities.
• Review and adapt: After each trade, note how price behaved around the zone. If you notice certain Fib levels (like 50% or 61.8%) within the zone consistently provide the best entries, you can refine your approach to focus on those. Similarly, adjust the indicator’s settings if needed – for example, if too many minor zones are cluttering your screen, limit to the last few or increase the structure length parameter to capture only more significant swings.
⸻
By combining the DTFX Algo Zones indicator with disciplined confirmation and risk management, traders can improve their timing on pullback entries and avoid chasing moves. This indicator shines in helping you trade what you see, not what you feel – the clearly marked zones and structure shifts keep you grounded in price action reality. Whether you’re a trend trader looking to buy the dip/sell the rally, or a reversal trader hunting for exhaustion points, DTFX Algo Zones provides a robust visual aid to elevate your trading decisions. Use it as a complementary tool in your analysis to stay on the right side of the market’s structure and enhance your trading performance.
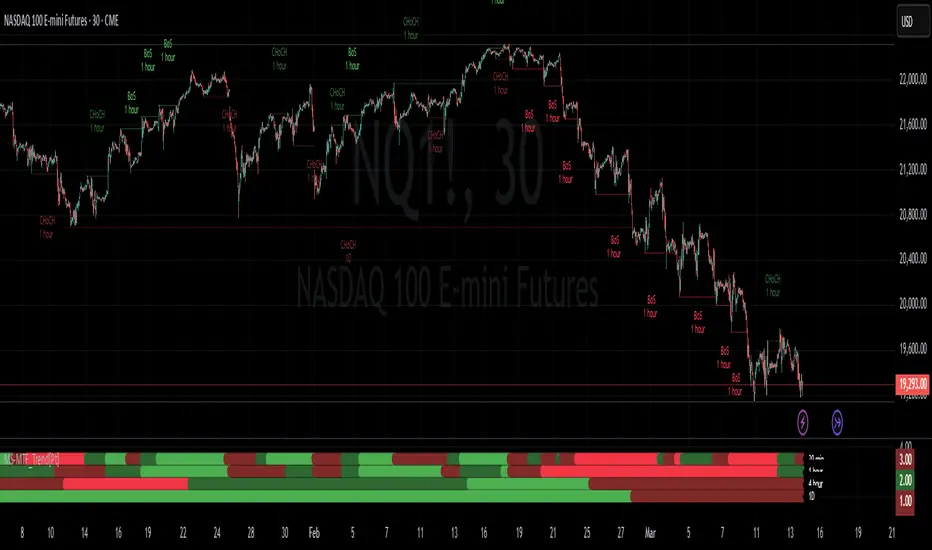
Market Structure MTF Trend [Pt]█ Author's Notes
There are numerous market structure indicators in the TradingView library, each offering a unique approach to identifying price action shifts. Market Structure MTF Trend was created with simplicity and flexibility in mind—providing a highly customizable multi-timeframe setup, visually clear trendlines, and straightforward labeling. This combination helps both new and experienced traders easily spot and interpret market structure changes.
█ Overview
Market Structure MTF Trend is a powerful yet user-friendly indicator designed to identify and visualize key turning points in price action. It focuses on two core concepts:
Change of Character (CHoCH): A momentary shift in the market’s behavior, signaling that the current price movement may be losing momentum and could soon reverse.
Break of Structure (BoS): A more definitive event confirming a new price pattern, where the market establishes a fresh trend direction by surpassing previous swing highs or lows.
By combining these signals across up to four different timeframes, even traders unfamiliar with market structure can quickly learn to spot and validate potential trend reversals or continuations.
█ Key Features
Multi-Timeframe Analysis: Monitors CHoCH and BoS events simultaneously on multiple intervals (e.g., 15m, 30m, 60m, 240m), providing a clear, layered understanding of market dynamics.
Straightforward Visual Cues: Labels are placed directly on the chart at swing highs and lows, while colored bars at the bottom give an instant snapshot of whether each timeframe is bullish or bearish.
Configurable Timeframes & Pivot Strength: Easily set up the desired intervals and adjust pivot strength to tune how sensitive the indicator is to minor price fluctuations.
Color-Coded Signals: Different colors help you distinguish between potential early reversals (CHoCH) and confirmed shifts (BoS), ensuring each signal’s importance is immediately clear.
█ Usage & Benefits
Learn Market Structure Basics: For those new to swing highs/lows, CHoCH, and BoS, the script’s on-chart labels and dynamic bar coloring provide a practical, visual way to grasp these concepts.
Spot Reversals Early: CHoCH alerts you to possible shifts in momentum, allowing you to anticipate trend changes before they fully develop.
Confirm Trend Breaks: BoS events confirm that the market has established a new directional bias, reinforcing higher‐probability entry or exit points.
Reduce Noise & Stay Focused: The multi-timeframe setup ensures you won’t overlook larger trends or get lost in smaller fluctuations.
Streamline Decision-Making: Color-coded bars let you gauge overall market sentiment at a glance—ideal for quickly validating trades without juggling multiple charts.
Market Structure MTF Trend is perfect for traders who want to learn or refine their understanding of price action. By integrating multiple timeframes into a single, cohesive interface, this tool highlights both subtle shifts and confirmed breaks in market structure, empowering you to trade with greater insight and confidence.
Dynamic Probability Bands (Historical Bands)Dynamic Probability Bands (Blended/Original Modes)
This indicator displays dynamic probability bands that estimate the likelihood (on a 0–100 scale) for a stock to move within certain price zones relative to a dynamically calculated center. It combines state‐of‐the‐art volatility scaling with customizable center calculation methods, allowing traders to analyze both current and historical price probability levels.
Key Features:
Dual Center Modes:
Original Mode: Uses either an EMA or yesterday’s pivot (average of high, low, and close) as the center.
Blended Mode: Inspired by HPDR Bands, it calculates the center by blending a long-term “visible” range (expanded by custom multipliers) with recent price extremes. This blending makes the center both robust and responsive.
Volatility Scaling with Exponential Factor: The script measures volatility using ATR and expands the forecast range over a user-defined number of bars. An exponent factor lets you adjust the dynamic expansion—from the familiar square-root behavior (with a factor of 0.5) to more aggressive widening.
Probability Levels via Inverse Normal Function: Custom inverse error and inverse-normal functions convert cumulative probability inputs (ranging from near 0% to almost 100%) into z-scores. The resulting band levels are computed as: Band Level = Center + (Scaled Volatility × z-score) Separate series are generated for upward (above the center) and downward (below the center) bands.
Historical Analysis & Visualization: The bands are plotted as continuous series, with fill colors between adjacent bands for clear visual separation. This lets you analyze how the probability zones have evolved over time.
Fully Customizable: Users can adjust key parameters including the choice of center method, lookback periods, multipliers, forecast horizon, and expansion dynamics to suit various markets and strategies.
Use This Indicator To:
Assess potential future price zones based on statistical probability.
Monitor the dynamic evolution of price ranges as market conditions change.
Customize your analysis through blended or traditional center calculations and variable volatility scaling.

JJ/CG - Dynamic Mean Reversion Indicator with Candle Size FilterDynamic Mean Reversion Indicator (DMR 250 EMA)
📌 Best Timeframes: 5m / 15m / 1hr
📊 Works on All Markets: Crypto, Forex, Stocks, Commodities
How It Works (Based on Script)
This indicator is built around the 250 EMA (Exponential Moving Average) and tracks price movements in relation to it. It identifies extreme price deviations and detects when price has moved too far from the EMA, signaling potential reversion points.
🔹 Core Components:
250 EMA as a Baseline
The script calculates a 250-period EMA, which acts as a dynamic trend guide.
Price Deviation Calculation
The script measures the absolute difference between price and the 250 EMA.
It tracks the highest deviation over a set lookback period (default: 1000 candles).
A dynamic threshold is created based on the highest historical deviation, multiplied by a user-defined factor (default: 0.85).
Candle Size Filter
The script calculates the average candle size over a lookback period (default: 50 candles).
If a candle is significantly larger than the average (based on a multiplier, default: 2.0x), it is flagged as an important move.
Long & Short Signal Conditions
Long Signal (Buy Signal):
Price is significantly below the EMA (beyond the dynamic threshold).
A large candle is present.
Short Signal (Sell Signal):
Price is significantly above the EMA (beyond the dynamic threshold).
A large candle is present.
Alerts & Visuals
When conditions are met, the script plots "Buy" signals below the price and "Sell" signals above the price.
Users can set up alerts to get notified when a signal occurs.
How to Use It
Price tends to revert to the 250 EMA after extreme deviations.
Use this indicator with support/resistance levels, RSI, and Stochastic for confirmation.
Best used in volatile markets where price moves sharply away from the mean.
⚠ Not a standalone indicator – combine with other tools for better accuracy! 🚀ator – use it with RSI, Stochastic, and solid TA for best results! 🚀

RCI NovaRCI Nova - Advanced Trading Indicator 🚀
Description
RCI Nova is an advanced Rank Correlation Index (RCI) indicator designed to provide a clear and visually appealing analysis of overbought and oversold market conditions. With optimized color coding, smart alerts, and smooth transparency effects, RCI Nova allows traders to make fast and confident trading decisions without cluttered visuals.
Key Features & Capabilities
✅ Enhanced Visualization – Modern color scheme inspired by Volume Pulse Pro, ensuring a clean and easy-to-read display.
✅ Dual RCI Analysis – Tracks Short RCI (fast movements) and Middle RCI (medium-term trends) for better market timing.
✅ Custom Overbought & Oversold Zones – Adjustable thresholds (default: ±75) with transparent red (overbought) and cyan (oversold) highlights.
✅ Real-Time Alerts – Get instant notifications when Short or Middle RCI crosses into overbought or oversold territory.
✅ Optimized for Speed – No lag or unnecessary calculations, ensuring smooth performance on any timeframe.
✅ Universal Market Compatibility – Works on Forex, Crypto, Stocks, and Indices.
How It Works
📌 When Short RCI crosses above 75, the market is considered overbought → Potential short setup.
📌 When Short RCI crosses below -75, the market is oversold → Potential long setup.
📌 Middle RCI provides trend confirmation, helping to filter false signals.
🚀 RCI Nova is the next-gen RCI tool for professional traders who want clarity, speed, and efficiency.
🔹 Customize, Trade Smarter, and Stay Ahead of the Market! 🔹

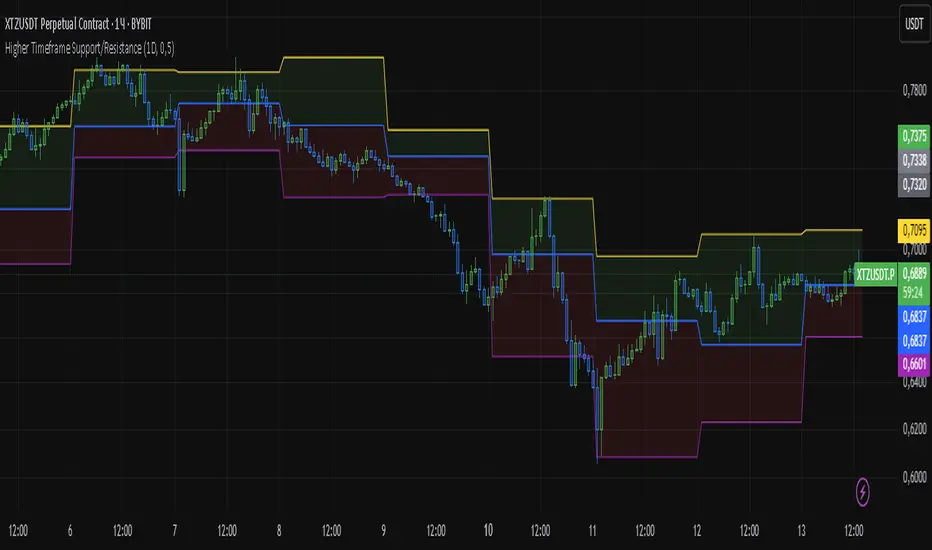
Higher Timeframe Support/ResistanceMulti-Timeframe Support/Resistance Indicator
This TradingView indicator helps you monitor important support and resistance levels based on the previous candle’s high, low, and close from a higher timeframe. By default, it uses a daily timeframe, but you can adjust this to any timeframe you want.
Key Features:
- Previous Candle High (PCH) and Previous Candle Low (PCL):
These levels are plotted on your chart (if enabled) and can act as potential support and
resistance zones. You can toggle the visibility of these levels.
- Pivot, Resistance (R1), and Support (S1):
The script calculates Pivot, R1 (Resistance), and S1 (Support) levels based on the previous
candle's price action from the selected higher timeframe.
These levels are displayed on your chart and can be used to identify potential breakout or
reversal points.
- Alert Feature:
Alerts are triggered when the price approaches any of these key levels (PCH, PCL, Pivot, R1,
or S1) within a specified threshold (e.g., 0.5%).
This helps traders react quickly to potential price movements near critical levels.
- Visual Representation:
The script visually fills the areas between Pivot and R1 (Resistance-Pivot Zone) and Pivot and
S1 (Support-Pivot Zone) with color for easy identification of key price zones.
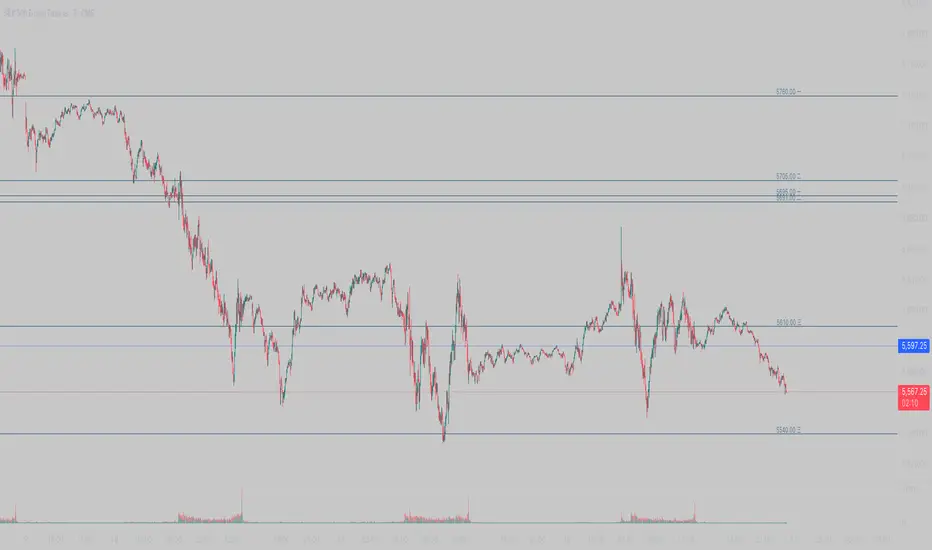
Mancini LevelsOverview
This script draws levels at comma-separated groups of numbers. The settings panel has 3 groups of numbers: 一, 二, 三.
Example
Adding 5900, 5955 in the 二 group will add a horizontal line at 5900 and 5955 with labels 5900 二 and 5955 二.
Purpose
To quickly add Mancini levels (obtained from his newsletter).
Use
1. Get support and resistance levels from Mancini's newsletter. E.g.:
5950 (major), 5938-40 (major), 5924...6096-98 (major), 6104 (major), 6112, 6116 (major)
2. Enter levels here to parse. (Trading View prevents external links, so unfortunately I had to remove the link to my parsing tool. This script can still be used by manually entering Mancini's levels into the corresponding fields in settings.)
3. Copy parsed levels into the corresponding fields in settings.
Notes
1. There's a limit to the number of entries the script will draw correctly. Consider removing regular levels that are far from current price action.
2. Crucial levels are up to the user. Mancini defines regular and major levels in his newsletter; sometimes he emphasizes particular levels, which I place in the crucial category. Easily toggle levels from regular or major to crucial using the parsing tool in step 2 above.
PivotSri(+) - Advanced TraditionalPivot Points Indicator
Description:
The Sri(+) Pivot Points Indicator is a powerful and customizable tool for traders looking to analyze key support and resistance levels based on Next Day CPR, Daily, Weekly, and Monthly Pivot Points. This indicator automatically calculates classic pivot levels, including support and resistance lines, providing valuable insights into market trends and potential reversal zones.
The script offers:
✅ Pivot Points Calculation - Determines key price levels using a standard pivot formula.
✅ Multi-Timeframe Support - Displays pivot points from different timeframes (Daily, Weekly, Monthly).
✅ Support & Resistance Levels (S1 to S5 / R1 to R5) - Visualizes multiple levels of support and resistance for precise market structure analysis.
✅ Customizable Colors & Styles - Allows traders to personalize pivot lines, background colors, and transparency for better visibility.
✅ Dynamic Box Display for TC & BC - Highlights the range between Top Central (TC) and Bottom Central (BC) pivot levels.
✅ Automatic Timeframe Adjustment - The script ensures pivots are aligned properly across different trading sessions.
✅ Central Pivot Range (CPR) Analysis - Identifies bullish or bearish trends based on price action relative to the Monthly CPR.
✅ No Repainting - Uses historical pivot data to ensure stable and accurate plotting.
How It Works
Pivot Calculation: The script calculates the central pivot point (P) based on the previous period’s high, low, and close prices.
Support & Resistance: The indicator derives S1-S5 and R1-R5 levels to help identify potential breakout and retracement zones.
Monthly CPR-Based Trend Bias:
If the stock is trading below the Monthly CPR, it indicates a bearish trend.
If the stock is trading above the Monthly CPR, it suggests a bullish trend.
Weekly & Monthly Adjustments: The pivot levels are updated dynamically to match the selected timeframe, ensuring traders always have relevant market data.
Pros of Using Sri(+) Pivot Indicator
🚀 Enhanced Decision Making – Identify key price zones where the market may react.
📈 Perfect for Day & Swing Traders – Get Daily, Weekly, and Monthly pivots for short and long-term analysis.
🎨 Customizable Appearance – Adjust colors, line widths, and transparency for optimal chart visibility.
⏳ Multi-Timeframe Flexibility – Works on any timeframe, from intraday scalping to long-term trend analysis.
🔄 Reliable and Accurate – No repainting; pivots remain fixed once calculated.
📊 Supports Technical Confluence – Combine with other indicators like SuperTrend, RSI, CCI, or Volume for stronger trading signals.
📉 CPR-Based Trend Confirmation – Quickly assess market bias based on price location relative to the Monthly CPR.
How to Use
1️⃣ Add the script to your TradingView chart.
2️⃣ Customize pivot settings according to your trading style.
3️⃣ Observe the Monthly CPR trend bias for directional confirmation.
4️⃣ Use the plotted levels to determine potential entry & exit points.
5️⃣ Combine with other technical indicators for improved trade confirmation.
🎯 Best Used For:
✅ Scalping & Day Trading
✅ Swing Trading
✅ Trend Reversals & Breakout Strategies
✅ Confluence with Other Indicators
Final Thoughts
The Sri(+) Pivot Indicator is an essential tool for traders looking to leverage pivot points, support, and resistance levels effectively. With its customizable settings, CPR-based trend bias, and multi-timeframe support, this script can significantly enhance your trading strategy.
📢 If you find this useful, don’t forget to give it a LIKE and SHARE with fellow traders! 🚀🎯

Rally Base Drop SND Pivots [LuxAlgo]The Rally Base Drop SND Pivots indicator uses "Rally", "Base", and "Drop" Candles to determine pivot points at which supply and demand (SND) levels are drawn.
🔶 USAGE
Rally, Base, and Drop (RBD) candles create a formula for seeing market structure through a fixed methodology. We are able to use this concept to point out pivot areas where Rallies and Drops directly meet.
The RBD SND Pivots are similar to traditionally identified "fractal" pivot points, with one key difference.
RBD SND Pivots detect a specific number of Rally and Drop candles directly back-to-back, requiring one side of the pivot to contain entirely green candles and the other to be entirely red candles or vice versa.
Since these pivot levels are based on Rally, Base, and Drop candles, the method directly implements rigid logic to further structure a trading system when utilizing these pivot levels with traditional SND concepts.
Furthermore, by implementing this logic when looking for pivots, a significant portion of potential noise is naturally filtered out.
🔶 DETAILS
In typical SND systems, the term "Base" is used for multiple meanings.
In this indicator, the base is a product of a pivot being formed. Once a Pivot is identified, the "Base" is marked as the first Rally or Drop of the second half of the pivot formation.
Once the pivot is identified, the high or low of the base candle is used to measure the pivot level.
🔶 SETTINGS
Length: Sets the number of Rally and Drop Candles that the script will require to identify pivots.
Ex. "3" = 3 Rally followed by 3 Drop
Historical Lookback: Hides historic levels based on a bar # Lookback from the current bar.
When set to 0, all Levels will display. (0 by default)
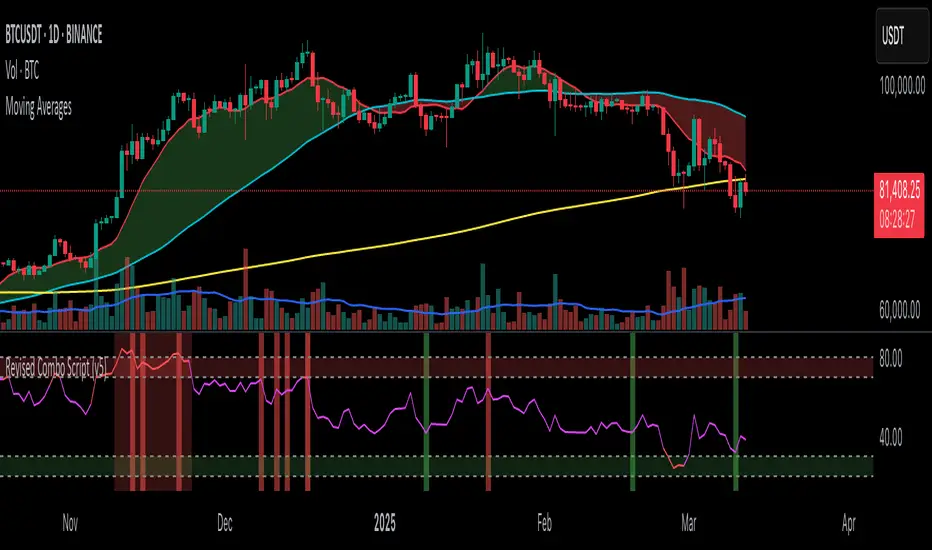
Revised Combo Script with DivergencesRevised Combo Script with Divergences (v5)
This comprehensive TradingView indicator combines multiple technical analysis tools to provide traders with a robust framework for identifying potential buy and sell signals. The script integrates several popular indicators and patterns, including RSI, Stochastic, EMA, Keltner Channels, and candlestick patterns, to enhance decision-making in trading.
Key Features:
RSI Analysis:
Configurable RSI length and overbought/oversold levels.
Visual bands for overbought and oversold conditions.
Divergence detection to identify potential trend reversals.
Stochastic Oscillator:
Customizable %K and %D periods with smoothing options.
Helps identify overbought and oversold conditions in the market.
Exponential Moving Averages (EMA):
Fast and slow EMAs to determine trend direction.
Configurable lengths and offsets for precise tuning.
Keltner Channels:
Dynamic volatility-based channels using true range or range options.
Helps identify potential breakout and reversal points.
Envelope Indicator:
Configurable length and percentage for upper and lower bands.
Option to use EMA or SMA for the basis calculation.
Candlestick Patterns:
Detection of key patterns such as Engulfing, Hammer, Shooting Star, and Doji.
Visual markers for easy identification on the chart.
Trade Signals:
Generates buy and sell signals based on a combination of indicator conditions.
Background color changes to indicate bullish or bearish signals.
Alerts:
Configurable alerts for buy and sell signals, as well as bullish and bearish divergences.
This script is designed for traders who want a comprehensive tool to analyze market conditions and make informed trading decisions. By combining multiple indicators and patterns, it provides a holistic view of the market, helping traders identify potential entry and exit points with greater confidence.
Note: This script is intended for educational purposes and should be used in conjunction with other analysis methods. Always perform your own research and consider risk management strategies before making trading decisions.
Auto Draw ToolAuto Draw Tool for TradingView – Trend, Support/Resistance & Fibonacci Indicator ( HIMANSHU AGNIHOTRY)
The Auto Draw Tool is a powerful TradingView indicator that automatically detects trend lines, support & resistance levels, and Fibonacci retracement zones. It helps traders identify key price levels and market trends without manual effort.
🔹 Features
✔ Automatic Support & Resistance Detection – Finds the strongest price levels based on past highs and lows
✔ Trend Line Auto-Plotting – Detects market trends using swing highs and lows
✔ Fibonacci Retracement Levels – Highlights key retracement points for potential reversals
✔ Candlestick Pattern Detection – Identifies bullish and bearish engulfing patterns
✔ Background Alerts for Patterns – Highlights candlestick patterns with color-coded backgrounds
✔ Works on Any Timeframe – Suitable for scalping, swing trading, and long-term investing
🛠 How It Works?
Support & Resistance Levels: The script calculates the highest and lowest price levels within a given lookback period.
Trend Line Identification: It detects swing highs and swing lows to draw automatic trend lines.
Fibonacci Retracement: The script marks important Fibonacci levels (0%, 23.6%, 38.2%, 50%, 61.8%, 78.6%, 100%) for potential entry and exit points.
Engulfing Candlestick Patterns: It recognizes bullish engulfing and bearish engulfing patterns, which indicate strong buying or selling pressure.
Alerts & Background Highlighting: When an engulfing pattern is detected, the background color changes (green for bullish, red for bearish).
🔔 Alerts & Signals
🚀 Bullish Engulfing Detected: Green background & buy signal alert
🚀 Bearish Engulfing Detected: Red background & sell signal alert
🎯 Who Can Use It?
✅ Day Traders & Scalpers – Quickly identify key price action levels
✅ Swing Traders – Find strong support/resistance and Fibonacci retracement areas
✅ Trend Followers – Confirm trend direction with auto-drawn trend lines
✅ Price Action Traders – Get real-time candlestick pattern alerts

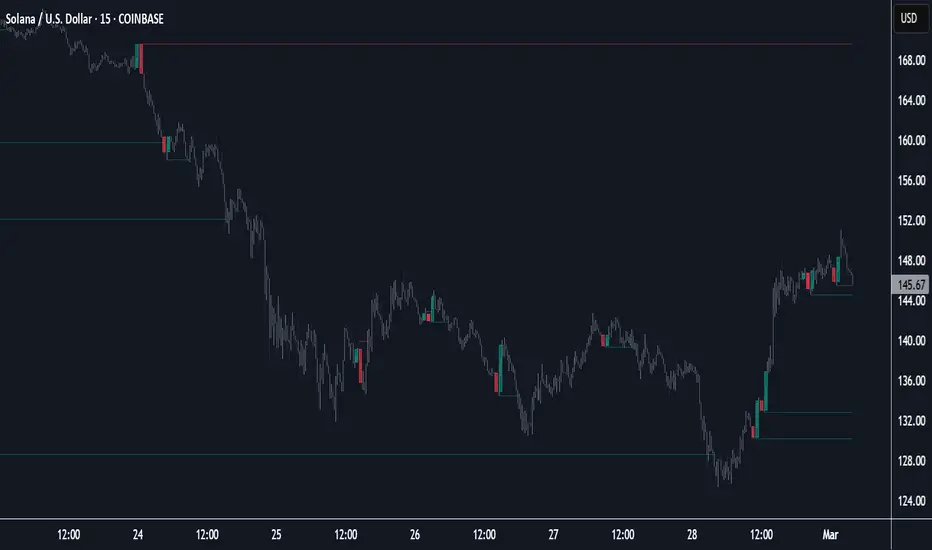
52W CP/H & H/L with percentage % differences52 Week High/Low Indicator with percentage difference between High/Low & High/Current Price
A simple indicator that can be used on any timeframe to display the 52 week High/Low values along with percentage differences (rounded) between High/Low & High/Current Price to get an idea of the strength in the instruments current price to it's 52 week journey.
Features
* Works on any timeframe.
* Simple horizontal lines showing only the current 52 week values.
* Allows the user to select whether to calculate the 52-week values from candle close values or the respective highs/lows.
* Allows users to toggle percentages label on/off
This script is open source for users to refine as per their needs. Additionally I would appreciate any constructive feedback. Thank you

SemiCircle Cycle Notation PivotsFor decades, traders have sought to decode the rhythm of the markets through cycle theory. From the groundbreaking work of HM Gartley in the 1930s to modern-day cycle trading tools on TradingView, the concept remains the same: markets move in repeating waves with larger cycles influencing smaller ones in a fractal-like structure, and understanding their timing gives traders an edge to better anticipate future price movements🔮.
Traditional cycle analysis has always been manual, requiring traders to painstakingly plot semicircles, diamonds, or sine waves to estimate pivot points and time reversals. Drawing tools like semicircle & sine wave projections exist on TradingView, but they lack automation—forcing traders to adjust cycle lengths by eye, often leading to inconsistencies.
This is where SemiCircle Cycle Notation Pivots indicator comes in. Semicircle cycle chart notation appears to have evolved as a practical visualization tool among cycle theorists rather than being pioneered by a single individual; some key influences include HM Gartley, WD Gann, JM Hurst, Walter Bressert, and RayTomes. Built upon LonesomeTheBlue's foundational ZigZag Waves indicator , this indicator takes cycle visualization to the next level by dynamically detecting price pivots and then automatically plotting semicircles based on real-time cycle length calculations & expected rhythm of price action over time.
Key Features:
Automated Cycle Detection: The indicator identifies pivot points based on your preference—highs, lows, or both—and plots semicircle waves that correspond to Hurst's cycle notation.
Customizable Cycle Lengths: Tailor the analysis to your trading strategy with adjustable cycle lengths, defaulting to 10, 20, and 40 bars, allowing for flexibility across various timeframes and assets.
Dynamic Wave Scaling: The semicircle waves adapt to different price structures, ensuring that the visualization remains proportional to the detected cycle lengths and aiding in the identification of potential reversal points.
Automated Cycle Detection: Dynamically identifies price pivot points and automatically adjusts offsets based on real-time cycle length calculations, ensuring precise semicircle wave alignment with market structure.
Color-Coded Cycle Tiers: Each cycle tier is distinctly color-coded, enabling quick differentiation and a clearer understanding of nested market cycles.
