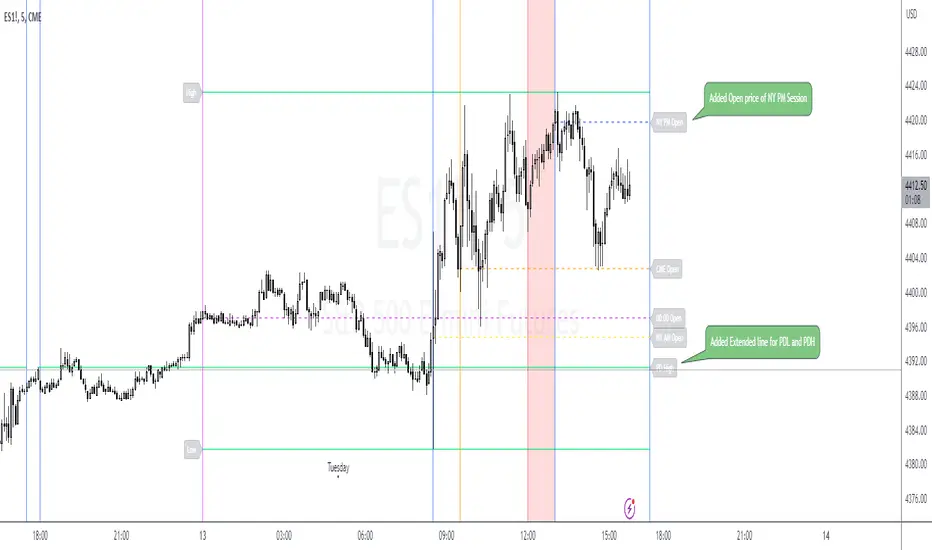
ICT Index Futures Vertical LinesLearning to trade is complicated enough, so to make the process it little less daunting, I decided to create something helpful.
This indicator relieves you of drawing the same lines and levels over and over each trading day.
It also provides key price levels for you to watch when the trading session starts.
This project is inspired by the ICT 2022 Mentorship.
This indicator was designed and tested to practice and trade the CME Index Futures like Nasdaq, S&P500 and the DOW.
The concepts by ICT are known to work on other markets like Crypto, but I haven't tested that so use at your own risk.
Features:
When a new trading day starts, the following lipstick is put on the chart:
Vertical lines:
- Globex (Overnight) Session Start @17.00
- New York Midnight @ 00:00
- New York AM Session Start @ 08.30
- CME Open @ 09.30
- New York Lunch Start @12.00
- New York PM Session Start @13.00
- New York PM Session End @ 16.30
Important levels:
- Globex (Overnight) Session Opening price
- Globex (Overnight) Session High
- Globex (Overnight) Session Low
- New York Mignight Opening Price
Additional features:
- Shows the day of the week at the bottom for your convenience
- London Killzone Vertical lines
- London Killzone Highlight
- NY Lunch No-Trade-Zone Highlight
- Important levels have a small label to show their meaning and price
- Almost everything is customizable: colors, line types, times, etc
- Customizable timezone setting in case you don't want to work on ICT's recommended timezone (New York UTC-4)
- Toggle to Show only Today's drawings on the chart. You can choose to display all chart lipstick from almost a month of trading data to do your research. Ideal if you want to determine the daily profiles for example.
Screenshots:
London Killzone Highlight turned on:
Multi Day Lipstick:
Точки разворота и уровни
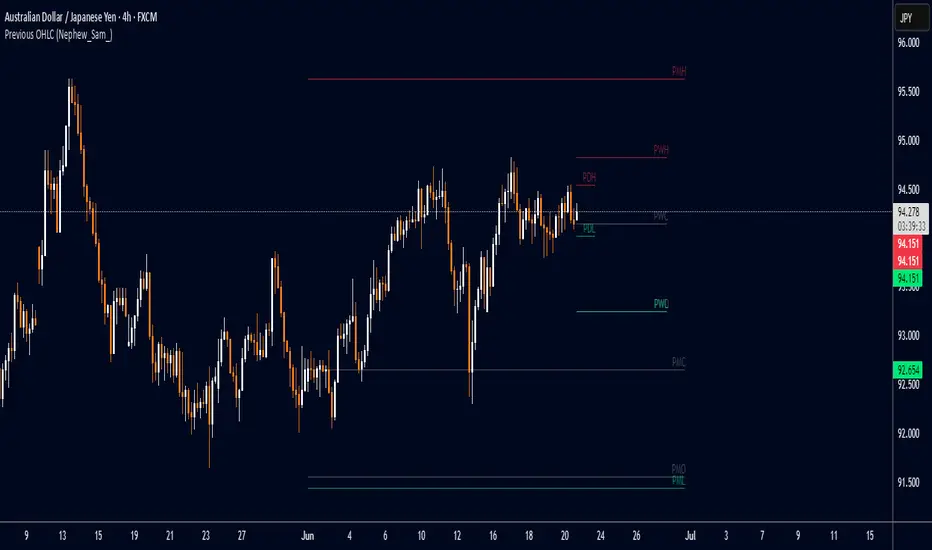
Previous OHLC (Nephew_Sam_)This indicator plots the OHLC of a previous HTF candle with an option to show the HTF candle too on the lower timeframe.
(uses latest pine script version 5)
Options:
1. Custom timeframe (requires a higher timeframe from current chart period)
2. Show or hide OC and/or LH lines of previous candle
3. Show or hide the candle at the beginning of the new period
Styles
1. You can style all lines and candle colors from this tab.
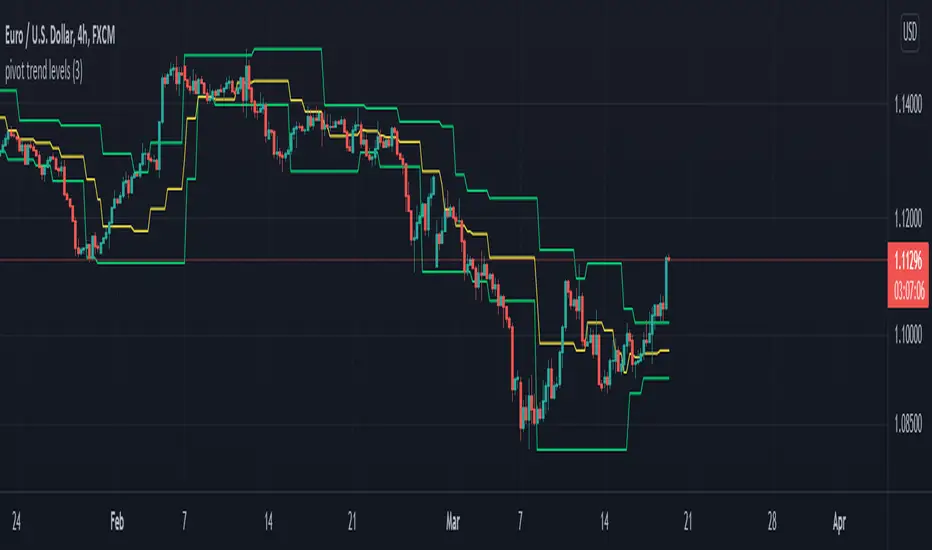
Pivot Trend LevelsYou can use this indicator to detect the levels and trend.
I used the highest of the two last highest pivots and the lowest of the two last lowest pivots to calculate "max" and "min" or high level or low level.
I also calculate the average of the 4 values to reach the average line which could be a trend detector in higher lengths.
Default length is 3 but using 10 or 20 as length is really good as trending detector.
I need help to upgrade a trend detector system. please read the script for more information.
Thank you so much.
Psychological LevelsThis script automatically plots psychological levels based upon the price and features four settings for adjusting line quantity.
This could be improved by using lines instead of plots.

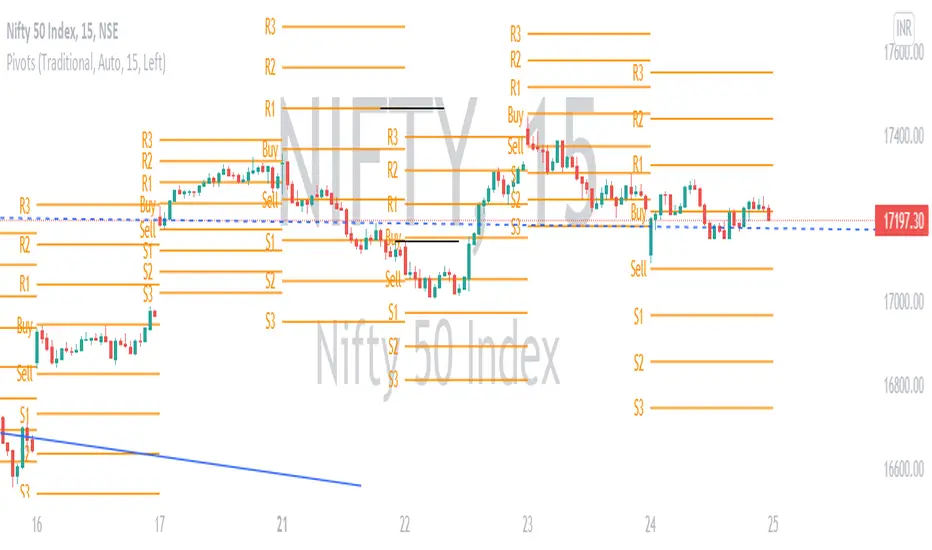
Pivot Points Std iazzuPivot point std iazzu
In financial markets, a pivot point is a price level that is used by traders as a possible indicator of market movement. A pivot point is calculated as an average of significant prices from the performance of a market in the prior trading perio
VWAP with 7EMA with ZonesThis is a script with 7 EMAs for every type of trades. This indicator also has the daily weekly and monthly zones. 20,50,100,200 EMAs being the best EMAs of all.

Mean Shift Pivot ClusteringCore Concepts
According to Jeff Greenblatt in his book "Breakthrough Strategies for Predicting Any Market", Fibonacci and Lucas sequences are observed repeated in the bar counts from local pivot highs/lows. They occur from high to high, low to high, high to low, or low to high. Essentially, this phenomenon is observed repeatedly from any pivot points on any time frame. Greenblatt combines this observation with Elliott Waves to predict the price and time reversals. However, I am no Elliottician so it was not easy for me to use this in a practical manner. I decided to only use the bar count projections and ignore the price. I projected a subset of Fibonacci and Lucas sequences along with the Fibonacci ratios from each pivot point. As expected, a projection from each pivot point resulted in a large set of plotted data and looks like a huge gong show of lines. Surprisingly, I did notice clusters and have observed those clusters to be fairly accurate.
Fibonacci Sequence: 1, 2, 3, 5, 8, 13, 21, 34...
Lucas Sequence: 2, 1, 3, 4, 7, 11, 18, 29, 47...
Fibonacci Ratios (converted to whole numbers): 23, 38, 50, 61, 78, 127, 161...
Light Bulb Moment
My eyes may suck at grouping the lines together but what about clustering algorithms? I chose to use a gimped version of Mean Shift because it doesn't require me to know in advance how many lines to expect like K-Means. Mean shift is computationally expensive and with Pinescript's 500ms timeout, I had to make due without the KDE. In other words, I skipped the weighting part but I may try to incorporate it in the future. The code is from Harrison Kinsley . He's a fantastic teacher!
Usage
Search Radius: how far apart should the bars be before they are excluded from the cluster? Try to stick with a figure between 1-5. Too large a figure will give meaningless results.
Pivot Offset: looks left and right X number of bars for a pivot. Same setting as the default TradingView pivot high/low script.
Show Lines Back: show historical predicted lines. (These can change)
Use this script in conjunction with Fibonacci price retracement/extension levels and/or other support/resistance levels. If it's no where near a support/resistance and there's a projected time pivot coming up, it's probably a fake out.
Notes
Re-painting is intended. When a new pivot is found, it will project out the Fib/Lucas sequences so the algorithm will run again with additional information.
The script is for informational and educational purposes only.
Do not use this indicator by itself to trade!

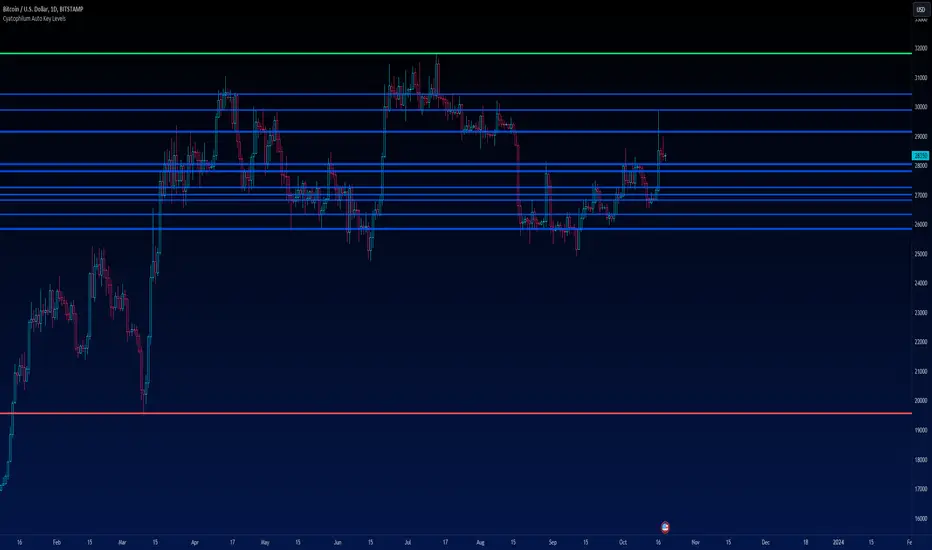
Cyatophilum Auto Key LevelsThis indicator will automatically plot key horizontal levels.
The script will create a grid from highest to lowest price, dividing this price range into several steps.
It will then loop through each bar and save its cummulative price/volume into each steps.
The steps with the most significant prices/volume are finally plotted into key levels.
═════════════════════════════════════════════════════════════════════════
Settings
• Precision: The number of steps. Increase if you want more precise levels or decrease for bigger areas.
• Lookback: The number of bars from the past used to calculate the levels.
• Strength: The amount of lines to show.
• Use Volume: For volume weighted key levels.
Nareshraju CPRHi friends this is Cpr indicator which means central pivot range. it contains supports and resistances to take perfect entry.

PFCC - Pivot Fractal Chaos Channel [Open Source]With the release of my indicator "TOTC - Trade outside the Channel" , the Pivot Fractal Chaos Channel used there has attracted significant interest.
Due to requests from some users, I am happy to publish the source code of the PFCC - although it is not "new" and has been implemented in many other scripts in one way or another. Some Examples:
Support and Resistance Levels with Breaks:
Support Resistance MTF:
Pivot Points High Low (HH/HL/LH/LL):
The code is briefly commented. Please feel free to use or further customize it ... And, of course, I would be happy to be named and/or linked. If you're satisfied, maybe buy me a coffee ;-)
I'm curious to see how this indicator will develop with more ideas - Please keep me updated by commenting below or by sending me a message.
Let's take a quick look at the function and idea
PFCC - "Pivot Fractal Chaos Channel" or also known as "Fractal Chaos Band" can serve as a baseline trend indicator for your strategy.
Essentially, the "Fractal Chaos Channel" shows an overall panorama of price action. As they filter out the insignificant price fluctuations. The upper level is created by drawing price highs and the lower level is created by drawing price lows.
Two Ideas, how this indicator can be used
Trend indicator: If the price breaks the upper line, it could be taken as a buy signal. If the price breaks the lower line, it could be taken as a sell signal.
Trailing Stop Loss: You can track the stop loss with the rising line in case of a buy trade. On the other hand, you can track the stop loss with the falling fractal line in case of a sell trade.
What do I need to consider?
It may be advisable to add further indicators and an analysis of the market structure in order to confirm the signals issued by the indicator. Please note that when you make adjustments to any strategy, you always carry out particularly detailed tests.
You would like to use this indicator, but you have adjustment requests, you want to have additional filters or features implemented, ...?
I am happy to create individual indicators based on "PFCC - Pivot Fractal Chaos Channel" or your ideas. Write me a message and we will discuss the details and conditions.

COG ContinuationsAutomatically finds Higher Lows and Lower Highs, which are useful for identifying Continuation entries.
This is not a standalone indicator and is meant to be used alongside a COG indicator, such as @veryfid's Boom Hunter (COG Mode) or similar.

S and R (618-382)This script is based on Donchian channels.
It uses tree periods, 17, 72 and 305. You can also change it to 72, 305 and 1292.
The indicator calculates the channel and the 618 and 382 levels inside the channel.
If the price is above the level 618 then a support line apears indicating it with a light color.
if the price is under the level 382 then a resistance line apears indicating it with a dark color.
the small channel is Lime / Green
the medium channel is Yellow / Orange
the big channel is Red / Maroon.
Above all light colors a trend up.
under all dark colors a trend down.

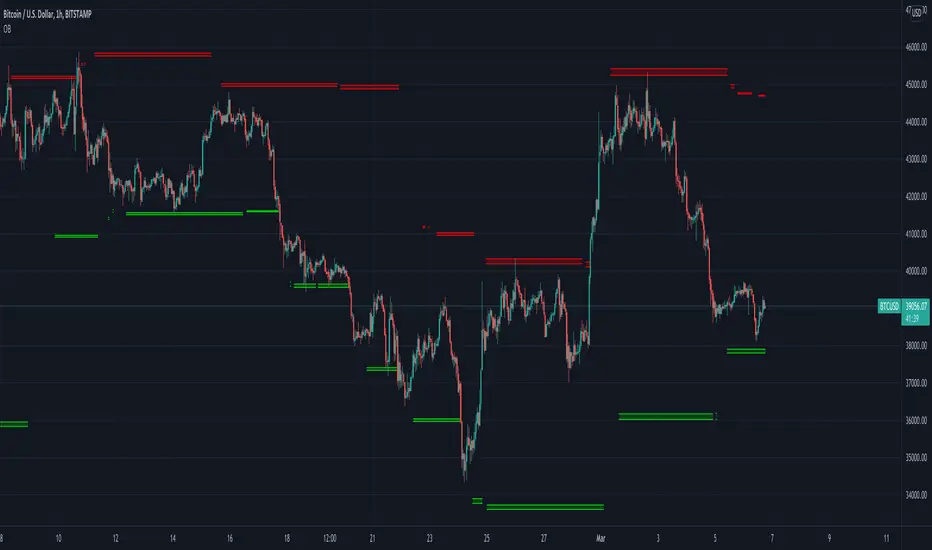
BB Order BlocksUsing the Bollinger Band to mark areas of Support and Resistance
The scrip finds the highest and lowest levels of the bands to mark up futures areas of interest.
If the High/Lows are being broken on the Bollinger band, or if the look back range has expired without finding new levels, the script will stop plotting them until new levels are found
I have found many combinations which work well
Changing the band length to to levels 20,50,100 or 200 seem to give interesting results
Aswell as this changing the standard deviation to 3 instead of 2 marks up key levels.
The look back range seems to show better levels on 50,100 and 200
Let me know any changes or updates you think you could make an impact , this was just a quick basic script I wanted to share.
Trading PanelWhen trading, position sizing and risk calculation is the key to become successful.
We need to keep the losses small and adjust the position size according to what
risk we are prepared to take for the planned Entry.
Based on the Account Size and the max percentage we want to risk for any trade,
we calculate, for a number of fixed max Loss percentages:
- The Position size, both in percent and in the selected currency.
- Number of shares to buy.
- Where to put the Stop Loss.
We also calculate the numbers based on the ATR times a multiple.
The values are presented in a table format and will hopefully aid in selecting
a suitable Stop Loss (based on the chart situation) and hence the proper Position Size.
We also allow for expressing the Account size in currencies other than USD.
Example:
Account Size in USD and trading US stocks: select USD
Account Size in SEK but trading US stocks: select USDSEK

Support and Resistance with MACD IndicatorOriginal script from ©akpaswaniitk. I just added MACD to filter out bad trades and alert function so that we get notified whenever indicator gives us an entry signal. Most of the false breakout has been removed but the remaining ones only pop up during consolidation, so it's wait for the retest before entry. Works better in continuous market. Also look at the color of EMA for further confirmation, only focus on buy side when EMA is green and sell when EMA is red or when after the buy signal EMA changes color from red to green. These are the highly profitable setups I've found with this indicator.
Signals
Red or Green solid line with diamond are trailing stoploses
dotted black line is entry level
dotted white line is optimal exit

ORB with Price TargetsThe ORB with Price Targets Script will display the Opening Range (15 minutes of the open session by default) High and Low. It will then render upper and 2 lower Price Target Levels based on 50% and 100% profit targets of the Opening Range.
The opening range is customizable in the settings, where you can choose from 5 minute, 15 minute, or 30 minute Opening Ranges.
Many stock tickers tend to follow the Opening Range, and sees continuation after a break of that range. This is a common strategy used by traders to enter trades. Price action also tends to find support and resistance at the 50% and 100% retracement levels, thus providing you Price Targets to start trimming your position, or finding new entries.
