Marcadorde Entradas Long y Short Javier JoseScript Logic
I have integrated the following elements:
Trend Indicators: I use 9-period and 21-period Exponential Moving Averages (EMAs) to quickly detect the price direction.
Momentum Confirmation: I combine the RSI and MACD to validate the strength and direction of the movement.
Volume Filter: I only accept signals if the volume exceeds its 20-period moving average, ensuring market interest.
Volatility Filter: I use the ATR (Average True Range) to avoid signals in flat or low-volatility markets.
Candlestick Patterns: I include detection of engulfing patterns (bullish for "Long," bearish for "Short") as additional confirmation.
Support and Resistance: I use pivot points to ensure signals occur near key levels.
The result is a robust system that filters out weak signals and prioritizes the most reliable ones.
Condition Details
Trend (EMA Crossover)
Long: The fast EMA (9) crosses above the slow EMA (21).
Short: The fast EMA (9) crosses below the slow EMA (21).
Momentum
RSI:
"Long" requires RSI > 40 (avoids extreme oversold zones).
"Short" requires RSI < 60 (avoids extreme overbought zones).
MACD:
"Long" when the MACD line is above the signal line.
"Short" when the MACD line is below the signal line.
Volume
The current volume must exceed the 20-period Simple Moving Average (SMA) of volume.
Volatility (ATR)
The current ATR must exceed its 14-period SMA to ensure sufficient market movement.
Candlestick Patterns
Bullish Engulfing: Confirms "Long" when the current candle closes above the previous candle’s open and engulfs its range.
Bearish Engulfing: Confirms "Short" when the current candle closes below the previous candle’s open and engulfs its range.
Support and Resistance
Support: For "Long," the price must be near (within 1%) a previous low pivot.
Resistance: For "Short," the price must be near (within 1%) a previous high pivot.
Timeframes
The script operates only on the specified timeframes: 15 minutes, 30 minutes, 1 hour, 2 hours, 4 hours, and daily.
Точки разворота и уровни


「ᴋᴇʏ ʟᴇᴠᴇʟꜱ」Key Levels for DAX with Alerts function.
This shows potential reversal points designed to be used with the DAX index. Use additional indicators as confluence.

MURA2.0The indicator shows important levels for trading on different TF, you can select levels for intraday, intraweek and intra-month trading. Also added clearly visible three trends: short term, medium term and long term, but depends on your TF. With excellent trend visibility, it will be much easier to trade according to the structure instead of against it.

EMA vs SMA Crossover (Toggle 15/20) by AaronEscaThis custom indicator by AaronEsca lets you toggle between a 15-period or 20-period EMA/SMA crossover to spot trend shifts and momentum changes earlier.
Features:
Choose between 15 or 20 period moving averages using a simple dropdown.
Highlights when the EMA crosses above or below the SMA — a signal of trend momentum or exhaustion.
Includes visual fill between the two lines for instant trend direction insight.
Alerts included for bullish and bearish crossovers.
Designed for use on the 4H, 1H, and Daily timeframes, but flexible for any strategy.
This tool is perfect for swing traders, scalpers, or anyone wanting early confirmation of a potential reversal or momentum break.

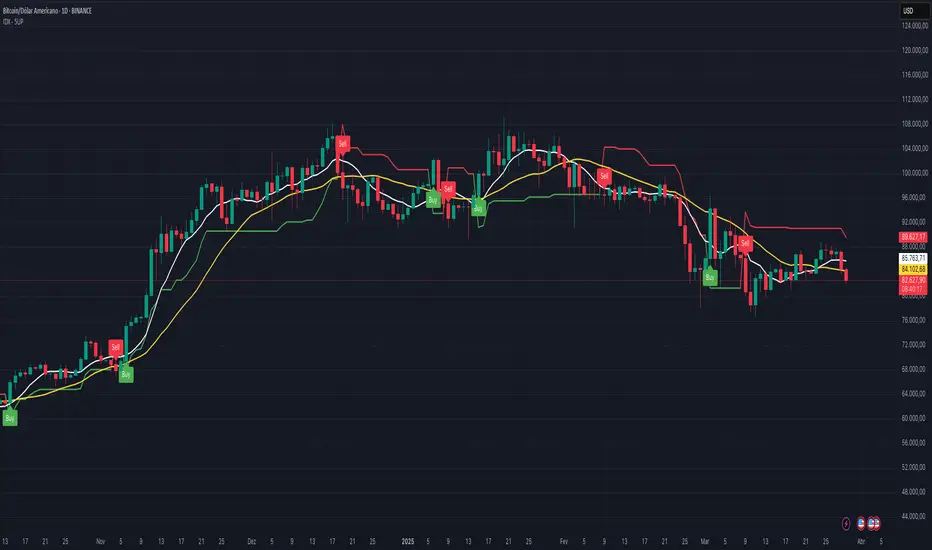
IDX - 5UPThe UDX-5UP is a custom indicator designed to assist traders in identifying trends, entry and exit signals, and market reversal moments with greater accuracy. It combines price analysis, volume, and momentum (RSI) to provide clear buy ("Buy") and sell ("Sell") signals across any asset and timeframe, whether you're a scalper on the 5M chart or a swing trader on the 4H chart. Inspired by robust technical analysis strategies, the UDX-5UP is ideal for traders seeking a reliable tool to operate in volatile markets such as cryptocurrencies, forex, stocks, and futures.
Components of the UDX-5UP
The UDX-5UP consists of three main panels that work together to provide a comprehensive view of the market:
Main Panel (Price):
Pivot Supertrend: A dynamic line that changes color to indicate the trend. Green for an uptrend (look for buys), red for a downtrend (look for sells).
SMAs (Simple Moving Averages): Two SMAs (8 and 21 periods) to confirm the trend direction. When the SMA 8 crosses above the SMA 21, it’s a bullish signal; when it crosses below, it’s a bearish signal.
Entry/Exit Signals: "Buy" (green) and "Sell" (red) labels are plotted on the chart when entry or exit conditions are met.
Volume Panel:
Colored Volume Bars: Green bars indicate dominant buying volume, while red bars indicate dominant selling volume.
Volume Moving Average (MA 20): A blue line that helps identify whether the current volume is above or below the average, confirming the strength of the movement.
RSI Panel:
RSI (Relative Strength Index): Calculated with a period of 14, with overbought (70) and oversold (30) lines to identify momentum extremes.
Divergences: The indicator detects divergences between the RSI and price, plotting signals for potential reversals.
How the UDX-5UP Works
The UDX-5UP uses a combination of rules to generate buy and sell signals:
Buy Signal ("Buy"):
The Pivot Supertrend changes from red to green.
The SMA 8 crosses above the SMA 21.
The volume is above the MA 20, with green bars (indicating buying pressure).
The RSI is rising and, ideally, below 70 (not overbought).
Example: On the 4H chart, the price of Tether (USDT) is at 0.05515. The Pivot Supertrend turns green, the SMA 8 crosses above the SMA 21, the volume shows green bars above the MA 20, and the RSI is at 46. The UDX-5UP plots a "Buy".
Sell Signal ("Sell"):
The Pivot Supertrend changes from green to red.
The SMA 8 crosses below the SMA 21.
The volume is above the MA 20, with red bars (indicating selling pressure).
The RSI is falling and, ideally, above 70 (overbought).
Example: On the 4H chart, the price of Tether rises to 0.05817. The Pivot Supertrend turns red, the SMA 8 crosses below the SMA 21, the volume shows red bars, and the RSI is above 70. The UDX-5UP plots a "Sell".
RSI Divergences:
The indicator identifies bullish divergences (price makes a lower low, but RSI makes a higher low) and bearish divergences (price makes a higher high, but RSI makes a lower high), plotting alerts for potential reversals.
Adjustable Settings
The UDX-5UP is highly customizable to suit your trading style:
Pivot Supertrend Period: Default is 2. Increase to 3 or 4 for more conservative signals (fewer false positives, but more lag).
SMA Periods: Default is 8 and 21. Adjust to 5 and 13 for smaller timeframes (e.g., 5M) or 13 and 34 for larger timeframes (e.g., 1D).
RSI Period: Default is 14. Reduce to 10 for greater sensitivity or increase to 20 for smoother signals.
Overbought/Oversold Levels: Default is 70/30. Adjust to 80/20 in volatile markets.
Display Panels: You can enable/disable the volume and RSI panels to simplify the chart.
How to Use the UDX-5UP
Identify the Trend:
Use the Pivot Supertrend and SMAs to determine the market direction. Uptrend: look for buys. Downtrend: look for sells.
Confirm with Volume and RSI:
For buys: Volume above the MA 20 with green bars, RSI rising and below 70.
For sells: Volume above the MA 20 with red bars, RSI falling and above 70.
Enter the Trade:
Enter a buy when the UDX-5UP plots a "Buy" and all conditions are aligned.
Enter a sell when the UDX-5UP plots a "Sell" and all conditions are aligned.
Plan the Exit:
Use Fibonacci levels or support/resistance on the price chart to set targets.
Exit the trade when the UDX-5UP plots an opposite signal ("Sell" after a buy, "Buy" after a sell).
Tips for Beginners
Start with Larger Timeframes: Use the 4H or 1D chart for more reliable signals and less noise.
Combine with Other Indicators: Use the UDX-5UP with tools like Fibonacci or the Candles RSI (another powerful indicator) to confirm signals.
Practice in Demo Mode: Test the indicator in a demo account before using real money.
Manage Risk: Always use a stop-loss and don’t risk more than 1-2% of your capital per trade.
Why Use the UDX-5UP?
Simplicity: Clear "Buy" and "Sell" signals make trading accessible even for beginners.
Versatility: Works on any asset (crypto, forex, stocks) and timeframe.
Multiple Confirmations: Combines price, volume, and momentum to reduce false signals.
Customizable: Adjust the settings to match your trading style.
Author’s Notes
The UDX-5UP was developed based on years of trading and technical analysis experience. It is an evolution of tested strategies, designed to help traders navigate volatile markets with confidence. However, no indicator is infallible. Always combine the UDX-5UP with proper risk management and fundamental analysis, especially in unpredictable markets. Feedback is welcome – leave a comment or reach out with suggestions for improvements!
GIGANEVA V6.6 PublicFib levels and Fib Fans from Top and Bottom of the "Range".
Plots are calculated on Log and Linear Scale.
It calculates Time pivots by fans crossing each other
It calculates Time pivots by fans crossing top and bottom of the "Range"
Golden pivots are 0.5 fan crossing log 0.5 or via versa
Selecting Bool Fib Right, expends them Right, no matter how you picked top or bottom (doesn't matter which you picked first.
Why is this code unique?
It incorporates all the fib functions together and it's coded to the max Plot capabilities Trading View allows.

Ask2Maniish- Smart Money Volume Analyzer
Ask2Maniish - Smart Money Volume Analyzer
Overview
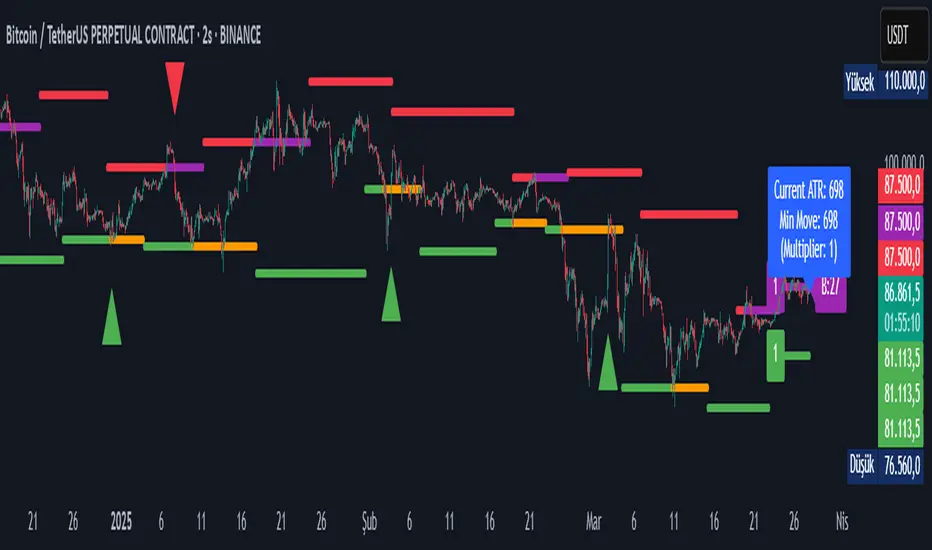
This Pine Script indicator provides a powerful combination of volume analysis, liquidity zone detection, fair value gaps (FVG), support & resistance (S/R), and imbalance identification. It helps traders identify key market areas where price action and volume dynamics indicate potential trading opportunities.
Key Features
1. Volume Analysis
Volume Spikes (🔥 Orange): Highlights sudden increases in volume.
Extreme Low Volume (🟣 Purple): Detects lowest market activity.
Higher Volume (Above Avg.) (🟢 Lime Green): Strong volume increase.
Higher Volume (Below Avg.) (🟩 Green): Moderate volume increase.
Lower Volume (Above Avg.) (🟥 Maroon): High but declining volume.
Lower Volume (Below Avg.) (🔴 Red): Weak market participation.
Neutral Volume (⚪ Gray): No significant volume change.
ATR-Based Dynamic Multiplier: Adapts high-volume thresholds based on ATR.
Customizable Volume Moving Average (Vol MA): For trend analysis.
2. Liquidity Zones
Identifies liquidity high and low zones based on the highest and lowest price levels over a user-defined period.
Background shading to indicate liquidity zones (Green for high, Red for low).
Alerts for price entering liquidity zones.
3. Support & Resistance (S/R) Detection
Pivot-Based S/R: Identifies significant swing points based on pivots.
Fractal-Based S/R: Uses Bill Williams’ fractal method for support & resistance detection.
4. Fair Value Gaps (FVG) & Imbalance Detection
Bullish FVGs: Highlighting areas of price inefficiency for potential upward moves.
Bearish FVGs: Highlighting areas of price inefficiency for potential downward moves.
Customizable visualization of FVGs.
5. VWAP (Volume Weighted Average Price)
Displays VWAP for intraday trading insights.
6. Moving Averages
Supports multiple moving average types (SMA, EMA, HMA, SMMA, WMA, VWMA).
Customizable Short MA & Long MA settings for trend identification.
7. Alerts
Volume Spike Alerts: Detects high-volume spikes.
Liquidity Zone Alerts: Notifies when price enters a liquidity zone.
Custom alerts for other key conditions.
8. Visualization & Customization
Customizable colors and opacity settings.
User-controlled toggles for various features (Volume MA, VWAP, Liquidity Zones, S/R, etc.).
Table Display for Volume Conditions: Displays key volume metrics in an on-chart table.
How to Use the Indicator
1. Enable/Disable Features
Use input settings to toggle volume spikes, liquidity zones, FVGs, VWAP, etc.
2. Identify Key Market Areas
Look for volume spikes (🔥) to detect strong market participation.
Observe liquidity zones to anticipate areas of interest.
Use S/R and FVGs for trade decision-making.
3. Set Alerts
Utilize built-in alerts to get notified of significant volume and liquidity events.
4. Analyze Trend with Moving Averages
Choose between SMA, EMA, HMA, SMMA, WMA, or VWMA to suit your strategy.
Customization Options
Adjustable period settings for Liquidity Zones and FVG Sensitivity.
Customizable volume thresholds and color coding.
Toggle visibility for individual features to avoid chart clutter.
Final Thoughts
This indicator combines volume, liquidity, S/R, and imbalance analysis into a single tool for more precise trade decisions. Customize it based on your trading style and market conditions for better accuracy.
🚀 Enhance your trading with Ask2Maniish - Volume Spikes Analyzer, S/R, FVG, Imbalance & Liquidity Zone! 🚀

Smart Money Concepts (SMC) Indicator for Altcoin Scalpingquent movement. It implements filtering mechanisms to display only relevant order blocks and differentiates between premium and discount zones.
2. Multi-timeframe Analysis
Order blocks are detected across three timeframes (1-minute, 5-minute, and 15-minute), with visual differentiation between zones from different timeframes. The indicator includes a confluence detector that identifies when zones from multiple timeframes overlap, highlighting these high-probability areas.
3. Liquidity Analysis
The indicator detects areas of high liquidation activity, identifies stop hunts and liquidity sweeps, and monitors the formation of fresh order blocks that indicate smart money activity.
4. Entry, Stop-Loss, and Take-Profit Signals
Clear entry signals are generated when price approaches validated order blocks, with adaptive stop-loss placement based on market volatility and zone strength. Take-profit targets are calculated using risk-to-reward multipliers, and the risk-to-reward ratio is displayed for each potential trade.
5. Volume Profile Integration
Volume analysis is integrated to confirm order block validity, with anomalous volume spikes highlighted and a volume-weighted effectiveness score assigned to each zone.
6. Technical Indicator Integration
The indicator incorporates customizable momentum oscillators (RSI and MACD) to confirm zone strength, with divergence detection to enhance entry accuracy.
7. Performance Metrics
Historical performance tracking is included, calculating win rate, average risk-to-reward ratio, and expectancy for generated signals, with a performance index score for each trading opportunity.
8. Alert System
Comprehensive alerts are implemented for approaches to order blocks, entries, take-profits, and stop-losses, with priority alerts based on zone strength and multi-timeframe confluence.
9. Visual Design
The indicator uses distinct color schemes for bearish and bullish order blocks, with transparency options to maintain chart clarity. Features can be toggled on/off for customization, and clear visual indicators are provided for entry, stop-loss, and take-profit levels.
10. Automatic Detection and Optimization
The indicator provides fully automated identification of all zones and signals, with adaptive parameters that adjust to different market conditions and optimization capabilities based on recent market behavior.
Implementation Details
The code is thoroughly documented with clear sections for:
User configuration parameters (fully customizable)
Data structure definitions for order blocks, entry signals, and liquidity zones
Core detection algorithms for order blocks and liquidity zones
Multi-timeframe analysis with higher timeframe data integration
Entry signal generation with adaptive risk management
Performance tracking and metrics calculation
Visual elements for clear chart representation
Using the Indicator
To use this indicator:
Compile and add to your chart
Adjust the settings via the indicator parameters panel to optimize for your trading style
Focus on trading from the order blocks with highest strength and multi-timeframe confluence
The indicator is specifically optimized for 1-minute timeframe altcoin cryptocurrency scalping but incorporates data from higher timeframes to identify high-probability trading opportunities.

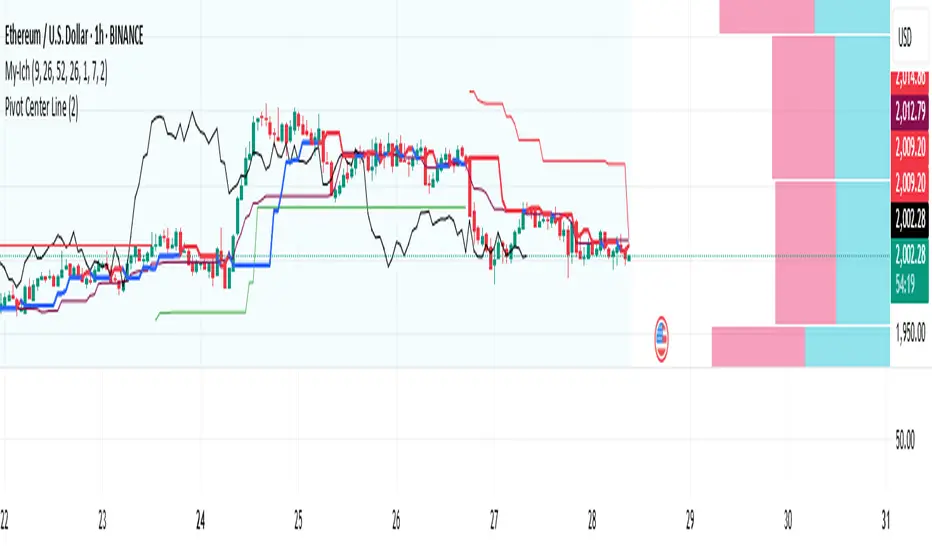
Pivot Center LineHow is it calculated?
Finding Pivot Points:
The script looks for Pivot Highs (local peaks) and Pivot Lows (local bottoms) based on a user-defined period (prd).
A Pivot High is the highest point among the surrounding candles.
A Pivot Low is the lowest point among the surrounding candles.
Storing the Latest Pivot:
If a new pivot (high or low) is found, it is stored as lastpp (latest pivot point).
Weighted Averaging:
If it's the first detected pivot, the center line is set to that pivot price.
After detecting multiple pivots, the new pivot is averaged with the previous center value using the formula:
new center=(old center×2)+latest pivot3
new center=3(old center×2)+latest pivot
This gives more weight to past values, smoothing the center line.
Plotting the Line:
If the center line is below the mid-price (hl2), it is colored blue (bullish bias).
If it is above, it is colored red (bearish bias).
Summary in Simple Terms
The Pivot Center Line is a moving reference line that smoothly follows the trend based on recent price highs and lows. It updates itself over time, filtering out small fluctuations to help traders see the bigger trend picture.
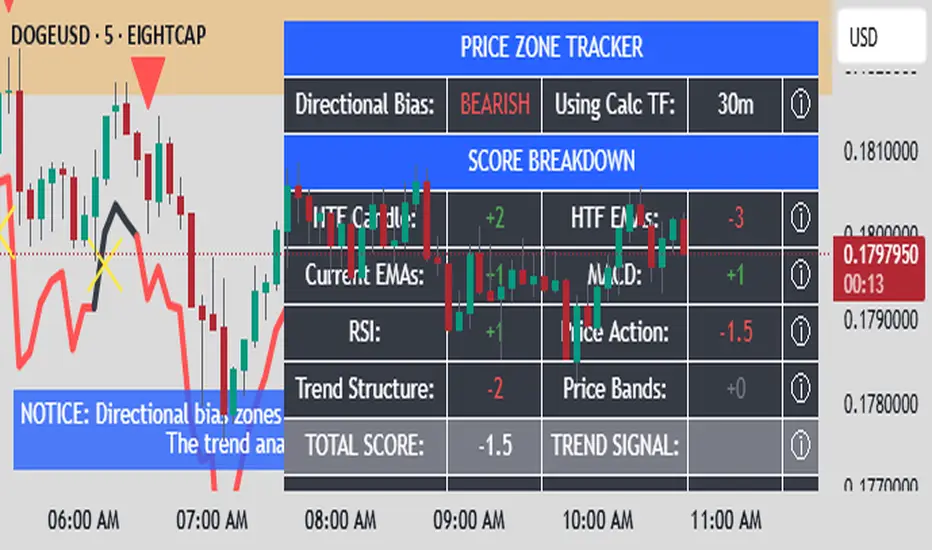
zone trading stratThis only works for DOGEUSD , I made it for the 8cap chart so only use it for that.
If you want this for other symbols/charts you need to comment below or msg me.
# Price Zone Trading System: Technical Explanation
## Core Concept
The Price Zone Tracker is built on the concept that price tends to respect certain key levels or "zones" on the chart. These zones act as support and resistance areas where price may bounce or break through. The system combines zone analysis with multiple technical indicators to generate high-probability trading signals.
## Zone Analysis
The system tracks 9 predefined price zones. Each zone has both a high and low boundary, except for Zone 5 which is represented by a single line. When price enters a zone, the system monitors whether it stays within the zone, breaks above it (bullish), or breaks below it (bearish).
This zone behavior establishes the foundational bias of the system:
- When price closes above its previous zone: Zone State = Bullish
- When price closes below its previous zone: Zone State = Bearish
- When price remains within a zone: Zone State = Neutral
## Trend Analysis Components
The system performs multi-timeframe analysis using several technical components:
1. **Higher Timeframe Analysis** (±3 points in scoring)
- Uses 15-minute charts for sub-5-minute timeframes
- Uses 30-minute charts for 5-minute timeframes
- Uses 60-minute charts for timeframes above 5 minutes
- Evaluates candlestick patterns and EMA crossovers on the higher timeframe
2. **EMA Direction** (±1 point in scoring)
- Compares 12-period and 26-period EMAs
- Bullish when fast EMA > slow EMA
- Bearish when fast EMA < slow EMA
3. **MACD Analysis** (±1 point in scoring)
- Uses standard 12/26/9 MACD settings
- Bullish when MACD line crosses above signal line with positive histogram
- Bearish when MACD line crosses below signal line with negative histogram
4. **Price Action** (±2 points in scoring)
- Evaluates whether price is making higher highs/higher lows (uptrend)
- Or lower highs/lower lows (downtrend)
- Also considers ATR-based volatility and strength of movements
## Trend Score Calculation
All these components are weighted and combined into a trend score:
- Higher timeframe components have stronger weights (±2-3 points)
- Current timeframe components have moderate weights (±1 point)
- Price action components have varied weights (±0.5-2 points)
The final trend state is determined by thresholds:
- Score > +3: Trend Analysis State = Bullish
- Score < -3: Trend Analysis State = Bearish
- Score between -3 and +3: Trend Analysis State = Neutral
## Signal Generation Logic
The system combines the Zone State with the Trend Analysis State:
1. If Zone State and Trend Analysis State are both bullish:
- Combined State = Bullish
- Line Color = Green
2. If Zone State and Trend Analysis State are both bearish:
- Combined State = Bearish
- Line Color = Red
3. If Zone State and Trend Analysis State contradict each other:
- Combined State = Neutral
- Line Color = Black
This implements a safety mechanism requiring both zone analysis and technical indicators to agree before generating a directional signal.
## Trading Signals
Trading signals are generated based on changes in the Combined State:
- When Combined State changes from neutral/bearish to bullish:
- Trading Signal = LONG (green triangle appears on chart)
- When Combined State changes from neutral/bullish to bearish:
- Trading Signal = SHORT (red triangle appears on chart)
- When Combined State changes from bullish/bearish to neutral:
- Trading Signal = EXIT (yellow X appears on chart)
- When Combined State remains unchanged:
- Trading Signal = NONE (no new marker appears)
## Reversal Warning
The system also monitors for potential reversal conditions:
- When Combined State is bullish but both RSI and MFI are overbought (>70)
- When Combined State is bearish but both RSI and MFI are oversold (<30)
In these cases, a yellow diamond appears on the chart as a warning that a reversal might be imminent.
## Visual Elements
The indicator provides multiple visual elements:
1. Zone boundaries as translucent orange areas
2. A single colored line below price (green/red/black) showing the current signal
3. Trading signals as shapes on the chart
4. An information panel showing all relevant indicator values and signals
## Usage Limitations
The indicator is designed to work optimally on timeframes below 30 minutes. On higher timeframes, a warning appears and analysis is disabled.
Custom Gold Pivot LevelsThis indicator plots custom resistance and support levels based on a central Ziro Pivot Level. The levels are adjusted dynamically based on whether you're preparing for a Buy or Sell trade. The script allows you to set percentage-based levels for both resistance and support, making it a versatile tool for traders.
Features:
Pivot Level: Set the central pivot level (Ziro Pivot) around which resistance and support levels are calculated.
Dynamic Resistance & Support Levels: Input your preferred percentages for Resistance 1, Resistance 2, Support 1 , and Support 2 .
For Buy: Resistance levels are higher, and support levels are lower.
For Sell: Resistance levels are adjusted lower, and support levels are adjusted higher.
Label Display: The indicator will display a Buy label in green above the pivot level or a Sell label in red below the pivot level, depending on the trade type you select.
Adjustable Parameters:
Ziro Pivot Level: Set the central pivot level.
Resistance & Support Levels: Adjust resistance and support levels using percentages.
Trade Type: Choose between "Buy" and "Sell" to dynamically adjust resistance and support levels.
Inputs:
1- Trade Type: Select between Buy or Sell to set the relevant resistance and support levels.
Ziro Pivot Level: Set the main pivot level around which all other levels are calculated.
Resistance Level 1 & 2: Input percentages for Resistance 1 and Resistance 2.
Support Level 1 & 2: Input percentages for Support 1 and Support 2.
How to Use:
1- Select "Buy" or "Sell" from the input options.
For Buy: The indicator will plot higher resistance levels and lower support levels.
For Sell: The indicator will plot lower resistance levels and higher support levels.
2- Adjust the Pivot Level: Set the central pivot level for the levels to be calculated around.
3- Adjust the Resistance & Support Percentages: Modify the resistance and support levels to fit your trading strategy.
4- Visual Feedback: The indicator will show a Buy label in green above the pivot level or a Sell label in red below the pivot level, making it easy to identify the trade direction at a glance.
Use Cases:
Gold & Commodity Trading: This tool is particularly useful for traders working with commodities like gold, where pivot levels can help determine potential price action points.
Swing & Day Trading: The dynamic nature of this indicator makes it great for both swing and day traders who want to monitor short-term market movements.
Support and Resistance Strategy: Traders who rely on support and resistance levels to make buy/sell decisions can use this indicator to automate and visualize these levels more effectively.

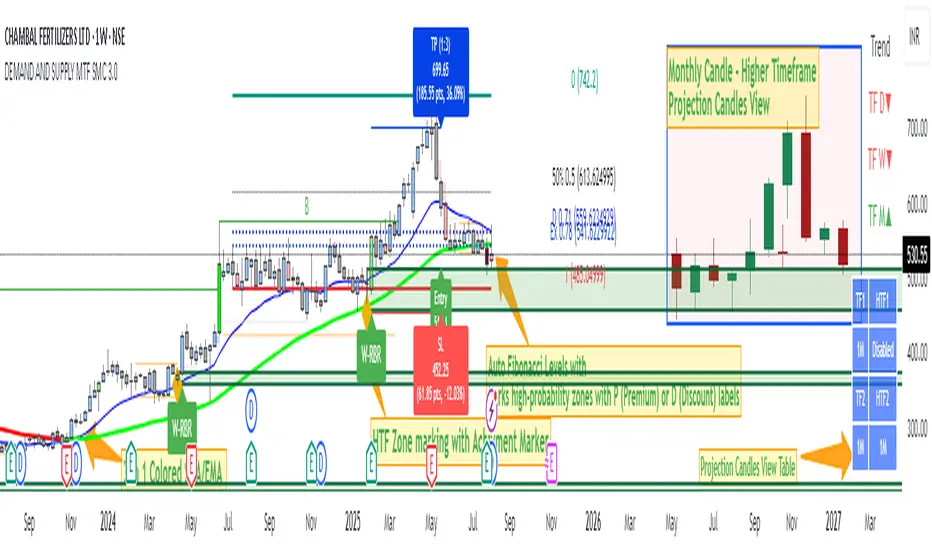
Demand and Supply MTF with SMC By StockFusion - 3.0Demand and Supply MTF with SMC By StockFusion - 3.0 - Indicator Description
Concepts
What is Supply & Demand?
Supply and Demand are foundational forces driving market dynamics. Demand reflects the presence of buyers willing to purchase a security, while Supply indicates sellers offering it for sale. These forces create zones on the chart where price tends to react—either reversing or continuing—based on the balance between buying and selling pressure. This indicator identifies these zones using price action patterns, focusing on impulsive moves (strong directional momentum) and retracement phases (consolidation or pullbacks).
What is SMC (Smart Money Concepts)?
Smart Money Concepts (SMC) revolve around tracking the behavior of institutional traders, often called "smart money." By analyzing price action, market structure shifts, and liquidity, SMC helps retail traders align with the moves of larger players. Key SMC signals like Change of Character (CHoCH), Break of Structure (BOS), liquidity sweeps, and swing points provide insights into potential trend changes or continuations.
Overview
Demand and Supply MTF with SMC By StockFusion - 3.0 is a sophisticated, price action-based indicator designed to plot real-time Supply and Demand zones across multiple timeframes (MTF) directly on your chart. It goes beyond simple zone plotting by integrating Smart Money Concepts (SMC) and Inside Candle detection, offering traders a powerful tool for spotting high-probability reversal or continuation areas. The indicator highlights zones with customizable boxes, labels them for clarity, and provides additional SMC-driven insights such as CHoCH, BOS, liquidity sweeps, and swing high/low levels. This combination of multi-timeframe analysis, SMC, and consolidation detection creates a unique and highly practical tool for traders seeking an edge in the markets.
How It Works
The indicator operates by analyzing price action across two user-defined timeframes (Higher TF and Lower TF) to detect Supply and Demand zones. It identifies these zones based on specific price patterns:
Rally Base Rally (RBR): A bullish impulsive move, followed by consolidation, then another bullish move—indicating a Demand zone.
Drop Base Drop (DBD): A bearish impulsive move, consolidation, then another bearish move—indicating a Supply zone.
Drop Base Rally (DBR): A bearish move, consolidation, then a bullish reversal—indicating a Demand zone.
Rally Base Drop (RBD): A bullish move, consolidation, then a bearish reversal—indicating a Supply zone.
These patterns are detected using criteria like explosive candle movements (based on range-to-body ratios and ATR multipliers), volume thresholds, and base candle counts (configurable from 1 to 5 candles). Zones are plotted as horizontal bands, with Higher TF zones taking precedence to avoid overlap with Lower TF zones, ensuring clarity on the chart.
Smart Money Integration:
The indicator enhances zone analysis with SMC features:
CHoCH (Change of Character): Detects shifts in market sentiment by comparing price action against recent swing highs/lows over a customizable period.
BOS (Break of Structure): Identifies when price breaks key structural levels, signaling a potential trend shift.
Liquidity Sweeps: Marks areas where price briefly exceeds swing points before reversing, often targeting stop-loss orders.
Swings: Highlights significant swing highs and lows to track momentum and structure.
Inside Candle Detection:
Inside Candles—smaller candles contained within the range of a prior candle—are plotted to indicate consolidation or indecision, often preceding breakouts. Optional lines can be drawn around these candles for better visibility.
Key Features & How to Use
Real-Time Zone Plotting:
Automatically identifies and marks Supply and Demand zones as they form, using the RBR, RBD, DBR, and DBD patterns. Zones are color-coded (e.g., green for Demand, red for Supply) and can extend rightward for visibility.
Multi-Timeframe Analysis:
Operates on all timeframes, with separate settings for Higher TF (e.g., weekly) and Lower TF (e.g., daily) zones. This allows traders to see both macro and micro levels of market structure.
Automatic Detection:
No manual input is required—zones are plotted based on price action, volume, and SMA trends. Live candle volume is displayed for context.
Tested Zone Management:
Optionally removes zones after they’re tested (price revisits and reverses) or after a second leg-out move, keeping the chart uncluttered.
Customizable Display:
Choose which patterns to detect (RBR, RBD, etc.).
Adjust base candle counts (1-5), explosive candle parameters (Range-Body Ratio, Multiplier), and quality filters (SMA length, Volume Multiplier).
Customize colors for zones, borders, labels, and candles (boring, bullish explosive, bearish explosive).
Enable/disable labels and pattern names on boxes.
Alerts:
Set notifications for zone formation, CHoCH, BOS, and liquidity sweeps on your chosen timeframe.
Inside Candle Visualization:
Highlights consolidation phases with color-coded candles and optional lines, aiding breakout anticipation.
SMC Insights:
Visualizes CHoCH, BOS, liquidity sweeps, and swings with distinct lines and labels, helping traders follow institutional moves.
How to Use It:
Approaching Zones: When price nears a Supply or Demand zone, watch for reversal patterns (e.g., pin bars, engulfing candles) or SMC signals (e.g., BOS, liquidity sweeps) to confirm entries. Combine with your tested strategy—don’t trade zones blindly.
SMC Signals: Use CHoCH for early trend reversal clues, BOS for trend continuation, and liquidity sweeps to gauge manipulation.
Inside Candles: Monitor for breakouts after consolidation periods marked by Inside Candles.
Why It’s Unique & Valuable
This indicator stands out by blending multi-timeframe Supply and Demand analysis with Smart Money Concepts and Inside Candle detection into a single, cohesive tool. While it uses classic elements like price action and volume, its proprietary logic—combining specific pattern detection (RBR, RBD, DBR, DBD), SMC signals (CHoCH, BOS, etc.), and consolidation tracking—offers a fresh approach. Unlike generic trend-following or scalping tools, it provides actionable insights into market structure and institutional behavior, making it worth considering for traders willing to invest in a premium tool. The flexibility of customization and MTF functionality further enhances its utility across trading styles, from scalping to swing trading.
Pivot S/R with Volatility Filter## *📌 Indicator Purpose*
This indicator identifies *key support/resistance levels* using pivot points while also:
✅ Detecting *high-volume liquidity traps* (stop hunts)
✅ Filtering insignificant pivots via *ATR (Average True Range) volatility*
✅ Tracking *test counts and breakouts* to measure level strength
---
## *⚙ SETTINGS – Detailed Breakdown*
### *1️⃣ ◆ General Settings*
#### *🔹 Pivot Length*
- *Purpose:* Determines how many bars to analyze when identifying pivots.
- *Usage:*
- *Low values (5-20):* More pivots, better for scalping.
- *High values (50-200):* Fewer but stronger levels for swing trading.
- *Example:*
- Pivot Length = 50 → Only the most significant highs/lows over 50 bars are marked.
#### *🔹 Test Threshold (Max Test Count)*
- *Purpose:* Sets how many times a level can be tested before being invalidated.
- *Example:*
- Test Threshold = 3 → After 3 tests, the level is ignored (likely to break).
#### *🔹 Zone Range*
- *Purpose:* Creates a price buffer around pivots (±0.001 by default).
- *Why?* Markets often respect "zones" rather than exact prices.
---
### *2️⃣ ◆ Volatility Filter (ATR)*
#### *🔹 ATR Period*
- *Purpose:* Smoothing period for Average True Range calculation.
- *Default:* 14 (standard for volatility measurement).
#### *🔹 ATR Multiplier (Min Move)*
- *Purpose:* Requires pivots to show *meaningful price movement*.
- *Formula:* Min Move = ATR × Multiplier
- *Example:*
- ATR = 10 pips, Multiplier = 1.5 → Only pivots with *15+ pip swings* are valid.
#### *🔹 Show ATR Filter Info*
- Displays current ATR and minimum move requirements on the chart.
---
### *3️⃣ ◆ Volume Analysis*
#### *🔹 Volume Change Threshold (%)*
- *Purpose:* Filters for *unusual volume spikes* (institutional activity).
- *Example:*
- Threshold = 1.2 → Requires *120% of average volume* to confirm signals.
#### *🔹 Volume MA Period*
- *Purpose:* Lookback period for "normal" volume calculation.
---
### *4️⃣ ◆ Wick Analysis*
#### *🔹 Wick Length Threshold (Ratio)*
- *Purpose:* Ensures rejection candles have *long wicks* (strong reversals).
- *Formula:* Wick Ratio = (Upper Wick + Lower Wick) / Candle Range
- *Example:*
- Threshold = 0.6 → 60% of the candle must be wicks.
#### *🔹 Min Wick Size (ATR %)*
- *Purpose:* Filters out small wicks in volatile markets.
- *Example:*
- ATR = 20 pips, MinWickSize = 1% → Wicks under *0.2 pips* are ignored.
---
### *5️⃣ ◆ Display Settings*
- *Show Zones:* Toggles support/resistance shaded areas.
- *Show Traps:* Highlights liquidity traps (▲/▼ symbols).
- *Show Tests:* Displays how many times levels were tested.
- *Zone Transparency:* Adjusts opacity of zones.
---
## *🎯 Practical Use Cases*
### *1️⃣ Liquidity Trap Detection*
- *Scenario:* Price spikes *above resistance* then reverses sharply.
- *Requirements:*
- Long wick (Wick Ratio > 0.6)
- High volume (Volume > Threshold)
- *Outcome:* *Short Trap* signal (▼) appears.
### *2️⃣ Strong Support Level*
- *Scenario:* Price bounces *3 times* from the same level.
- *Indicator Action:*
- Labels the level with test count (3/5 = 3 tests out of max 5).
- Turns *red* if broken (Break Count > 0).
Deep Dive: How This Indicator Works*
This indicator combines *four professional trading concepts* into one powerful tool:
1. *Classic Pivot Point Theory*
- Identifies swing highs/lows where price previously reversed
- Unlike basic pivot indicators, ours uses *confirmed pivots only* (filtered by ATR)
2. *Volume-Weighted Validation*
- Requires unusual trading volume to confirm levels
- Filters out "phantom" levels with low participation
3. *ATR Volatility Filtering*
- Eliminates insignificant price swings in choppy markets
- Ensures only meaningful levels are plotted
4. *Liquidity Trap Detection*
- Spots institutional stop hunts where markets fake out traders
- Uses wick analysis + volume spikes for high-probability signals
---
## *📊 Parameter Encyclopedia (Expanded)*
### *1️⃣ Pivot Engine Settings*
#### *Pivot Length (50)*
- *What It Does:*
Determines how many bars to analyze when searching for swing highs/lows.
- *Professional Adjustment Guide:*
| Trading Style | Recommended Value | Why? |
|--------------|------------------|------|
| Scalping | 10-20 | Captures short-term levels |
| Day Trading | 30-50 | Balanced approach |
| Swing Trading| 50-200 | Focuses on major levels |
- *Real Market Example:*
On NASDAQ 5-minute chart:
- Length=20: Identifies levels holding for ~2 hours
- Length=50: Finds levels respected for entire trading day
#### *Test Threshold (5)*
- *Advanced Insight:*
Institutions often test levels 3-5 times before breaking them. This setting mimics the "probe and push" strategy used by smart money.
- *Psychology Behind It:*
Retail traders typically give up after 2-3 tests, while institutions keep testing until stops are run.
---
### *2️⃣ Volatility Filter System*
#### *ATR Multiplier (1.0)*
- *Professional Formula:*
Minimum Valid Swing = ATR(14) × Multiplier
- *Market-Specific Recommendations:*
| Market Type | Optimal Multiplier |
|------------------|--------------------|
| Forex Majors | 0.8-1.2 |
| Crypto (BTC/ETH) | 1.5-2.5 |
| SP500 Stocks | 1.0-1.5 |
- *Why It Matters:*
In EUR/USD (ATR=10 pips):
- Multiplier=1.0 → Requires 10 pip swings
- Multiplier=1.5 → Requires 15 pip swings (fewer but higher quality levels)
---
### *3️⃣ Volume Confirmation System*
#### *Volume Threshold (1.2)*
- *Institutional Benchmark:*
- 1.2x = Moderate institutional interest
- 1.5x+ = Strong smart money activity
- *Volume Spike Case Study:*
*Before Apple Earnings:*
- Normal volume: 2M shares
- Spike threshold (1.2): 2.4M shares
- Actual volume: 3.1M shares → STRONG confirmation
---
### *4️⃣ Liquidity Trap Detection*
#### *Wick Analysis System*
- *Two-Filter Verification:*
1. *Wick Ratio (0.6):*
- Ensures majority of candle shows rejection
- Formula: (UpperWick + LowerWick) / Total Range > 0.6
2. *Min Wick Size (1% ATR):*
- Prevents false signals in flat markets
- Example: ATR=20 pips → Min wick=0.2 pips
- *Trap Identification Flowchart:*
Price Enters Zone →
Spikes Beyond Level →
Shows Long Wick →
Volume > Threshold →
TRAP CONFIRMED
---
## *💡 Master-Level Usage Techniques*
### *Institutional Order Flow Analysis*
1. *Step 1:* Identify pivot levels with ≥3 tests
2. *Step 2:* Watch for volume contraction near levels
3. *Step 3:* Enter when trap signal appears with:
- Wick > 2×ATR
- Volume > 1.5× average
### *Multi-Timeframe Confirmation*
1. *Higher TF:* Find weekly/monthly pivots
2. *Lower TF:* Use this indicator for precise entries
3. *Example:*
- Weekly pivot at $180
- 4H shows liquidity trap → High-probability reversal
---
## *⚠ Critical Mistakes to Avoid*
1. *Using Default Settings Everywhere*
- Crude oil needs higher ATR multiplier than bonds
2. *Ignoring Trap Context*
- Traps work best at:
- All-time highs/lows
- Major psychological numbers (00/50 levels)
3. *Overlooking Cumulative Volume*
- Check if volume is building over multiple tests
Cyclical Momentum PivotsCYCLICAL MOMENTUM PIVOTS
Overview
Cyclical Momentum Pivots is a streamlined indicator blending Cyclic Smoothed RSI (cRSI) with dynamic momentum detection to pinpoint high-probability trading pivots across stocks, forex, crypto, and more. Built on an adaptive cycle engine, it tracks market rhythm, delivering clear signals for momentum shifts and cyclic reversals, with an optional Hurst-style pivot forecast projected ahead of time. Powered by Pine Script v6, it uses lazy evaluation for real-time efficiency and precision.
How It Works
Momentum Signals (Green/Red Triangles)
Green Triangles (Below Bars): Trigger on volume spikes (default >2x 10-period SMA) with price surges (default ≥1.5%) or volume momentum (>20% over 5 bars).
Red Triangles (Above Bars): Same conditions with price drops.
Dynamic Tuning: Thresholds adjust via volatility (ATR, volume std dev) and cycle strength—stronger signals when cycles deviate far from a dynamic mean.
cRSI Band Crossovers (Turquoise/Purple Diamonds)
Turquoise Diamonds (Below Bars): cRSI crosses up through the low band—potential bullish pivot from oversold.
Purple Diamonds (Above Bars): cRSI crosses down through the high band—bearish pivot from overbought.
cRSI 25% Level Signals (Yellow Markers)
Yellow X (Above Bars): cRSI drops below 25% under the high band with a price decline—early bearish momentum cue.
Yellow O (Below Bars): cRSI rises above 25% over the low band with a price increase—early bullish momentum hint.
Cycle Momentum Signals (Green/Red Circles)
Green Circles (Below Bars): Cycle crosses above its dynamic mean—potential bullish acceleration.
Red Circles (Above Bars): Cycle dips below the mean—potential bearish slowdown.
Why Shorter Cycles Are Bearish, Longer Bullish: Shorter cycles (below mean) signal rapid swings—often bearish, reflecting seller-driven volatility. Longer cycles (above mean) indicate sustained trends—typically bullish, driven by buyer confidence.
Dynamic Cycle Length & Pivot Forecast
Calculation: Detects peaks/troughs over an adaptive window (scaled by smoothed cycle and sensitivity), averages distances, and smooths with an EMA (default 5). Clamped 10–40 bars. Dynamic mean adjusts to cycle length (default 2x multiplier).
Display: White number (e.g., "18") on cycle changes—off by default, toggle on via settings. Optional gray label (e.g., "P+10") forecasts bars until the next pivot, based on Hurst cycle analysis—off by default, toggle on via settings.
Hurst Pivot Forecast: Uses the average pivot period (full cycle, e.g., peak-to-peak or trough-to-trough) to predict the next pivot from the last cycle shift. Half-cycle (e.g., avgPivotPeriod / 2) marks potential midpoints, full cycle (default) targets the next major pivot, and 2x cycle (e.g., avgPivotPeriod * 2) forecasts longer-term turns—adjustable via sensitivity and multiplier settings for custom timing.
Key Features
Adaptive Cycle Engine: Peak/trough distances, smoothed with an EMA, scaled by sensitivity (default 1.0)—locks onto market rhythm.
Cycle Strength: Signals amplify with deviation from a dynamic mean—tighter thresholds in long cycles, looser in short ones.
Pivot Forecast: Optional Hurst-inspired prediction shows bars until the next pivot—enhances planning without clutter.
User Controls: Tune smoothing period (default 5), window sensitivity (0.5–2.0), and mean multiplier (1.0–5.0) for your market.
v6 Efficiency: Lazy evaluation optimizes conditions (e.g., momentumSignal and currentPriceChange > 0) for real-time precision.
Usage Tips
Timeframes: Scales from 5M to 1D—tweak settings for speed or stability.
Assets: Universal—adjust thresholds for volatility (e.g., 2.5 for crypto, 1.5 for forex).
Confirmation: Pair with support/resistance—e.g., green triangle + green circle = strong bullish pivot; red diamond + red circle = bearish pivot. Watch forecast (e.g., "P+5") for timing entries/exits.
Backtesting: Test historically—cycle strength and forecast boost accuracy in trending vs. ranging markets.
Settings
Use Auto Dominant Cycle Length: Enable (default) for adaptive cycles; disable for fixed (default 20).
Example: Enable for crypto’s wild swings; disable and set 30 for stable stocks—locks cycle to asset pace.
Base Volume Threshold: Default 2.0—raise for stricter signals, lower for more.
Example: 2.5 cuts noise in BTC/USD, 1.5 catches more in SPY—tunes signal frequency.
Base Price Change % Threshold: Default 1.5%—adjust for asset volatility.
Example: 2% for high-beta stocks, 1% for forex—matches price action scale.
Volume Momentum Lookback: Default 5—shorten for sensitivity, lengthen for stability.
Example: 3 for 5M scalping, 10 for 1D swings—sharpens momentum detection.
Show Cycle Labels: Disable (default)—enable to see cycle length changes.
Example: Enable on 1H for cycle tracking, disable on 5M for cleaner charts—reduces visual noise.
Show Pivot Forecast: Disable (default)—enable for Hurst-style next-pivot countdown.
Example: Enable on 4H for swing planning (e.g., "P+20"), disable on 15M for focus—adds timing insight.
Cycle Smoothing EMA Period: Default 5—faster (3) for volatility, slower (10) for trends.
Example: 3 smooths fast XRP cycles, 10 steadies SPX trends—reduces erratic signals.
Window Sensitivity: Default 1.0—lower (0.5) for tighter detection, higher (1.5) for broader cycles.
Example: 0.8 narrows for ETH’s chop, 1.2 widens for gold’s slow waves—tunes peak/trough precision.
Mean Multiplier: Default 2.0—shorter (1.5) for responsiveness, longer (3.0) for broader context.
Example: 1.5 tightens signals in 15M forex, 3.0 broadens for 1D indices—shifts momentum circle and forecast timing.
Show cRSI Band Crossovers: Enable (default) for cRSI signals; disable for simplicity.
Example: Enable for reversal plays, disable for momentum focus—cuts clutter.
Why It Stands Out
Cyclical Momentum Pivots’ auto-adaptive cycle—smoothed, strength-weighted, and dynamically averaged—tracks market shifts, delivering clear, actionable pivot signals with optional Hurst-style forecasting ahead of time. v6’s lazy evaluation ensures every trigger is computed efficiently, making it a go-to for traders seeking precision in momentum and reversals.

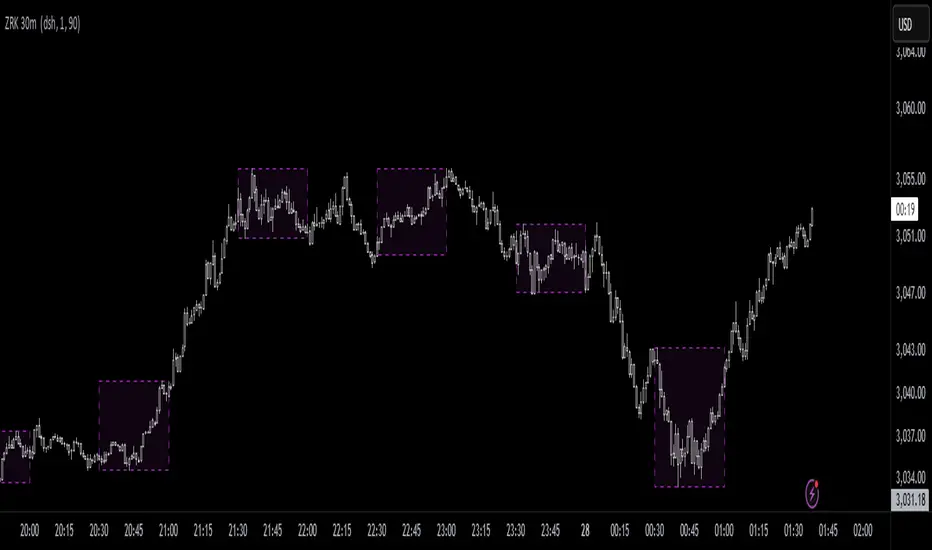
ZRK 30m This TradingView indicator draws alternating 30-minute boxes aligned precisely to real clock times (e.g., 10:00, 10:30, 11:00), helping traders visually segment intraday price action. It highlights every other 30-minute block with customizable colors, line styles, and opacity, allowing users to clearly differentiate between trading intervals. The boxes automatically adjust based on the chart’s timeframe, maintaining accuracy on 1-minute to 60-minute charts. Optional time labels can also be displayed for additional context. This tool is useful for identifying patterns, measuring volatility, or applying breakout strategies based on defined, consistent time windows across global trading sessions.
DF: VWAP Distance CounterDF: VWAP Distance Counter
This Pine Script v6 indicator calculates and displays the distance of the current price from a custom Volume Weighted Average Price (VWAP) and its upper/lower deviation bands, plotted as an overlay on the chart. The VWAP resets daily at 5:00 PM (17:00) and uses a user-defined standard deviation (default 2.25) to create bands. A floating label shows the price distance to the upper band, VWAP, and lower band in real-time, with customizable features including:
Text Size: Choose from tiny, small, normal, or large label sizes.
Colors: Customize the label background color and text colors (green for price above VWAP, red for below).
Position: Place the label in one of eight chart locations (Top Left, Top Right, Bottom Left, Bottom Right, Middle Left, Middle Right, Center Top, Center Bottom), with fine-tuning via vertical and horizontal offsets.
The label dynamically updates its position using a 10-bar lookback for high/low values and adjusts text color based on the price’s relation to VWAP, making it a versatile tool for traders monitoring price deviations.
beta-edition
dm for the donkey customized

Average Session Range - ASR [KasTrades]ASR levels for various sessions including 2 levels inside of the ASR high/low which are 0.833 and 0.167 levels that are dotted.
- You will notice that when daily session is selected, it automatically changes the table to detect the daily session ASR range periods.
-The default time frame used is New York for the daily session with the look back period to 1 and 3 weeks,. You will have to enter the time value manually, the drop down arrows only allow you to enter increments of 15min. You can adjust the periods in the settings , by default I set them at 5 and 15 to represent one week and three weeks.
- Detecting momentum for the ranges using historical range average against the current range average, we use the difference between the current and average range.
Bullish sentiment: If the difference is positive, it means the range is "higher the average" - if it Bearish sentiment: If the difference is negative "it means the range is "lower than average"
- You can decide to keep or remove the 2 showing the ASR numbers and momentum and volatility.

SMA & EMA Trend IndicatorIndicator that will use SMA and EMA to determine the price direction. The logic is:
If EMA (fast) is above SMA (slow) → uptrend (up arrow).
If EMA is below SMA → downtrend (down arrow).


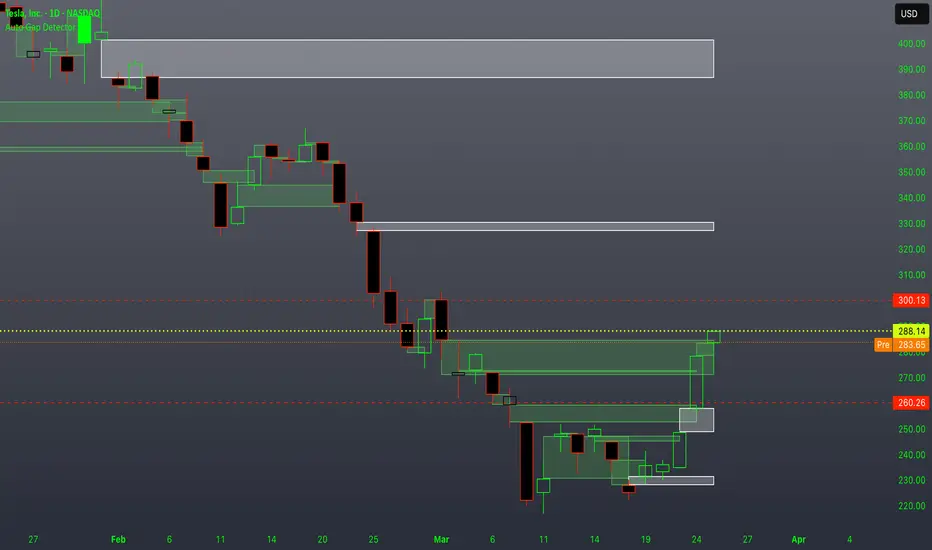
Auto Gap DetectorThis indicator uses previous sessions open/close (whichever is closest) and the new sessions open to automatically detect both a gap up or gap down on any timeframe but is intended for use on on the daily timeframe ONLY. This is not the traditional definition of a gap but the one that i use for my strategy and has been more consistent and conservative than others.
We have also provided instructions on how to create alerts for these indicators below.
Happy Trading!
White Boxes: indicate an overnight gap up/down that is incomplete or not filled.
Green Boxes: When a gap fill is complete the white box will be changed to a green box so that it may still be used as a reference for support and resistance on following sessions.
*Color, transparency and borders of boxes can be customized in settings.
Set Up Alerts
Now, let’s make sure you get notified when a gap has occurred and when it has been filled happens:
Open the Alerts Menu
On the chart, click the bell icon (top right of the screen) to create an alert.
Configure the Auto Gap indicator
In the “Condition” dropdown, select “Auto Gap indicator".
Below that, select “Overnight Gap Detected or Overnight Gap Filled.”
*Note: if you want to detect when both a gap has been detected and when it has been filled you must create two separate alerts.
Set “Once Per Bar Close” in the next dropdown (this ensures it only triggers after the period ends, avoiding false signals mid-bar).
Choose how you want to be notified (e.g., popup, email, or phone app—set this under “Notifications”).
Configure the Auto Gap Alert
Click the bell icon again to create a second alert.
Feel free to leave comments requesting any upgrades or potential bugs. Thank you!
Overextension Oscillator [by MR_LUCAS_01]The Overextension Oscillator is a custom TradingView indicator designed to detect market overextension by analyzing swing highs/lows, price distance from swings, and momentum shifts. It helps traders identify potential reversal zones where price is likely to retrace after an overextended move.
---
Key Features:
✅ Swing High/Low Detection – Identifies key pivot points to measure market extension.
✅ Overextension Calculation – Measures how far price has moved from recent swings.
✅ Oscillator with Smoothing – Uses EMA-based smoothing to generate reliable signals.
✅ Buy & Sell Signals – Highlights potential entry points when price reaches extreme zones.
✅ Color-Coded Candle Plotting – Enhances visibility of bullish and bearish zones.
✅ Threshold-Based Alerts – Notifies traders when price extends beyond a calculated limit.
---
How It Works:
1. Swing Point Detection:
Detects pivot highs/lows over a defined number of bars.
Measures the percentage difference between recent swing highs and lows.
2. Overextension Calculation:
Determines how far price has moved from the last significant swing.
Compares this movement to historical averages to assess overextension.
3. Oscillator Processing:
Creates an oscillator with smoothing to filter noise.
Highlights when price moves too far from equilibrium.
4. Buy & Sell Signal Generation:
Buy Signal: Price falls below a threshold relative to the last swing low.
Sell Signal: Price rises above a threshold relative to the last swing high.
Includes a cooldown period to avoid rapid repeated signals.
---
Visualization:
Bullish & Bearish Candles:
Green candles indicate bullish overextensions (potential reversals up).
Red candles indicate bearish overextensions (potential reversals down).
Signal Line (Neutral Color):
Plots a smoothed oscillator to track overextension movements.
Reference Levels:
0 Line: Center equilibrium.
+20 & -20 Bands: Indicate potential reversal zones.
Buy & Sell Signal Markers:
Green circles (Buy Signals) at oversold conditions.
Red circles (Sell Signals) at overbought conditions.
---
Customization Options:
Swing Detection Lengths – Adjust bar lookback periods for pivots.
Oscillator Smoothing – Modify EMA lengths for signal clarity.
Threshold Sensitivity – Fine-tune overextension criteria.
Cooldown Period – Prevent excessive signals in rapid moves.
---
Use Cases:
✔ Reversal Traders – Identify overextended price action for mean reversion trades.
✔ Trend Traders – Use as a filter to confirm pullback entries in trends.
✔ Scalpers & Swing Traders – Find quick reversals in volatile markets.
---
Conclusion:
The Overextension Oscillator is a powerful tool that helps traders identify extreme price movements and anticipate potential reversals. By combining swing analysis, distance measurements, and smoothed oscillations, it provides clear buy/sell signals in overextended markets.
