Bijnor Pivot ExtendedOverview: The Bijnor Pivot Extended (BP+) indicator is a powerful visual tool designed to help traders identify key price levels using Fibonacci-based pivots. It dynamically plots Support and Resistance levels based on your chosen timeframe (Daily, Weekly, or Monthly) and displays them only for the current session, reducing chart clutter and improving focus.
🔧 Features:
📆 Pivot Timeframe Selection: Choose between Daily, Weekly, or Monthly pivots.
🎯 Fibonacci Pivot Levels:
Central Pivot (P)
Resistance: R1, R2, R3, R4 (Extended)
Support: S1, S2, S3, S4 (Extended)
🎨 Full Customization:
Toggle labels and prices on/off
Position labels to the left or right
Change line width and individual colors for pivot, support, and resistance lines
🧠 Smart Line Plotting:
Lines are drawn only during the selected session, keeping your chart clean
🕹️ Max Performance: Optimized to stay lightweight with max_lines_count and max_labels_count set to 500
🧭 How to Use It:
Use this indicator to:
Plan entries and exits around key Fibonacci pivot zones
Identify overbought/oversold zones at R3/R4 and S3/S4
Enhance your intraday, swing, or positional trading setups
Combine with price action, candlestick patterns, or volume for maximum edge.
✅ Bonus:
This script is ideal for traders looking for a minimalist yet powerful pivot framework, with extended levels for breakout or reversal scenarios.
Точки разворота и уровни

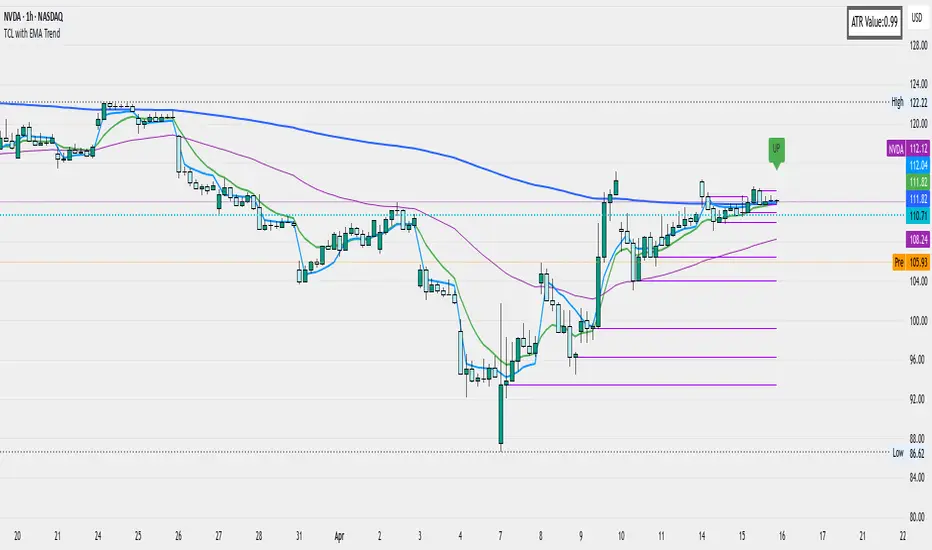
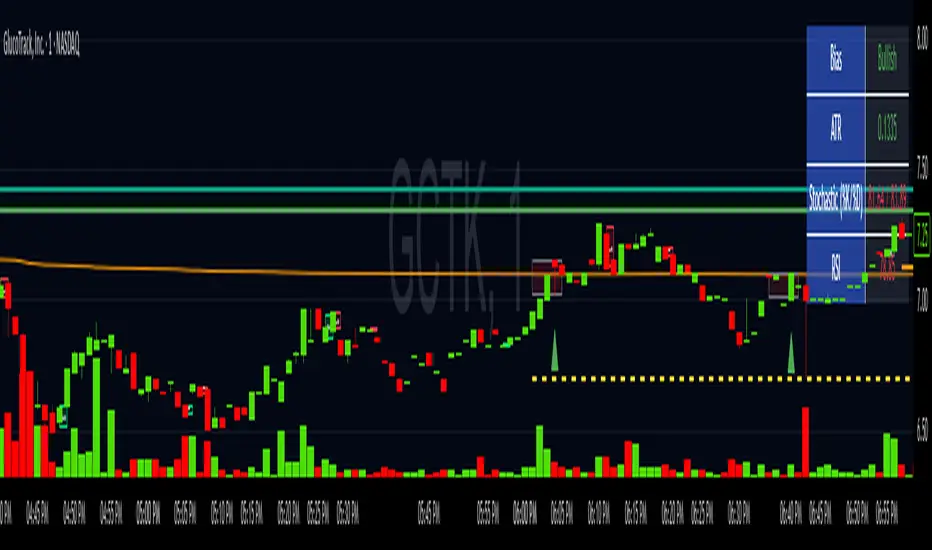
Pivot Levels with EMA Trend📌 Trend Change Levels with EMA Trend
✨ Description:
This TradingView script identifies clean trend change levels based on 1-hour structure shifts and filters them to keep only those not invalidated. It follows the "Jake Ricci" method, each level is printed at the beginning of the candle that changes the trend, on a 1 hour chart. For precision, make sure to exclude after/pre market and only use the levels on regular hours charts.
It includes dynamic EMAs (9, 50, 200), intraday VWAP, the daily open level printed, and a visual trend label based on EMA(9) slope.
Designed for intermediate traders, it helps build bias, manage entries, and avoid false setups by focusing on clean, reactive levels that the market respects.
🔧 Core Logic:
On the 1H chart, the script compares current and previous closes to detect trend direction. If the trend flips (e.g., up to down), the open of the candle that caused the flip becomes a candidate level.
Only levels that remain untouched by future candle closes are plotted — this filters out “weak” levels that price already violated (which means, a candle closes after passing through the level).
These levels become key S/R zones and often act as reaction points during pullbacks, traps, and liquidity sweeps.
The idea is to check how the price reacts to those levels. Usually there's a clean retest of the level. After that, if the price continues in that direction, it tends to reach the following level.
🔹 Included Tools:
🟣 Trend Change Levels (1H):
Fixed horizontal lines based on confirmed shifts in trend, shown only when not broken.
📉 EMAs (9 / 50 / 200):
Visibility can be set per timeframe. Use for trend context.
📍 EMA Trend Label:
Shows \"UP\", \"DOWN\", or \"RANGE\" based on EMA(9) slope.
🔵 VWAP (Intraday Reset):
Real-time volume-weighted average price that resets daily. Useful for fair value zones and reversion plays.
🟠 Daily Open Line:
Plot of the current day’s open. Used for intraday directional bias. Usually: DO NOT take longs below the Open Print, DO NOT take shorts above it.
📊 ATR Table:
Displays current ATR multiplier on the chart. It's useful to understand if the market is expanding or not.
📈 How to Use It (Strategy):
1. Start on the 1H chart to generate levels.
Only the open of candles that reversed trend are considered — and only if future candles didn’t close through them. I suggest manually adding horizontal lines to mark again the levels, so that they stick to all the timeframes.
2. Use the trend label to decide your bias — \"UP\" for long setups, \"DOWN\" for shorts. Avoid trading against the slope.
3. Switch to the 5m chart and wait for price to approach a plotted level. These are often used for manipulation, retests, or clean reversals.
4. Look for confirmation: rejection candles, break-and-retest, strong engulfing candles, or traps above/below the level. ALWAYS check the price action around the level, along with the volume.
5. Check if VWAP or an EMA is near the level. If yes, the confluence strengthens the trade idea.
6. Use the ATR value to understand if the market is expanding (candles are bigger than the ATR). You don't want to stay in a slow and ranging trade.
✅ Example Entry Flow:
1. On the 1H chart, note a trend change level printed recently.
2. Check the current trend label — if it says \"UP,\" prefer longs.
3. Wait for price to retrace toward the level.
4. On the 5m, look for a bullish engulfing candle or trap setup at the level.
5. Check if VWAP and EMA(50) are near. If yes, execute the trade.
6. Set stop just under the low of the candle prior to your entry. Ideally, a retracing candle.
To be clear: imaging to be LONG, you wait for a retracement that should touch your level. You wait for a candle that resumes the LONG trend, enter when it breaks the high of the previous candle (sill in retracement), you place your stop under the candle prior to your entry.
Notes:
No repainting — levels only show up after confirmed shifts.
Removes broken levels for chart clarity and reliability.
Helps spot high-probability pullback zones and fakeouts.
Perfect confluence tool to support price action, SMC, or EMA strategies.
Works across multiple timeframes with customizable inputs.
👤 Ideal For:
Intraday traders looking for reactive entry points and direction confirmation.
Swing traders wanting to pinpoint continuation zones or reversal pivots.
🚨 Final Note: This indicator doesn’t generate buy/sell signals. It improves your trade filtering by identifying areas the market already respected and reacting to them with price action. Combine it with your own system , test it in replay, and use screenshots to document setups.
📌 If used with discipline, this becomes a precision tool — not a signal generator.
Ethergy ChronosThe Ethergy Chronos indicator displays major time-based pivot points such as:
Monthly, weekly and daily - previous highs, previous lows, and current opens.
It also displays the separators for each month, week and day.
What makes it original is the fact that it is completely TIME-ZONE customizable, meaning that all specified pivots and separators are calculated and displayed according to the time-zone set.
For instance, if -4 UTC is selected, and the user chart is set to NY time as a default, all mentioned pivots and separators will reference 00:00 (midnight), months will start on the first Monday of that month at 00:00, weeks will start on Monday at 00:00 and daily will follow the same logic. if time-zone is set to -5 UTC then it will be at 01:00 and so forth.
Enjoy.
Ethergy

Combined EMA/Smiley & DEM System## 🔷 General Overview
This script creates an advanced technical analysis system for TradingView, combining multiple Exponential Moving Averages (EMAs), Simple Moving Averages (SMAs), dynamic Fibonacci levels, and ATR (Average True Range) analysis. It presents the results clearly through interactive, real-time tables directly on the chart.
---
## 🔹 Indicator Structure
The script consists of two main parts:
### **1. EMA & SMA Combined System with Fibonacci**
- **Purpose:**
Provides visual insights by comparing multiple EMA/SMA periods and identifying significant dynamic price levels using Fibonacci ratios around a calculated "Golden" line.
- **Components:**
- **Moving Averages (MAs)**:
- 20 EMAs (periods from 20 to 400)
- 20 SMAs (also from 20 to 400)
- **Golden Line:**
Calculated as the average of all EMAs and SMAs.
- **Dynamic Fibonacci Levels:**
Key ratios around the Golden line (0.5, 0.618, 0.786, 1.0, 1.272, 1.414, 1.618, 2.0) dynamically adjust based on market conditions.
- **Fibonacci Labels:**
Labels are shown next to Fibonacci lines, indicating their numeric value clearly on the chart.
- **Table (Top Right Corner):**
- Displays:
- **Input:** EMA/SMA periods sorted by their current average price levels.
- **AVG:** The average of corresponding EMA & SMA pairs.
- **EMA & SMA Values:** Individual EMA/SMA values clearly marked.
- **Dynamic Highlighting:** Highlights the row whose average (EMA+SMA)/2 is closest to the current price, helping identify immediate price action significance.
- **Sorting Logic:**
Each EMA/SMA pair is dynamically sorted based on their average values. Color coding (red/green) is used:
- **Green:** EMA/SMA pairs with shorter periods when their average is lower.
- **Red:** EMA/SMA pairs with longer periods when their average is lower.
- **Star (⭐):** Represents the "Golden" average clearly.
---
### **2. DEM System (Dynamic EMA/ATR Metrics)**
- **Purpose:**
Provides detailed ATR statistics to assess market volatility clearly and quickly.
- **Components:**
- **Moving Averages:**
- SMA lines: 25, 50, 100, 200.
- **Bollinger Bands:**
- Based on 20-period SMA of highs and standard deviation of lows.
- **ATR Analysis:**
- ATR calculations for multiple periods (1-day, 10, 20, 30, 40, 50).
- **ATR Premium:** Average ATR of all calculated periods, providing an overarching volatility indicator.
- **ATR Table (Bottom Right Corner):**
- Displays clearly structured ATR values and percentages relative to the current close price:
- Columns: **ATR Period**, **Value**, and **% of Close**.
- Rows: Each specific ATR (1D, 10, 20, 30, 40, 50), plus ATR premium.
- The ATR premium is highlighted in yellow to signify its importance clearly.
---
## 🔹 Key Features and Logic Explained
- **Dynamic EMA/SMA Sorting:**
The script computes the average of each EMA/SMA pair and sorts them dynamically on each bar, highlighting their relative importance visually. This allows traders to easily interpret the strength of current support/resistance levels based on moving averages.
- **Closest EMA/SMA Pair to Current Price:**
Calculates the absolute difference between the current price and all EMA/SMA averages, highlighting the closest one for quick reference.
- **Fibonacci Ratios:**
- Dynamically calculated Fibonacci levels based on the "Golden" EMA/SMA average give clear visual guidance for potential targets, supports, and resistances.
- Labels are continuously updated and placed next to levels for clarity.
- **ATR Volatility Analysis:**
- Provides immediate insight into market volatility with absolute and relative (percentage-based) ATR values.
- ATR premium summarizes volatility across multiple timeframes clearly.
---
## 🔹 Practical Use Case:
- Traders can quickly identify support/resistance and critical price zones through EMA/SMA and Fibonacci combinations.
- Useful in assessing immediate volatility, guiding stop-loss and take-profit levels through detailed ATR metrics.
- The dynamic highlighting in tables provides intuitive, real-time decision support for active traders.
---
## 🔹 How to Use this Script:
1. **Adjust EMA & SMA Lengths** from indicator settings if different periods are preferred.
2. **Monitor dynamic Fibonacci levels** around the "Golden" average to identify possible reversal or continuation points.
3. **Check EMA/SMA table:** Rows highlighted indicate immediate significance concerning current market price.
4. **ATR table:** Use volatility metrics for better risk management.
---
## 🔷 Conclusion
This advanced Pine Script indicator efficiently combines multiple EMAs, SMAs, dynamic Fibonacci retracement levels, and volatility analysis using ATR into a comprehensive real-time analytical tool, enhancing traders' decision-making capabilities by providing clear and actionable insights directly on the TradingView chart.

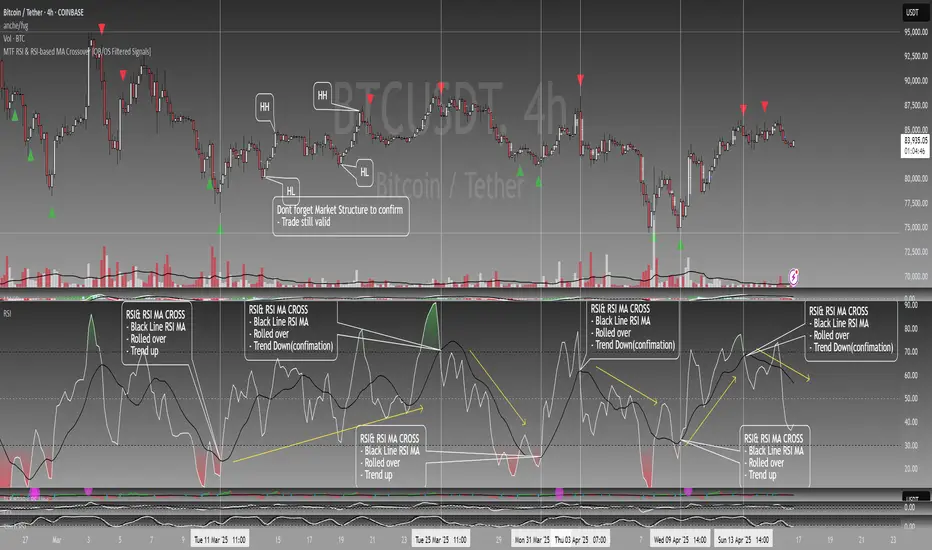
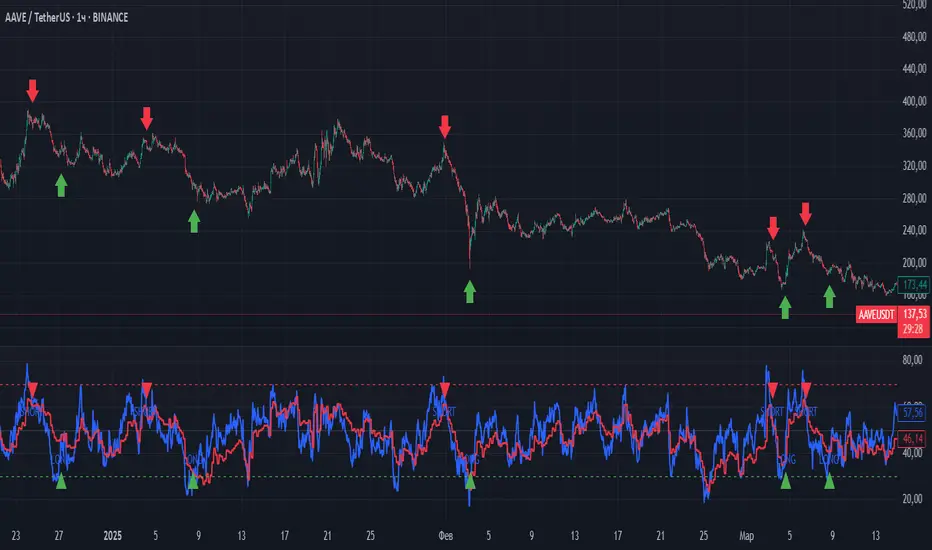
MTF RSI & SMA Crossover [OB/OS Filtered Signals]MTF RSI & SMA Crossover
This custom indicator combines the power of Multi-Timeframe (MTF) RSI, Simple Moving Average (SMA), and overbought/oversold (OB/OS) conditions to provide precise buy and sell signals based on the crossovers of the RSI and its SMA. The indicator includes the following features:
MTF RSI: The Relative Strength Index (RSI) is calculated on a customizable timeframe, giving traders the ability to analyze price momentum across different timeframes.
SMA of RSI: The RSI is smoothed using a Simple Moving Average (SMA), helping to filter out market noise and identify clearer trend reversals.
Overbought/Oversold Filter: Signals are only triggered when the RSI has been in an overbought (above 70) or oversold (below 30) condition, improving the reliability of potential trend reversals.
Buy/Sell Signals:
Buy signals occur when the RSI crosses above its SMA after being oversold, indicating potential upward momentum.
Sell signals occur when the RSI crosses below its SMA after being overbought, indicating potential downward momentum.
Customizable Label Colors: Choose your own colors for the "BUY" and "SELL" labels to match your chart's design and preferences.
Alerts: Set alerts for buy and sell signals, ensuring you don't miss a potential trade.
This indicator is ideal for traders who want to capture trend reversals and momentum shifts while filtering out false signals by using overbought and oversold conditions. Customize the settings to suit your trading style and strategy.
StonkGame Major Market Open/ClosePlots vertical lines for Tokyo, London, and New York session opens and closes — auto-adjusted to your chart's timezone.
Open lines = lighter, dashed style.
Close lines = solid, full-color style.
Helps identify key liquidity windows, session-driven volatility, and clean market structure — without chart clutter.
Fully customizable colors and line styles for a professional, minimal look.
Liquidity Zones Alerts"Liquidity Zones Alerts" is a powerful smart-money-based indicator designed to detect key liquidity grabs and provide high-probability reversal signals using a combination of market structure, volume, volatility, and candlestick confirmation.
🧠 How It Works
The core logic of this indicator is built around the Smart Money Concepts:
🔺 Liquidity Sweeps: Detects when price takes out previous daily or weekly highs/lows, suggesting stop hunts or engineered liquidity moves by institutional players.
📈 Volume Filter: Ensures signals only appear during above-average volume, filtering out noise and low-interest moves.
⚡ Volatility Filter: Flags high-range candles relative to the average, catching flash crashes/spikes that often precede strong reversals.
🔄 Engulfing Candle Confirmation: Confirms entry with a bullish or bearish engulfing pattern after liquidity is taken — increasing signal reliability.
🧭 Premium/Discount Zone Logic: Trades are filtered to ensure longs are only taken in discount zones, and shorts in premium zones, using a 20-period market range for context.
📌 Features
✅ Daily & Weekly liquidity zones toggle
✅ Visual signals with clean 🔻(short) & 🔺(long) arrows
✅ Auto-detection of flash crashes
✅ Alerts on both long and short setups
✅ Optional previous high/low level plotting for context
✅ Background highlighting of valid signal candles
✅ Multi-timeframe friendly and compatible with any asset
🛠️ Use Case
Whether you're a scalper or a swing trader, this tool helps you spot institutional entry zones before the move happens. It works especially well when combined with your existing bias or supply/demand zones.
💬 “Price doesn't move randomly — it hunts liquidity. This indicator shows you where and when it happens.”

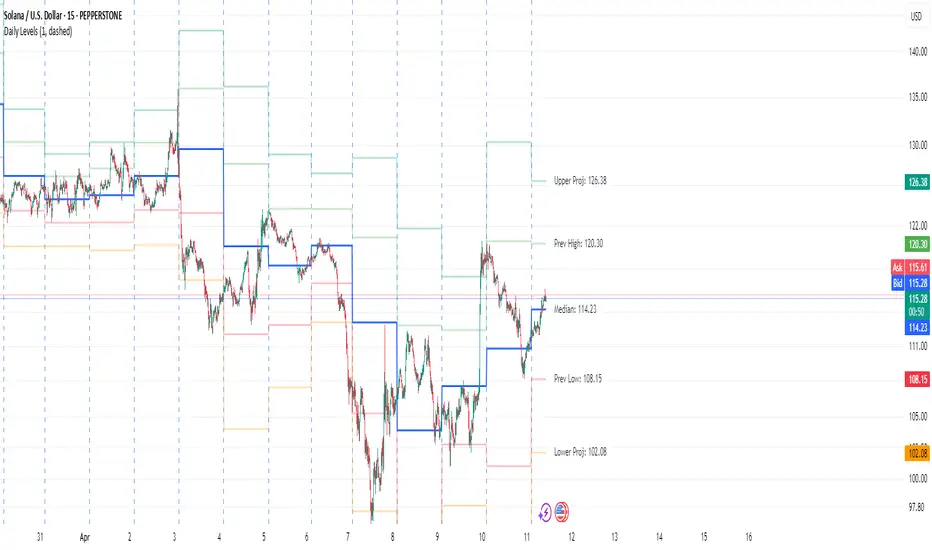
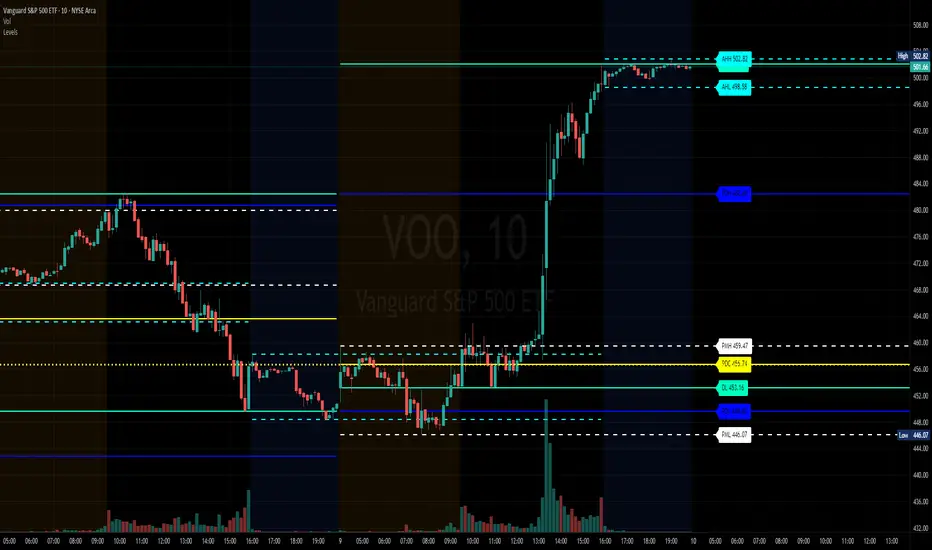
Daily LevelsOverview:
The Daily Levels indicator plots key price levels from the previous trading day, including the high, low, median (pivot), and projected extensions. These levels help traders identify potential support/resistance zones and anticipate breakout or reversal opportunities.
Key Features:
✅ Previous Day High & Low – Visualizes the prior day’s high and low as dynamic support/resistance levels.
✅ Median (Pivot) Line – Calculates the midpoint between the previous day’s high and low, acting as a key intraday reference.
✅ Projected Levels – Extends the high/low range symmetrically above and below the median, highlighting potential breakout zones.
✅ Customizable Display – Toggle visibility, adjust colors, and modify line styles (solid, dotted, dashed).
✅ Price Labels – Clear on-chart labels showing exact price values for quick reference.
✅ Built-in Alerts – Get notified when price crosses any of the key levels.
How to Use:
Trend Identification: If price holds above the median, the bias is bullish; below suggests bearish momentum.
Breakout Trading: Watch for moves beyond the projected levels for potential continuation.
Mean Reversion: Fade moves toward the previous day’s high/low if the median holds as support/resistance.
Ideal For:
Day Traders – Intraday support/resistance levels.
Swing Traders – Context for multi-day trends.
Breakout/Reversal Strategies – Clear levels for trade triggers.
Settings Recommendations:
High/Low Lines: Use semi-transparent colors (e.g., green/red) for clarity.
Projections: Helpful for anticipating extended moves (e.g., teal for upper, orange for lower).
Alerts: Enable notifications for key crosses (e.g., median or high/low breaks).
Dual RSIHello everyone! I want to show you my version of the RSI indicator. As you may have noticed, in this indicator I decided to use 2 RSI at once, and here's why. I discovered that crossovers between fast and slow RSI can generate good signals. Very often we can determine an entry point with it, and it works just as well as RSI versions with divergences.
So, all you need to do is configure the timeframe from which the RSI will be displayed. For example, when I work on an hourly timeframe, I enable both hourly and four-hour RSI. When the hourly RSI crosses the four-hour RSI from above, it signals that you should look for a short entry point. Conversely, if the hourly RSI crosses the four-hour RSI from below, you should look for a long entry point.
Overall, everyone can choose these settings for themselves. You can also adjust the overbought and oversold zones to increase or decrease the frequency of signals.
This indicator can be a good addition to your strategy. Good luck!
SMC+The "SMC+" indicator is a comprehensive tool designed to overlay key Smart Money Concepts (SMC) levels, support/resistance zones, order blocks (OB), fair value gaps (FVG), and trap detection on your TradingView chart. It aims to assist traders in identifying potential areas of interest based on price action, swing structures, and volume dynamics across multiple timeframes. This indicator is fully customizable, allowing users to adjust lookback periods, colors, opacity, and sensitivity to suit their trading style.
Key Components and Functionality
1. Key Levels (Support and Resistance)
This section plots horizontal lines representing support and resistance levels based on highs and lows over three distinct lookback periods, plus daily nearest levels.
Short-Term Lookback Period (Default: 20 bars)
Plots the highest high (short_high) and lowest low (short_low) over the specified period.
Visualized as dotted lines with customizable colors (Short-Term Resistance Color, Short-Term Support Color) and opacity (Short-Term Resistance Opacity, Short-Term Support Opacity).
Adjustment Tip: Increase the lookback (e.g., to 30-50) for less frequent but stronger levels on higher timeframes, or decrease (e.g., to 10-15) for scalping on lower timeframes.
Long-Term Lookback Period (Default: 50 bars)
Plots broader support (long_low) and resistance (long_high) levels using a solid line style.
Customizable via Long-Term Resistance Color, Long-Term Support Color, and their respective opacity settings.
Adjustment Tip: Extend to 100-200 bars for swing trading or major trend analysis on daily/weekly charts.
Extra-Long Lookback Period (Default: 100 bars)
Identifies significant historical highs (extra_long_high) and lows (extra_long_low) with dashed lines.
Configurable with Extra-Long Resistance Color, Extra-Long Support Color, and opacity settings.
Adjustment Tip: Use 200-500 bars for monthly charts to capture macro-level key zones.
Daily Nearest Resistance and Support Levels
Dynamically calculates the nearest resistance (daily_res_level) and support (daily_sup_level) based on the current day’s price action relative to historical highs and lows.
Displayed with Daily Resistance Color and Daily Support Color (with opacity options).
Adjustment Tip: Works best on intraday charts (e.g., 15m, 1h) to track daily pivots; combine with volume profile for confirmation.
How It Works: These levels update dynamically as new highs/lows form, providing a visual guide to potential reversal or breakout zones.
2. SMC Inputs (Smart Money Concepts)
This section identifies swing structures, order blocks, fair value gaps, and entry signals based on SMC principles.
SMC Swing Lookback Period (Default: 12 bars)
Defines the period for detecting swing highs (smc_swing_high) and lows (smc_swing_low).
Adjustment Tip: Increase to 20-30 for smoother swings on higher timeframes; reduce to 5-10 for faster signals on lower timeframes.
Minimum Swing Size (%) (Default: 0.5%)
Filters out minor price movements to focus on significant swings.
Adjustment Tip: Raise to 1-2% for volatile markets (e.g., crypto) to avoid noise; lower to 0.2-0.3% for forex pairs with tight ranges.
Order Block Sensitivity (Default: 1.0)
Scales the size of detected order blocks (OBs) for bullish reversal (smc_ob_bull), bearish reversal (smc_ob_bear), and continuation (smc_cont_ob).
Visuals include customizable colors, opacity, border thickness, and blinking effects (e.g., SMC Bullish Reversal OB Color, SMC Bearish Reversal OB Blink Thickness).
Adjustment Tip: Increase to 1.5-2.0 for wider OBs in choppy markets; keep at 1.0 for precision in trending conditions.
Minimum FVG Size (%) (Default: 0.3%)
Sets the minimum gap size for Fair Value Gaps (fvg_high, fvg_low), displayed as boxes with Fair Value Gap Color and FVG Opacity.
Adjustment Tip: Increase to 0.5-1% for larger, more reliable gaps; decrease to 0.1-0.2% for scalping smaller inefficiencies.
How It Works:
Bullish Reversal OB: Detects a bearish candle followed by a bullish break, marking a potential demand zone.
Bearish Reversal OB: Identifies a bullish candle followed by a bearish break, marking a supply zone.
Continuation OB: Spots strong bullish momentum after a prior high, indicating a continuation zone.
FVG: Highlights bullish gaps where price may retrace to fill.
Entry Signals: Plots triangles (SMC Long Entry) when price retests an OB with a liquidity sweep or break of structure (BOS).
3. Trap Inputs
This section detects potential bull and bear traps based on price action, volume, and key level rejections.
Min Down Move for Bear Trap (%) (Default: 1.0%)
Sets the minimum drop required after a bearish OB to qualify as a trap.
Visualized with Bear Trap Color, Bear Trap Opacity, and blinking borders.
Adjustment Tip: Increase to 2-3% for stronger traps in trending markets; lower to 0.5% for ranging conditions.
Min Up Move for Bull Trap (%) (Default: 1.0%)
Sets the minimum rise required after a bullish OB to flag a trap.
Customizable with Bull Trap Color, Bull Trap Border Thickness, etc.
Adjustment Tip: Adjust similarly to bear traps based on market volatility.
Volume Lookback for Traps (Default: 5 bars)
Compares current volume to a moving average (avg_volume) to filter low-volume traps.
Adjustment Tip: Increase to 10-20 for confirmation on higher timeframes; reduce to 3 for intraday sensitivity.
How It Works:
Bear Trap: Triggers when price drops significantly after a bearish OB but reverses up with low volume or support rejection.
Bull Trap: Activates when price rises after a bullish OB but fails with low volume or resistance rejection.
Boxes highlight trap zones, resetting when price breaks out.
4. Visual Customization
Line Width (Default: 2)
Adjusts thickness of support/resistance lines.
Tip: Increase to 3-4 for visibility on cluttered charts.
Blink On (Default: Close)
Sets whether OB/FVG borders blink based on Open or Close price interaction.
Tip: Use "Open" for intraday precision; "Close" for confirmed reactions.
Colors and Opacity: Each element (OBs, FVGs, traps, key levels) has customizable colors, opacity (0-100), border thickness (1-5 or 1-7), and blink effects for dynamic visualization.
How to Use SMC+
Setup: Apply the indicator to any chart and adjust inputs based on your timeframe and market.
Key Levels: Watch for price reactions at short, long, extra-long, or daily levels for potential reversals or breakouts.
SMC Signals: Look for entry signals (triangles) near OBs or FVGs, confirmed by liquidity sweeps or BOS.
Traps: Avoid false breakouts by monitoring trap boxes, especially near key levels with low volume.
Notes:
This indicator is a visual aid and does not guarantee trading success. Combine it with other analysis tools and risk management strategies.
Performance may vary across markets and timeframes; test settings thoroughly before use.
For optimal results, experiment with lookback periods and sensitivity settings to match your trading style.
The default settings are optimal for 1 minute and 10 second time frames for small cap low float stocks.
Continuation OB are Blue.
Bullish Reversal OB color is Green
Bearish Reversal OB color is Red
FVG color is purple
Bear Trap OB is red with a green border and often appears with a Bearish Reversal OB signaling caution to a short position.
Bull trap OB is green with a Red border signaling caution to a long position.
All active OB area are highlighted and solid in color while other non active OB area are dimmed.
My personal favorite setups are when we have an active bullish reversal with an active FVG along with an active Continuation OB.
Another personal favorite is the Bearish reversal OB signaling an end to a recent uptrend.
The Trap OB detection are also a unique and Original helpful source of information.
The OB have a white boarder by default that are colored black giving a simulated blinking effect when price is acting in that zone.
The Trap OB border are colored with respect to direction of intended trap, all of which can be customized to personal style.
All vaild OB zones are shown compact in size ,a unique and original view until its no longer valid.
Intraday LevelsWhat it shows:
This indicator is useful for day trading, where it will track and display you important price levels which includes:
Premarket Low (PML)
Premarket High (PMH)
Previous Day Low (PDL)
Previous Day High (PDH)
Previous Day Close (PDC)
After Hours Low (AHL)
After Hours High (AHH)
Day Low (DL)
Day High (DH)
The price level lines and labels will automatically adjust itself as the price moves, eliminating the need of manually having to adjusting these levels.
How to use it:
At these levels it can act as important support resistance points during the day and can often serve as a important pivot point for any ticker. You can expect price rejection or bounce when the price approaches these levels.
Key settings:
For each of the levels, user can adjust in the settings menu:
Line Colour
Line Thickness
Line Style
Label Text
Price Labelling on Label
Label Location (Offset from current bar)
Ability to turn on/off the price level and label
Display levels for either all days or on the day
Tracking Lines with TP/SL + Labels at LeftA simple indicator so you can set your TP and SL tolerance along with capital and leverage.
A red line and green line will represent where current TP and SL would be on the chart along with the number of tokens you need to trade to meet the USD capital to be trades.
Just gives a visual representation of SL to key zones on the chart so you can judge scalp entries a little better :)

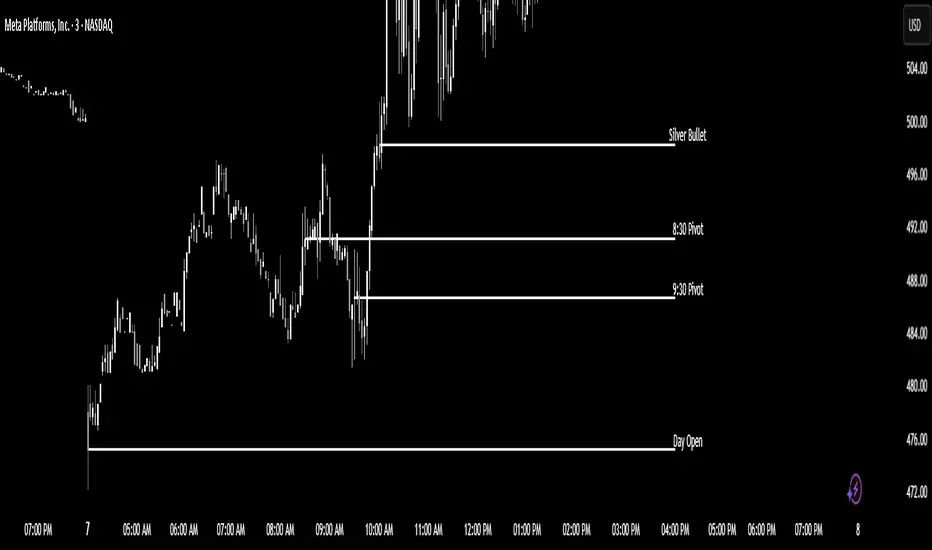
Bull Bear Pivot by RawstocksThe "Bull Bear Pivot" indicator is a custom Pine Script (v5) tool designed for TradingView to assist traders in identifying key price levels and pivot points on intraday charts (up to 1-hour timeframes). It combines time-based open price markers, pivot high/low detection, and candlestick visualization to provide a comprehensive view of potential support, resistance, and trend reversal levels. Below is a detailed description of the indicator’s functionality, features, and intended use.
Indicator Overview:
The "Bull Bear Pivot" indicator is tailored for intraday trading, focusing on specific times of the day to mark significant price levels (open prices) and detect pivot points. It plots horizontal lines at the open prices of user-defined sessions, identifies pivot highs and lows on the current chart timeframe, and overlays custom candlesticks to highlight price action. The indicator is designed to work on timeframes of 1 hour or less (e.g., 1-minute, 3-minute, 5-minute, 15-minute, 30-minute, 60-minute) and includes a warning mechanism for invalid timeframes.
Key Features:
Time-Based Open Price Markers:
The indicator allows users to define up to five time-based sessions (e.g., 4:00 AM, 8:30 AM, 9:30 AM, 10:00 AM, and a custom time) to capture the open price at the start of each session.
For each session, it plots a horizontal line at the 1-minute open price, extending from the session start to the market close at 4:00 PM EST.
Each line is accompanied by a label positioned 5 bars to the right of the market close (4:00 PM EST), with the text right-aligned and vertically centered on the line.
Users can enable/disable each marker, customize the session time, label text, line color, and text color via the indicator’s settings.
Pivot Highs and Lows:
The indicator calculates pivot highs and lows on the current chart timeframe using the ta.pivothigh and ta.pivotlow functions.
Pivot highs are marked with green triangles above the bars, and pivot lows are marked with red triangles below the bars.
The pivot period (lookback/lookforward) is user-configurable, allowing flexibility in detecting short-term or longer-term reversals.
Custom Candlesticks:
The indicator overlays custom candlesticks on the chart, colored green for bullish candles (close > open) and red for bearish candles (close < open).
This feature helps visualize price action alongside the open price markers and pivot points.
Timeframe Restriction:
The indicator is designed to work on timeframes of 1 hour or less. If the chart timeframe exceeds 1 hour (e.g., 4-hour, daily), a warning label ("Timeframe > 1H Indicator Disabled") is displayed, and no elements are plotted.
Customizable Appearance:
Users can customize the appearance of the open price marker lines, including the line style (solid, dashed, dotted) and line width.
Labels for the open price markers have no background (transparent) and use customizable text colors.
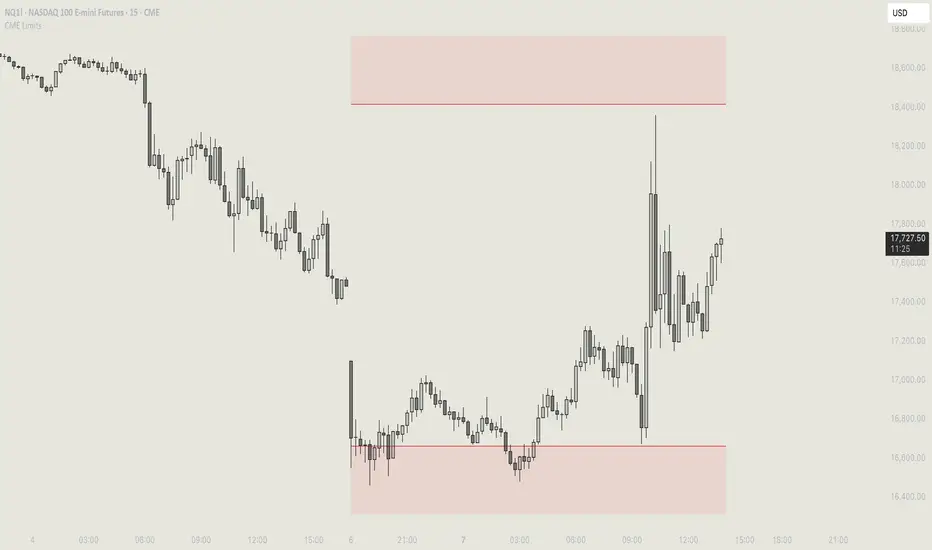
CME Price Limits (Futures Prop Firm Rule)This indicator shows the CME Price Limit, combined with a safety distance that is used by several futures prop firms. Trading in the highlighted area means a rule violation for many Futures prop firm accounts.
The levels are calculated from the "Settlement as close" closing price of the previous daily candle.
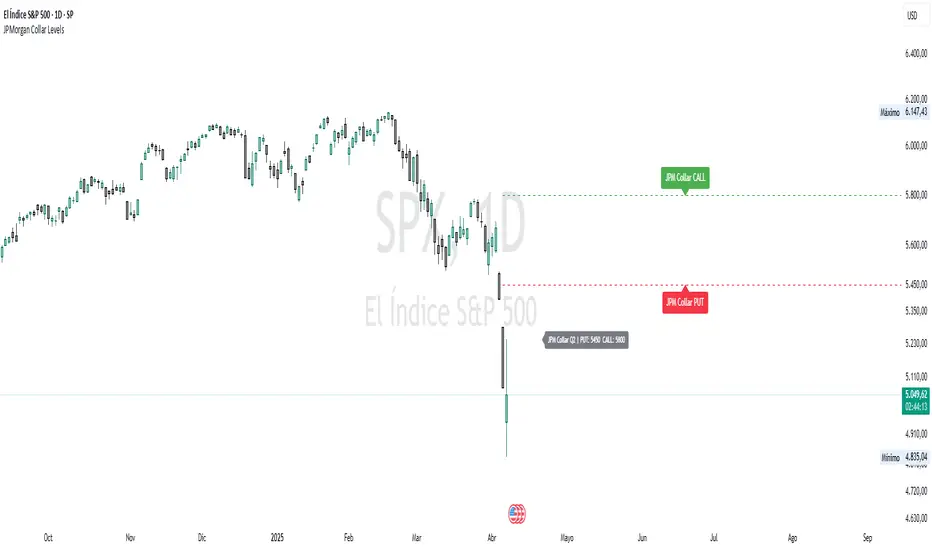
JPMorgan Collar LevelsThis indicator visualizes the current JPMorgan Hedging Collar strategy commonly used by institutional funds like JHEQX. It plots three key levels:
– Short Call strike (upper bound)
– Long Put strike (protection level)
– Short Put strike (cost reduction)
The area between the long put and short call is shaded to represent the active hedging zone. This setup is updated quarterly and can influence SPX market behavior near expiration dates.
Inputs are customizable to reflect the latest collar configuration. Useful for traders tracking institutional hedging flows or analyzing market structure near key option expirations.
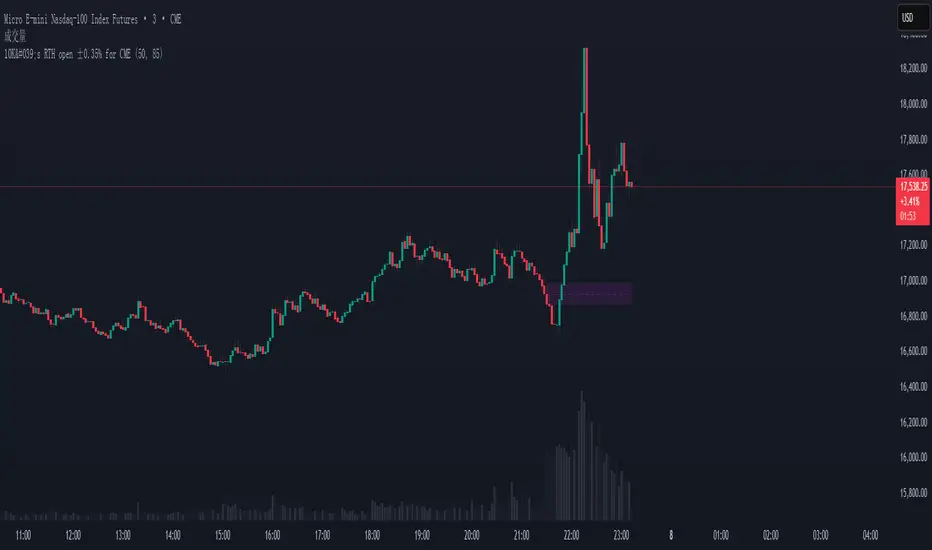
10K's RTH open ±0.35% for CMEInstant Visualization of ±0.35% from RTH Open — Spot Intraday Reversals at a Glance!
This is a visual tool designed for the U.S. regular trading hours (RTH), which instantly highlights the ±0.35% range from the RTH opening price of futures at the start of the session.
The range is displayed as a light purple box, accompanied by a dashed line marking the exact opening price, helping traders quickly assess how price reacts around this key level.
With adjustable transparency settings, this tool is ideal for intraday analysis of price positioning and directional strength — a valuable aid for short-term trading strategies.
Market Phases (ZigZag + MA + RSI)This script is a TradingView Pine Script that visualizes market phases using the ZigZag pattern, Moving Averages (MA), and the Relative Strength Index (RSI). It allows traders to identify key market conditions, such as accumulating, distributing, bullish, and bearish phases based on price movements and momentum indicators.
#### Components
1. ZigZag Settings:
- Depth: Controls the sensitivity of the ZigZag indicator. A higher value results in fewer price points being considered as reversals.
- Deviation: Defines the minimum percentage change needed to identify a ZigZag point, preventing small fluctuations from being registered.
- Backstep: Specifies the number of bars to look back for identifying highs and lows.
2. Moving Average Settings:
- MA Length: The number of periods used to calculate the moving average.
- MA Type: The type of moving average to use, either Simple Moving Average (SMA) or Exponential Moving Average (EMA).
3. RSI Settings:
- RSI Length: The period for calculating the RSI.
- Overbought Level: The threshold above which the asset is considered overbought.
- Oversold Level: The threshold below which the asset is considered oversold.
4. Calculations:
- Moving Average and RSI Calculation: The script calculates either an SMA or EMA and the RSI based on user-defined settings.
5. ZigZag Enhanced Calculation:
- It identifies swing highs and lows to determine the ZigZag points for improved trend analysis.
6. Trend Direction:
- The script checks the direction of the trend based on the latest ZigZag points.
7. Market Phase Determination:
- The script defines the market phase (Accumulation, Distribution, Bullish, Bearish) based on the trend direction and levels from the RSI and relationship with the moving average.
8. Background Colors:
- The background is tinted according to the identified market phase for visual clarity.
9. Labels and Plotting:
- Labels are generated at the last bar with the current phase and RSI value.
- The moving average and last ZigZag points are plotted on the chart for further reference.
### Conclusion
This script provides a comprehensive view of market conditions by integrating multiple indicators, helping traders make informed trading decisions based on market dynamics. The ability to visualize phases and key indicators aids in recognizing potential entry and exit points in trading strategies.
If you have any questions or need further modifications, feel free to ask!

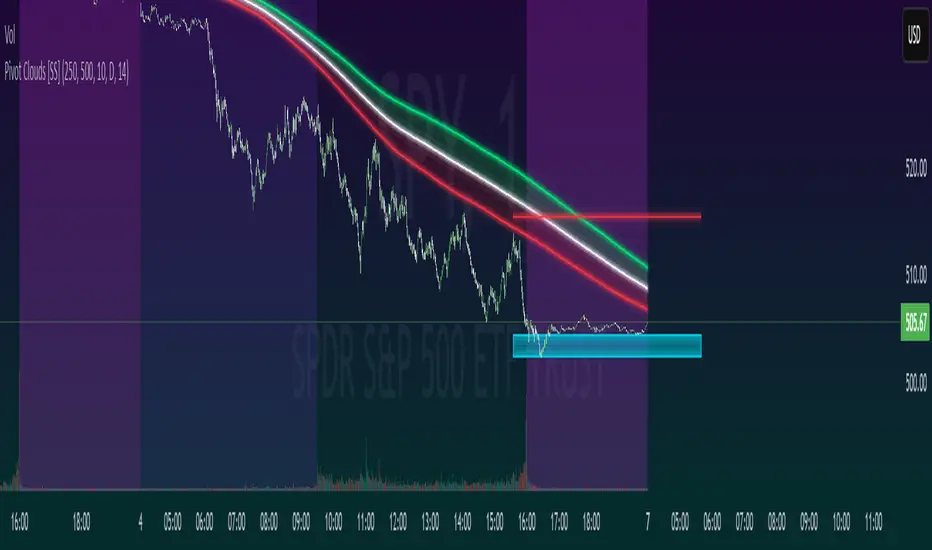
Pivot Clouds [SS]Hey everyone,
Whopper indicator here that I have been working on for some time, excited to finally release it! So let's get into it!
☁️☁️ What are Pivot Clouds?! ☁️☁️
The concept for pivot clouds came from trailing and erroring different iterations of support and resistance (which ultimately led to the creation of the BIN Based Support and Resistance indicator).
In the design and creation of my BIN support and resistance indicator, I initially tried to do something similar with pivot points. However, I found pivots to be relatively ineffective as support and resistance, especially in very trendy markets, and the BIN approach reigned supreme. However, not wanting to abandon the utility of pivots, I tried something different, creating a pivot based SMA.
This proved most useful and very helpful for determining directions, rejections and trends! From there, came this indicator, the Pivot Clouds. This is currently iteration 32 haha, which will be the final iteration for the time being and most functional.
The pivot cloud indicator works by smoothing pivot highs and pivot lows over the course of your inputted length. My general suggestion is to keep it between 150 to 250. Going to low will make it incredibly choppy. Using 200 seems to be the sweet spot for most tickers.
Over the course of the pivot lookback, it collects all pivot highs and pivot lows, then averages them out to create 2 separate SMAs, those being an SMA for the pivot high and an SMA for the pivot low. Together, these create the cloud you see in the main chart.
In addition to creating this cloud, the indicator marks and tracks pivot maxes to both the upside and downside and will draw cloud support on a fall below the main cloud and cloud resistance on a rise above the main cloud, as exampled here:
Above:
And Below:
These clouds represent the average of the pivot high/pivot low and extend to the max or min (high or low depending on position on the main cloud).
💡 Alternative Abilities 💡
Resulting from the sometimes inadequacy of pivots to determine targets and resistance/support, the indicator is capable of pulling in ATR target prices. This allows the user to either use both, pivot max/min clouds AND ATR targets, or simply one or the other.
The ATR targets can be customized in the indicator settings, with a default of daily timeframe targets on a 14 ATR lookback.
Here are some examples of how the ATR targets look:
And to the upside:
📈 Standalone Strategy 📈
This indicator can be used as a standalone strategy, or to complement other strategies. I will go over both briefly, starting with standalone strategy:
Select your target preference (ATR, Pivot Maxes and Mins or both)
Long on a break and hold over the main cloud to the targets; or
Shrot on a break below the main cloud to the targets.
That simple!
🎯Supplemental to existing Strategy 🎯
This indicator for me is gold for my strategy, which involves longing or shorting to calculated target prices.
You essentially follow the above, only your targets are determined by your strategy. So for me, I look for a rejection or hold of the cloud, to long or short to my targets:
💰Customizing the Indicator 💰
Let's quickly go over these options:
Smooth length: Creates a smooth cloud. Suggested limits are 150 - 250
Lookback Length: This determines the length of lookback for the indicator to store historical pivot information and create the clouds.
Pivot Lookforward/backward: Allows the user to select custom pivot timeframes. The traditional rule is 10, but 5 sometimes is preferred on larger timeframes.
Show Pivot Max and Min: These enables the pivot max and min cloud for a crossover or crossunder of the main cloud.
ATR timeframe: determines the ATR target price levels to look for. You can toggle weekly, daily, hourly, whichever you prefer.
ATR Length: Allows you to customize the lookback for determining the ATR targets.
USE ATR targets: This will turn on / off the ATR targets, if you wish to use/not use these reference points with the indicator, same as with the pivot max and min cloud toggle.
And that's the indicator, folks!
Hope you like it,
Take care and safe trades!🚀
ORB - Futures and Stocks (Breakouts + Alerts + ORB Selector)This indicator shows the Opening Range Breakout (ORB) based on the time range you choose.
Important:
It only works for intraday trading on time frames less than 1 day (like 1-minute, 5-minute, or hourly charts).
You can use it with any stock or futures, such as US500, NAS100, or GER40.
Inputs:
ORB Range - Your preference.
Session Start
Time Zone Offset
Examples:
for EU Frankfurt, DAX (GER40):
Set your ORB range
Session Start 0900
Time Zone Offset +1
For US Stock Market and US500, NAS100:
Set your ORB range
Session Start 0930
Time Zone Offset -5
Created using ChatGPT
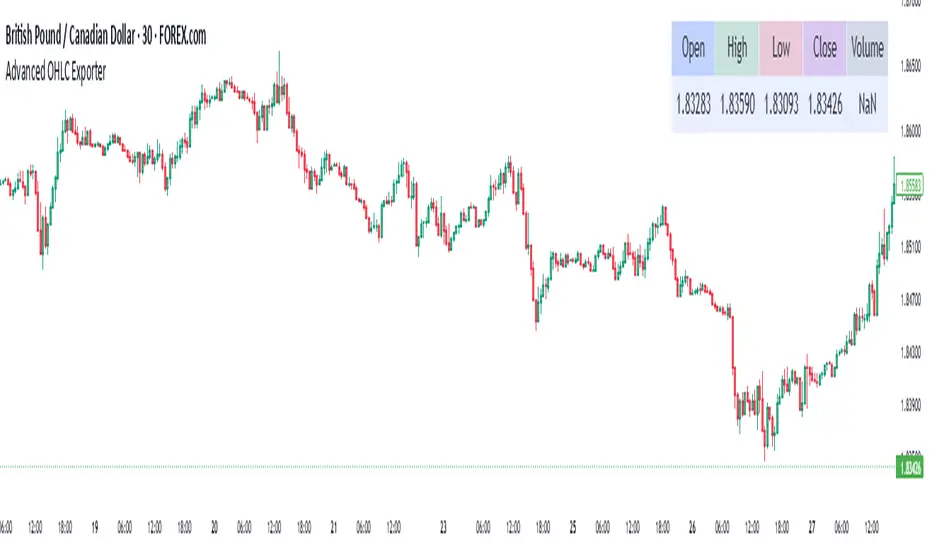
Advanced OHLC ExporterThis Pine Script indicator provides one-click export of candlestick data (OHLC + Volume) from any TradingView chart. It displays the current candle's values in a clean table while ensuring all visible historical data is available for export in CSV format.
Key Features
📊 Visual Data Display
Real-time OHLC table in the top-right corner.
Color-coded values for quick analysis (green=high, red=low).
Volume shown in standardized formatting.
Data Export Ready
All plotted values appear in TradingView's Data Window.
Right-click → "Export Data" to save:
Open, High, Low, Close (OHLC) prices
Trading volume
Timestamps for each candle
⚙️ Customizable Output
Works on any timeframe (1m to 1M)
Compatible with: Forex, Stocks, Crypto, Futures
How Traders Use This
Technical Analysts - Export clean datasets for external analysis.
Backtesters - Quickly gather historical price data for strategy development.
Researchers - Study candlestick patterns with precise numerical data.
Grid Level Visualizer v1.0Overview
This indicator draws a customizable grid of horizontal price levels directly on your chart. It's designed to help traders visualize potential support and resistance zones, manage grid trading strategies, or simply divide a price range into equal segments. The script offers interactive controls, extensive customization options, and alert functionality.
Key Features:
Customizable Grid: Draws a grid based on user-defined Upper Price Bound and Lower Price Bound.
Interactive Bounds: Easily adjust the Upper and Lower bounds by dragging the corresponding lines directly on the chart (click the line first to select, then drag). Bounds can also be set numerically in the settings.
Adjustable Levels: Specify the total number of horizontal lines in the grid (Number of Grid Levels), including bounds.
Custom Styling: Independently configure the color, width, and style (Solid, Dashed, Dotted) for the boundary lines and the intermediate grid lines.
Price Labels: Optional display of price values for each grid level, positioned on the right side near the current bar.
Labels for boundary levels automatically inherit the boundary line colors.
Adjustable horizontal offset (Price Label Offset (X)) for labels.
Customizable text size (Text Size) and color (Price Text Color (Mid)) for mid-levels.
Grid Start Time: Define a specific date and time (Grid Start Time) from which the grid lines should start appearing on the chart (defaults to the beginning of the current month).
Line Extension: Grid lines automatically extend to the right margin of the chart.
Alert Condition: Provides a "Grid Level Cross" condition for creating custom alerts when price crosses any active grid level.
Alert Toggle: An option (Enable Alert Condition?) in the settings to enable or disable the availability of the "Grid Level Cross" condition when creating alerts.
Real-time Calculation: Uses calc_on_every_tick=true for responsive alert checking against the current price.
How to Use:
Add the "Improved Grid Level Visualizer" indicator to your chart.
Set Bounds: Adjust the Upper Price Bound and Lower Price Bound lines by clicking and dragging them on the chart, or set precise values in the indicator settings.
Set Levels: Define the Number of Grid Levels you need in the settings.
Set Start Time: Use the Grid Start Time input to control when the grid visualization begins.
Customize: Configure colors, line styles, label visibility, etc., in the settings panel.
Set Alerts (Optional): Follow the steps below.
Notes:
The grid levels are calculated purely based on the mathematical division of the specified price range. They do not automatically adapt to market structure unless you manually adjust the bounds.
When changing the Grid Start Time after the indicator has been running, you might need to refresh the chart or remove/re-add the indicator for the visual starting point to update correctly.
zigzag all timeThe indicator is applicable across all timeframes, meaning it can be used for short-term (e.g., minutes, hours) or long-term (e.g., days, weeks, months) trading strategies. This ensures that the analysis is versatile and adaptable to different trading styles.

Prior LevelThe "Prior Level" indicator displays the previous day's key price levels (Open, High, Low, Close) directly on your chart. These reference levels are essential for intraday trading strategies, support/resistance analysis, and breakout identification.
Key features:
- Shows previous session's Open, High, Low and Close values
- Customizable line colors for better visual distinction
- Adjustable line length for cleaner chart appearance
- Optional data table showing exact values
- Simple and lightweight design for easy chart reading
This indicator helps traders identify important price zones from the previous trading session, allowing for more informed trading decisions based on how current price action interacts with these established levels.
