Volume Range Profile with Fair Value (SWAROOPRAM29)This indicator overlays a custom volume profile across two dynamic price zones (upper and lower) within a defined lookback range. It highlights the Point of Control (POC) for each zone — the price level with the highest traded volume — and tracks its movement over time to help identify fair value areas.
🔍 Features:
Dynamic Volume Zones: Automatically calculates upper/lower zones based on a % of the high-low range.
Granular Volume Distribution: Visualizes buy/sell volume using histogram bins inside each zone.
Point of Control (POC): Shows the most active volume bin with optional percentage breakdown (Buy %, Sell %, Total).
Fair Value Drift Line: Plots a moving average of POC to track fair value shifts.
Total Volume Labels: Optionally display total buy/sell volume in each zone.
Trade Entry Logic (Strategy):
Entry on POC touch or midline level.
Supports long, short, or both directions.
Customizable take profit and stop loss levels.
This tool helps traders spot high-volume price acceptance areas, potential reversals, and trend continuations based on volume-weighted logic — ideal for scalping, swing, and volume-based strategies.
brings Smart Money Concept (ICT) session logic to life by plotting key global trading sessions with volume and delta analytics. It not only highlights session ranges but also tracks their midpoints — which often act as intraday support/resistance levels.
KEY FEATURES
Visual session boxes: Plots boxes for Tokyo, London, New York, and Sydney sessions based on user-defined UTC+0 time ranges.
Volume & delta metrics: Displays total volume and delta volume (buy–sell difference) within each session.
Mid, High & Low Range Extension: Once a session ends, the high, low, and midpoint levels automatically extend — ideal for detecting SR zones.
Session labels: Each box includes a label with session name, time, volume, and delta for quick reference.
Custom session control: Enable or disable sessions individually and configure start/end times.
Clean aesthetics: Transparent shaded boxes with subtle borders make it easy to overlay without clutter.
Sessions Dashboard: Shows the time range of each session and tells you whether the session is currently active.
🔵 USAGE
Enable the sessions you want to monitor (e.g., New York or Tokyo) from the settings.
Use session volume and delta values to gauge the strength and direction of institutional activity.
Watch for price interaction with the extended range — it often acts as dynamic support/resistance after the session ends.
Overlay it with liquidity tools or breaker blocks for intraday strategy alignment.
🔵 EXAMPLES
Extended Future Range acted as resistance/support.
Индикаторы и стратегии

SignalCore Widodo Budi v1.0SignalCore Widodo Budi v1.0 is an all-in-one breakout and trend signal suite, designed to help traders detect high-probability trade setups using a fusion of price action, momentum, and volume.
✅ Combines breakout & breakdown detection using:
Donchian Channel (20)
Moving Averages (SMA 20 & 50)
MACD momentum confirmation
Volume spike detection
ADX trend strength
Heikin Ashi trend filter
🧠 Additional tools:
Conditional Stochastic %K/%D
RSI (Overbought/Oversold levels)
ADX visual + DI+/DI- alerts
Auto labels for breakout and pre-breakdown levels
🔔 Built-in alerts:
Breakout & Pre-Breakout
Breakdown & Pre-Breakdown
RSI signals
Stochastic crossovers
ADX directional strength
🎯 Best used on liquid instruments with defined ranges or trending behavior. Suitable for swing traders, momentum traders, and intraday scalpers alike.
Created by: Widodo Budi, 2025
Version: v1.0

VPSRVP Sovereign Reign (VPSR) - Advanced Volume Profile Analysis
A sophisticated volume analysis tool that provides deep insights into market participation and momentum through an intuitive visual interface. This indicator helps traders identify significant market moves, potential reversals, and institutional activity.
Key Features:
1. Smart Volume Analysis
• Dynamic volume profiling
• Institutional participation detection
• Abnormal volume identification
• Real-time momentum tracking
2. Advanced Visual System
• Color-coded volume bars
• Adaptive cloud formation
• Reversal pattern detection
• Fake-out warning system
Visual Components:
1. Volume Bars
• Green: Bullish pressure with normal volume
• Purple: Bearish pressure with normal volume
• White: Significant bullish participation
• Pink: Significant bearish participation
• Orange: High-probability reversal zones
2. Dynamic Cloud
• White Cloud: Bullish control zone
• Purple Cloud: Bearish control zone
• Cloud density indicates participation strength
• Adaptive to market conditions
Signal Interpretation:
1. Normal Market Conditions
• Green/Purple bars show directional pressure
• Cloud color indicates dominant force
• Cloud height shows average participation
2. Significant Events
• White/Pink bars signal major moves
• Orange bars highlight potential reversals
• Cloud expansion shows increasing activity
• Cloud contraction indicates consolidation
Customization Options:
• Volume MA Length: Smoothing factor
• Abnormal Volume Threshold: Sensitivity
• Cloud Display: Toggle visualization
• Color scheme optimization
Best Practices:
1. Multiple Timeframe Analysis
• Start with higher timeframes
• Confirm on lower timeframes
• Watch for confluence
2. Volume Analysis
• Compare to historical levels
• Monitor abnormal spikes
• Track participation trends
3. Trade Management
• Use as confirmation tool
• Wait for clear signals
• Monitor fake-out warnings
• Combine with price action
Trading Applications:
1. Trend Analysis
• Identify strong moves
• Spot weakening trends
• Detect consolidation
2. Reversal Detection
• Spot potential turning points
• Identify fake-outs
• Monitor institutional activity
3. Risk Management
• Volume-based position sizing
• Stop loss placement
• Profit target selection
The VP Sovereign Reign indicator excels at:
• Identifying significant market moves
• Detecting institutional participation
• Warning of potential reversals
• Highlighting fake-outs
• Providing clear market context
Risk Warning:
This indicator is designed as a technical analysis tool and should be used as part of a complete trading strategy. Past performance does not guarantee future results. Always employ proper risk management techniques.
Note: For optimal results, use in conjunction with price action analysis and other complementary indicators.

3 EMAs w G/D Cross// This script plots three Exponential Moving Averages (EMAs): 20, 50, and 200.
// It highlights key trend signals by detecting:
// 🔹 Golden Cross – when the 50 EMA crosses above the 200 EMA (bullish signal)
// 🔹 Death Cross – when the 50 EMA crosses below the 200 EMA (bearish signal)
//
// A green cross will appear above the bar for a Golden Cross,
// and a red cross will appear below the bar for a Death Cross.
//
// These crossovers are commonly used to identify long-term trend shifts in the market.
// Suitable for trend-following strategies and identifying entry/exit zones.
//
// Script developed for educational and analytical use on TradingView. bu BusMart

VWAP + EMAs + 3-Min Crossover Arrows + Volume Pulseadjust to your colors that you want the emas to be and use with key levels. i use this on the 5 min chart
this marks the emas and lets you know when there is increasing volume and when there is a bullish or bearish cross over happening which is based on

🔍 Phat hien Spring Wyckoff (hien thi sau 1 nen)//@version=5
indicator("🔍 Phat hien Spring Wyckoff (hien thi sau 1 nen)", overlay=true)
// === Tham so nguoi dung ===
lookbackSupport = input.int(50, "Tim ho tro trong X nen", minval=5)
volumeLookback = input.int(20, "So nen tinh volume trung binh", minval=1)
volMultiplier = input.float(1.5, "Nguong volume cao bat thuong", step=0.1)
showSupportLine = input.bool(true, "Hien thi duong ho tro")
// === Tim day gan nhat lam ho tro ===
lowestLow = ta.lowest(low, lookbackSupport)
// === Tinh volume trung binh ===
avgVol = ta.sma(volume, volumeLookback)
// === Dieu kien Spring (o cay nen hien tai) ===
isSpringNow = low < lowestLow and close > lowestLow and volume > avgVol * volMultiplier
// === Tri hoan tin hieu 1 nen de hien thi chu o cay ke tiep ===
isSpringPrev = isSpringNow
// === Hien thi chu "Spring" o cay nen ke tiep ===
plotshape(isSpringPrev, style=shape.labelup, location=location.belowbar, color=color.green, size=size.small, text="Spring", textcolor=color.white)
// === Ve duong ho tro mau tim, dam ===
plot(showSupportLine ? lowestLow : na, title="Ho tro", color=color.purple, linewidth=2, style=plot.style_line)

Outside Engulfing BarsOutside Engulfing candles if used in the right context can be used for profitable entries.

Highlight Candle Body ≤ X Ticks (Customizable)🟠 Indicator Name: Highlight Candle Body ≤ X Ticks (Customizable)
Purpose:
Highlights candles where the body size (|open - close|) is less than or equal to a user-defined number of ticks — useful for spotting low-momentum or indecision candles across different futures instruments.
Features:
✅ Works with any instrument (CL, NG, HG, etc.)
🔧 Customizable tick size and max tick count
🎨 Adjustable highlight color
📏 Only measures the candle body, ignoring wicks
Use case:
Quickly identifies small-body candles that may signal pauses, traps, or setups before potential moves — especially helpful in volume-based or structure-based trading strategies.


AstraeaAi IndicatorBinary Options Indicator
The indicator is based on the MACD, it gives short positions on a 1-minute timeframe for 4 minutes of the transaction, on a 30c timeframe for 2 minutes of the transaction.

StochDL 355This is a Stochastic indicator marking Regular and Hidden Divergence which I liked from the script of Dev Lucem who called his indicator "Plain Stochastic Divergence". I call this indicator StochDL to give Dev Lucem credit for his original contribution. I noticed in his original script that the %K and %D calculation could be improved which I changed to be: period K and period D should be calculated to be %K. Then smooth K and %K should be smoothed to get %D.
His script nicely identifies regular and hidden divergence for %K. However, I then added script to also identify regular and hidden divergence for %D. The "top Spot" and "Bottom Spot" mark when the divergence is complete. It is not my intention to claim that I solely generated this indicator, however, I have altered and added content to make this indicator unique from the original.
I use these arrows for to alert me that there is divergence. I then use other indicators to confirm a change of trend has taken place.

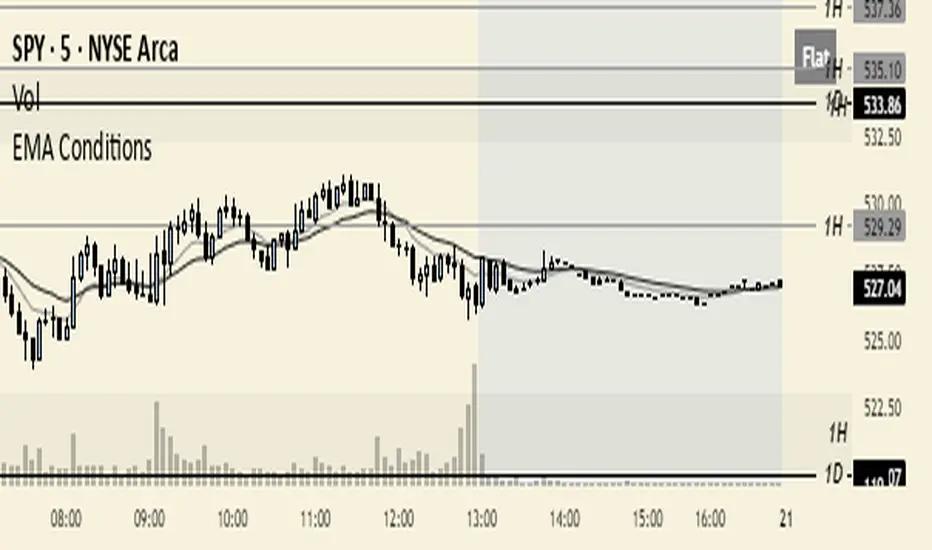
EMA ConditionsThis indicator was developed with the intention to display current market conditions according to the EMAs. There's a little box in the top right to display the conditions. I wanted to design something that shows already established market conditions, which is why I chose to use EMAs and candle closes as the source for identifying market conditions.
Personally, I scalp momentum in trending market conditions, so having an already established trend lets me know when it's appropriate for me to apply my edge on my lower time frame. I use a 5m time frame for my setups and this is where I apply this indicator. I designed the indicator to function off any time frame, so you can use this indicator with whatever time frame you want.
There are 5 conditions that I've set in place for this indicator, they're as follows:
1. Bullish conditions are met when price has closed 3+ consecutive candles over both EMAs (9 and 20 EMAs by default, but you can also choose what EMAs you want).
2. Bearish conditions are met when price has closed 3+ consecutive candles below both EMAs.
3. Reversal conditions are met when EMAs have crossed, and it will show those reversal conditions for the following 4 bars after the EMA cross over has taken place. Once there have been 4 bars closed, it will then show whatever condition is currently present.
4. Wait conditions are met when price is above/below (depending on direction of trend) the 9 ema.
- So in a bull trend, if price is below the 9 ema, it'll show "Wait"
5. Flat conditions are met when both EMAs are showing minimal changes in value over a specified number of candles. This indicates that EMAs are moving sideways and volatility is low. Likely in range bound or chop environments.
- The Flat threshold is adjustable. I have it set to 0.03% with a candle look back of 2 bars. This works the best for my edge, but you can set them to what you want.
The Flat and Wait conditions will override all other conditions. The Reversal conditions will override both Bullish and Bearish conditions. This way, when the indicator is showing Bullish or Bearish conditions, you'll know that nothing else is present.
Since I only trade in trending market conditions, I only trade when Bullish or Bearish conditions are met. If anything else is there then I'm not looking for my setups at that time. But you can use this however you'd like. If you like trading ranges, then trade when EMAs show flat. If you want to fade reversals and trade mean reversion, wait for a reversal condition to show and then look to fade that move. Get creative with it and with your edge. Don't put yourself in a box.
This indicator was made using Grok AI since I have no clue how to write code. I'll make the script available for everyone, so you can make adjustments yourself and do your own thing with it if you want.
If you have any questions or suggestions on how to improve the indicator, feel free to contact me on X: x.com

EMA6–EMA18 Trend Signal SystemThis is a dual-timeframe trend-following indicator designed for intraday traders.
It combines exponential moving averages (EMAs) from two timeframes:
1-hour EMA6 and EMA18 are used to define the major trend direction.
If EMA6 > EMA18 on the hourly chart, the background turns green (indicating an uptrend).
If EMA6 < EMA18, the background turns red (indicating a downtrend).
Entry signals are triggered only on the 15-minute chart:
A long signal appears when EMA6 crosses above EMA18 during an hourly uptrend.
A short signal appears when EMA6 crosses below EMA18 during an hourly downtrend.
Signal arrows are plotted directly on the chart:
Green triangle up = Long signal
Red triangle down = Short signal
Both EMA6 and EMA18 are plotted for visual reference.
This setup helps align lower timeframe entries with higher timeframe trend confirmation, offering traders more precise entry points and reducing noise.
—
The script is intended for use on 15-minute charts and works best in trending markets.
© All rights reserved. Author: hank552

Nifty in USD//@version=5
indicator("Nifty in USD", overlay=true)
plot(close / request.security("FX_IDC:USDINR", timeframe.period, close), color=color.orange, title="Nifty/USD")

First 5-Min Candle Targetssquare root of first five minute candle closing price and target of 45 deg

Nasan Market Phase ClassifierThe Nasan Market Phase Classifier indicator designed to classify market phases using volume, volatility (or momentum), and statistical analysis. Here's a summary of how it works and what it does:
🔍 Core Concept
This indicator classifies the market into four phases based on volume and ATR (or optionally momentum):
High Volume / High ATR or Momentum (HV/HATR): Strong Trend
Low Volume / High ATR or Momentum (LV/HATR): False Breakout / Exhaustion
High Volume / Low ATR or Momentum (HV/LATR): Consolidation
Low Volume / Low ATR or Momentum (LV/LATR): Stagnation
⚙️ Key Settings
Short-Term Length: Used for the active market phase.
Long-Term Length: Used as the expected/benchmark distribution.
Use Momentum: Replaces volatility (ATR) with momentum (custom ROC-based formula).
Use Fixed Alpha: Toggles adaptive vs. fixed weighting in scoring (this is based on variation of the volatility - standard deviation of true range).
📊 How It Works
Volatility or Momentum Scoring:
Uses ATR-based or Momentum-based score depending on the setting.
Applies weighing (alpha) which is based on variability of the volatility itself.
Market Phase Count:
Measures how often each of the 4 volume/volatility combinations occur in:
Short-term window (observed phase)
Long-term window (expected distribution)
Category Proportions:
Calculates percentage share of each category (e.g., % time in HV/HATR).
Plots these on chart to visually see market phase dominance (can be used for screening of pine screener).
Statistical Testing:
IQV (Index of Qualitative Variation): Measures phase diversity (0 = focused, 1 = mixed).
Chi-Squared Test: Compares current vs. historical phase distribution.
Z-Test: Tests if current phase dominance is statistically significant.
📋 Outputs
On-Chart Plots and Tabels:
Strong Trend, False Breakout/Exhaustion, Consolidation, Stagnation
Strength Quality Plot: Trend strength normalized by IQV.
Dynamic Table (Top Right):
Shows each phase’s proportion (the current phase cell is highlighted in yellow), IQV, Chi² value, and current dominant phase. The current candle classification (text) is in purple.
Highlights the dominant phase classification and color-codes significance (the cell highlighted in green highly confident about the classification, orange intermediate confidence and red low confidence). This color coding is not just based on statistical significance it is based on IQV which takes into account how spread the proportions are.
🧠 Interpretation
A dominant HV/HATR phase with low IQV and high Z-Score indicates a strong and statistically significant trend.
High IQV suggests uncertainty or mixed market behavior.
Chi² spike indicates a shift from historical behavior can be used to see is the market behavior changing by changing the long term length say to 252 and short term length to 21 this will tell if the short term behavior is different from the past 252 day behavior.

MACD + VWAP Strategy (6–9 PM & 7–8:30 AM EST)//@version=5
strategy("MACD + VWAP Strategy (6–9 PM & 7–8:30 AM EST)", overlay=true, default_qty_type=strategy.percent_of_equity, default_qty_value=100)
// === Inputs ===
macdFast = input.int(12, title="MACD Fast Length")
macdSlow = input.int(26, title="MACD Slow Length")
macdSignal = input.int(9, title="MACD Signal Length")
stopLossPts = input.float(10, title="Stop Loss (pts)")
takeProfitPts = input.float(25, title="Take Profit (pts)")
// === Indicators ===
= ta.macd(close, macdFast, macdSlow, macdSignal)
vwapLine = ta.vwap(close)
atrVal = ta.atr(14)
// === Time Filter ===
t = time("America/New_York")
hourEST = hour(t)
minuteEST = minute(t)
eveningSession = hourEST >= 18 and hourEST < 21 // 6:00 PM to 9:00 PM
morningSession = (hourEST == 7) or (hourEST == 8 and minuteEST < 30) // 7:00–8:30 AM
inSession = eveningSession or morningSession
// === Entry Conditions with Session Filter ===
longCondition = ta.crossover(macdLine, signalLine) and close > vwapLine and atrVal > 1.2 and inSession
shortCondition = ta.crossunder(macdLine, signalLine) and close < vwapLine and atrVal > 1.2 and inSession
if (longCondition)
strategy.entry("Long", strategy.long)
if (shortCondition)
strategy.entry("Short", strategy.short)
// === Exit Conditions ===
exitLong = ta.crossunder(macdLine, signalLine)
exitShort = ta.crossover(macdLine, signalLine)
if (exitLong)
strategy.close("Long")
if (exitShort)
strategy.close("Short")
// === Risk Management ===
strategy.exit("TP/SL Long", from_entry="Long", limit=close + takeProfitPts, stop=close - stopLossPts)
strategy.exit("TP/SL Short", from_entry="Short", limit=close - takeProfitPts, stop=close + stopLossPts)
// === Plotting ===
plot(vwapLine, title="VWAP", color=color.orange, linewidth=2)
// === Visuals ===
plotshape(longCondition, title="Long Entry", location=location.belowbar, color=color.green, style=shape.arrowup, size=size.small)
plotshape(shortCondition, title="Short Entry", location=location.abovebar, color=color.red, style=shape.arrowdown, size=size.small)
bgcolor(strategy.position_size > 0 ? color.new(color.green, 85) : na)
bgcolor(strategy.position_size < 0 ? color.new(color.red, 85) : na)

[Forexroboot super scalper v1]this indicator trade on crypto and forex
trade on any time frame
enjoyed
ins: Forexroboot

[Forexroboot super scalper v1]this indicator trade on crypto and forex
trade on any time frame
enjoyed
ins: Forexroboot

Prior Day HL MidPlots the High, Low and Midpoint of any prior daily candle right on your chart.
Just pick “Days Back” (1, 2, 3, etc.), customize your colors, and see yesterday’s (or n‑days‑ago) range and midpoint in real time.

Multi TF table by marci04This indicator analyzes the relationship between price and multiple EMAs (12, 21, 50, 100, 200) across several timeframes to determine trend direction. It displays the trend on each timeframe as "STRONG UP", "UP", "DOWN", or "STRONG DOWN" in a color-coded table. At the bottom, a "Magic Number" summarizes the overall trend strength by assigning weighted values to each trend and calculating their total.

Multi-Timeframe EMA Signal - StyledTrend reminder, what is based on the 39 MA. Looking after 14 CLOSED candles. The minute TF is calculated from the 1m chart, the 1H, 4h, 1D is calculated from the 1h TF.
If you go higher on the minute TF you see that the calculation goes bad, so you dont see the minute TF-s trend if you are on the 5m or on the 15M or higher TF. It's ok for my needs i usualy trade on the 1m chart so i see everything.
It's simple.
I was looking for a srcipt like this, and did not find anything.
It's not my work, its Veronika's script from chatGPT based on my needs. :)
