SMC Trade Setup v2Feature | Change
✅ Less Noise | Limits markers to last N bars
✅ Toggle Visibility | On/Off for BOS/CHOCH/MSS/OB
✅ Clear Visuals | Separate shape + color for each signal
✅ Simple OB Logic | Only draws OB where body confirms intent
✅ No Box Overlap | Removed overlapping zone issues
✅ HTF Bias Detection
🔄 BOS, CHOCH, MSS Detection
🧱 Order Block Marking
💧 Liquidity Zones
🟢 Entry Signals (based on CHOCH + OB retest)
🔴 Exit Zones (TP/SL suggestions)
Индикаторы и стратегии

📊 Wyckoff - Spring + UT + Khang cu//@version=5
indicator("📊 Wyckoff - Spring + UT + Khang cu", overlay=true)
// === Tham so nguoi dung ===
lookback = input.int(50, "Tim ho tro/khang cu trong X nen", minval=5)
rangePerc = input.float(0.005, "Nguong gan ho tro/khang cu (%)", step=0.001)
volMultiplier = input.float(1.5, "Nguong Volume cao", step=0.1)
wickRatio = input.float(2.0, "Ty le bong/than", step=0.1)
avgVolLength = input.int(20, "So nen tinh volume trung binh", minval=1)
showLabel = input.bool(true, "Hien thi nhan")
showResLine = input.bool(true, "Hien thi duong khang cu")
// === Tinh toan volume va vung gia ===
avgVol = ta.sma(volume, avgVolLength)
resistance = ta.highest(high, lookback)
support = ta.lowest(low, lookback)
candleBody = math.abs(close - open)
upperWick = high - math.max(open, close)
lowerWick = math.min(open, close) - low
// === Phat hien UpThrust (UT) ===
isNearRes = high >= resistance * (1 - rangePerc)
isUT = upperWick > wickRatio * candleBody and close < open and volume > avgVol * volMultiplier and isNearRes
// === Phat hien Spring ===
isNearSup = low <= support * (1 + rangePerc)
isSpring = lowerWick > wickRatio * candleBody and close > open and volume > avgVol * volMultiplier and isNearSup
// === Hien thi nhan tren bieu do ===
plotshape(isUT and showLabel, title="UT", location=location.abovebar, color=color.red, style=shape.labeldown, text="UT", textcolor=color.white)
plotshape(isSpring and showLabel, title="Spring", location=location.belowbar, color=color.green, style=shape.labelup, text="Spring", textcolor=color.white)
// === To mau nen: do cho UT + Spring, xam cho nen khac ===
barcolor(isUT or isSpring ? color.rgb(255, 0, 0) : color.new(color.gray, 60))
// === Ve duong khang cu ===
var line resLine = na
if (showResLine)
if na(resLine)
resLine := line.new(x1=bar_index, y1=resistance, x2=bar_index + 1, y2=resistance, extend=extend.right, color=color.orange, style=line.style_dashed)
else
line.set_xy1(resLine, bar_index, resistance)
line.set_xy2(resLine, bar_index + 1, resistance)

Change of Character FanChange of Character Fan
Overview
The Change of Character Fan is designed to help traders detect shifts (changes of character) in market direction and sentiment before they become fully visible through traditional candlestick analysis. Instead of relying solely on the shape or close of candlesticks, this indicator offers a direct, real-time look at the internal price action occurring within a single bar. This visibility into intrabar dynamics can potentially allow traders to enter or exit trades earlier, minimize false signals, and reduce their dependence on multiple lower-timeframe charts.
How it Works:
The indicator plots a "fan" consisting of five distinct slope lines within the current bar. Each line represents the internal trend of price movement based on user-defined lower timeframe data intervals.
By default, these intervals are set to 3, 5, 8, 13, and 21 samples from 1-second timeframe data.
Each line only appears when it has collected the minimum required number of intrabar data points.
The fan lines use a progressive opacity scale (lighter to darker), visually highlighting the confidence level or probability of directional continuation within the current bar.
At the open of every new bar, the fan disappears completely and gradually reappears as new data is gathered, ensuring clarity and eliminating outdated signals.
Understanding the Mathematics: Linear Regression Model
This indicator is built around the concept of a linear regression model. Linear regression is a statistical technique used to model and analyze relationships between variables—in this case, time (independent variable) and price (dependent variable).
How Linear Regression Works:
Linear regression fits a straight line (called a "line of best fit") through a set of data points, minimizing the overall distance between each point and the line itself.
Mathematically, this is achieved by minimizing the squared differences (errors) between the observed values (actual prices) and the predicted values (prices on the line).
The linear model used here can be expressed in the form:
y = mx + b
where:
𝑦
y is the predicted price,
𝑥
x represents time (each data sample interval),
𝑚
m is the slope of the line, representing the direction and velocity of the trend,
𝑏
b is the intercept (the theoretical price when x=0).
Why a Linear Model is Beneficial in this Indicator:
Simplicity and Reliability: Linear regression is simple, robust, and widely accepted as a baseline predictive model. It requires minimal computational resources, providing instant updates in real-time trading conditions.
Immediate Directional Feedback: The slope derived from linear regression immediately communicates the directional tendency of recent price action. A positive slope indicates upward pressure, and a negative slope signals downward pressure.
Noise Reduction: Even when price fluctuations are noisy or erratic, linear regression summarizes overall direction clearly, making it easier to detect genuine directional shifts (change of character) rather than random price noise.
Intrabar Analysis: Traditional candlestick analysis relies on fully formed candles, potentially delaying signals. By using linear regression on very short-term (intrabar) data, traders can detect shifts in momentum more quickly, providing an earlier signal than conventional candle patterns alone.
Practical Application:
This indicator helps traders to visually identify:
Early Trend Reversals: Intrabar analysis reveals momentum shifts potentially signaling reversals before they become obvious on conventional candles.
Momentum Continuations: Confidence is gained when all lines in the fan are clearly pointing in the same direction, indicating strong intrabar conviction.
Reduced False Signals: Traditional candlestick signals (e.g., hammer candles) sometimes produce false signals due to intrabar noise. By looking directly into intrabar dynamics, traders gain better context on whether candle patterns reflect genuine directional change or merely noise.
Important Requirements and Recommendations:
Subscription Requirements:
A TradingView subscription that supports sub-minute data (e.g., 1-second or 5-second resolution) is strongly recommended.
If your subscription doesn't include this data granularity, you must use a 1-minute lower timeframe, significantly reducing responsiveness. In this scenario, it's best suited for a 15-minute or higher chart, adjusting intervals to shorter periods.
Live Data Essential:
Real-time market data subscription is essential for the accuracy and effectiveness of this indicator.
Using delayed data reduces responsiveness and weakens the indicator's primary advantage.
Recommended Settings for Different Chart Timeframes:
1-minute chart: Use 1-second lower timeframe intervals (default intervals: 3, 5, 8, 13, 21).
5-minute chart: Adjust to a 5- or 10-second lower timeframe, possibly reducing intervals to shorter periods (e.g., 3, 5, 8, 10, 12).
15-minute or higher charts: Adjust lower timeframe to 1-minute if granular data is unavailable, with reduced interval lengths to maintain responsiveness.
Conclusion:
The Change of Character Fan empowers traders with early insight into directional shifts within each candle, significantly enhancing reaction speed, signal accuracy, and reducing dependency on multiple charts. Built on robust linear regression mathematics, it combines clarity, responsiveness, and ease-of-use in a powerful intrabar analysis tool.
Trade smarter, see sooner, and react faster.

Z-Score IndicatorZ-score of price with extreme bands set by a multiplier. Colors background and triggers alarm whenever price is at +mult/-mult Z-score. Usually 2/-2.
Useful to get you at the charts when action is happening


Estrategia EMAs + RSI + MACD con SL y TPestrategia para enlazar con bitget. en pruebas para saber si es rentable

Volume Range Profile with Fair Value (Zeiierman)// This work is licensed under a Attribution-NonCommercial-ShareAlike 4.0 International (CC BY-NC-SA 4.0) creativecommons.org
// © Zeiierman {
//@version=6
indicator("Volume Range Profile with Fair Value (Zeiierman)", overlay=true, max_boxes_count=200, max_lines_count=10, max_labels_count=10)
//~~}
//~~ Tooltips for Inputs {
var string t1 = "Defines how many historical bars to consider when calculating the highest high and lowest low for the volume range zones. A larger value creates broader zones and more stable volume profiles, while a smaller value reacts quicker to price shifts."
var string t2 = "Controls how much of the full price range (from high to low) is allocated for the volume zones. A smaller value makes zones narrower and more focused on extremes; a higher value widens the zones to capture more volume."
var string t3 = "Sets the number of horizontal volume bins in each zone. More bins give finer granularity, while fewer bins make the volume histogram more generalized. Increasing too much may impact performance."
var string t4 = "Color used to fill the upper (typically sell) volume zone background. Lower transparency means stronger visual emphasis."
var string t5 = "Color used to fill the lower (typically buy) volume zone background. Adjust transparency to make it more or less visible against chart elements."
var string t6 = "Color used for the most active bin (POC – Point of Control). This bin represents where the most volume was traded within the zone."
var string t7 = "Toggle to display a dashed midline inside each volume zone. Helps visually separate the upper and lower halves of each zone."
var string t8 = "Color for the zone midlines. A more visible color helps with separation, especially on dark or noisy charts."
var string t9 = "When enabled, adds a label showing the percentage of total zone volume that occurred inside the POC bin."
var string t10 = "When enabled, displays labels showing the total Buy or Sell volume accumulated in each respective zone. Useful for reading directional volume pressure directly on the chart."
//~~~~~~~~~~~~~~~~~~~~~~~~~~~~~~~~~~~~~~~~~~~~~~~~~~~~~~~~~~~~~~~~~~~~~~~~~~~~~~~~~~~~~~~~~~~~~~~~~~~~~~~~~~~~~~~~~~~~~}
// ~~ Inputs {
len = input.int(100, "Lookback Period", minval=2, group="Period & Zones", tooltip=t1)
zoneP = input.float(30.0, "Zone Width (% of Range)", minval=1, maxval=50, step=0.5, group="Period & Zones", tooltip=t2)
bins = input.int(10, "Bins per Zone", minval=1, maxval=50, group="Volume Profile", tooltip=t3)
clrUp = input.color(color.new(color.red, 80), "Upper Zone Color", group="Visuals", tooltip=t4)
clrLo = input.color(color.new(color.lime, 80), "Lower Zone Color", group="Visuals", tooltip=t5)
clrPOC = input.color(color.new(color.white, 0), "POC Bin Color", group="Visuals", tooltip=t6)
showMid = input.bool(true, "Show Zone Midline", group="Visuals", tooltip=t7)
clrMid = input.color(color.new(color.orange, 0), "Midline Color", group="Visuals", tooltip=t8)
showPOClbl = input.bool(true, "Show POC % Label", group="Visuals", tooltip=t9)
showTotlbl = input.bool(true, "Show Total Vol Label", group="Visuals", tooltip=t10)
lblClr = color.white
//~~~~~~~~~~~~~~~~~~~~~~~~~~~~~~~~~~~~~~~~~~~~~~~~~~~~~~~~~~~~~~~~~~~~~~~~~~~~~~~~~~~~~~~~~~~~~~~~~~~~~~~~~~~~~~~~~~~~~}
// ~~ Globals {
var array allBoxes = array.new_box(0)
var array allLines = array.new_line(0)
var array allLabels = array.new_label(0)
//~~~~~~~~~~~~~~~~~~~~~~~~~~~~~~~~~~~~~~~~~~~~~~~~~~~~~~~~~~~~~~~~~~~~~~~~~~~~~~~~~~~~~~~~~~~~~~~~~~~~~~~~~~~~~~~~~~~~~}
// ~~ Helpers {
f_formatVol(_v) =>
suf = ""
x = _v
if _v >= 1e9
suf := "B"
x := _v / 1e9
else if _v >= 1e6
suf := "M"
x := _v / 1e6
else if _v >= 1e3
suf := "K"
x := _v / 1e3
str.format("{0,number,#.###}{1}", x, suf)
f_clearDrawings() =>
for b in allBoxes
box.delete(b)
array.clear(allBoxes)
for l in allLines
line.delete(l)
array.clear(allLines)
for lb in allLabels
label.delete(lb)
array.clear(allLabels)
//~~~~~~~~~~~~~~~~~~~~~~~~~~~~~~~~~~~~~~~~~~~~~~~~~~~~~~~~~~~~~~~~~~~~~~~~~~~~~~~~~~~~~~~~~~~~~~~~~~~~~~~~~~~~~~~~~~~~~}
// ~~ Zone calculation with distributed volume + buy/sell per bin {
f_zone() =>
hh = ta.highest(high, len)
ll = ta.lowest( low, len)
rng = hh - ll
zh = rng * zoneP / 100
ut = hh
ub = hh - zh
lt = ll + zh
lbz = ll
bs = zh / bins
volsU = array.new_float(bins, 0.0)
volsL = array.new_float(bins, 0.0)
buyU = array.new_float(bins, 0.0)
sellU = array.new_float(bins, 0.0)
buyL = array.new_float(bins, 0.0)
sellL = array.new_float(bins, 0.0)
totU = 0.0
totL = 0.0
for i = 0 to len - 1
bh = high
bl = low
v = volume
isBuy = close >= open
// Upper zone overlap
if bh >= ub and bl <= ut
br = bh - bl
if br <= syminfo.mintick
price = hl2
if price >= ub and price <= ut
j = math.floor((ut - price) / bs)
j := math.min(math.max(j, 0), bins - 1)
array.set(volsU, j, array.get(volsU, j) + v)
if isBuy
array.set(buyU, j, array.get(buyU, j) + v)
else
array.set(sellU, j, array.get(sellU, j) + v)
totU := totU + v
else
for j = 0 to bins - 1
binT = ut - j * bs
binB = binT - bs
ov = math.min(bh, binT) - math.max(bl, binB)
if ov > 0
frac = ov / br
cvol = v * frac
array.set(volsU, j, array.get(volsU, j) + cvol)
if isBuy
array.set(buyU, j, array.get(buyU, j) + cvol)
else
array.set(sellU, j, array.get(sellU, j) + cvol)
totU := totU + cvol
// Lower zone overlap
if bh >= lbz and bl <= lt
br2 = bh - bl
if br2 <= syminfo.mintick
price = hl2
if price >= lbz and price <= lt
j2 = math.floor((price - lbz) / bs)
j2 := math.min(math.max(j2, 0), bins - 1)
array.set(volsL, j2, array.get(volsL, j2) + v)
if isBuy
array.set(buyL, j2, array.get(buyL, j2) + v)
else
array.set(sellL, j2, array.get(sellL, j2) + v)
totL := totL + v
else
for j2 = 0 to bins - 1
binB2 = lbz + j2 * bs
binT2 = binB2 + bs
ov2 = math.min(bh, binT2) - math.max(bl, binB2)
if ov2 > 0
frac2 = ov2 / br2
cvol2 = v * frac2
array.set(volsL, j2, array.get(volsL, j2) + cvol2)
if isBuy
array.set(buyL, j2, array.get(buyL, j2) + cvol2)
else
array.set(sellL, j2, array.get(sellL, j2) + cvol2)
totL := totL + cvol2
pocU = 0
pocL = 0
maxU = 0.0
maxL = 0.0
for j = 0 to bins - 1
u = array.get(volsU, j)
l = array.get(volsL, j)
if u > maxU
maxU := u
pocU := j
if l > maxL
maxL := l
pocL := j
//~~~~~~~~~~~~~~~~~~~~~~~~~~~~~~~~~~~~~~~~~~~~~~~~~~~~~~~~~~~~~~~~~~~~~~~~~~~~~~~~~~~~~~~~~~~~~~~~~~~~~~~~~~~~~~~~~~~~~}
// ~~ Main {
f_clearDrawings()
hh = ta.highest(high, len)
ll = ta.lowest( low, len)
if hh - ll <= syminfo.mintick * bins
runtime.error("Range too small")
= f_zone()
startBar = bar_index - len + 1
histW = math.round(len * 0.5)
rightB = startBar - 2
leftB = rightB - histW
zoneEnd = bar_index + 1
//~~~~~~~~~~~~~~~~~~~~~~~~~~~~~~~~~~~~~~~~~~~~~~~~~~~~~~~~~~~~~~~~~~~~~~~~~~~~~~~~~~~~~~~~~~~~~~~~~~~~~~~~~~~~~~~~~~~~~}
// Draw boxes {
bU = box.new(leftB, ut, zoneEnd, ub, border_color=na, bgcolor=clrUp)
bL = box.new(leftB, lt, zoneEnd, lbz, border_color=na, bgcolor=clrLo)
array.push(allBoxes, bU)
array.push(allBoxes, bL)
// Draw upper bins
pocVolU = totU > 0 ? array.get(volsU, pocU) : 0.0
for j = 0 to bins - 1
volj = array.get(volsU, j)
ratio = pocVolU > 0 ? volj / pocVolU : 0.0
wBars = math.max(1, math.ceil(histW * ratio))
x0 = math.max(leftB, rightB - wBars)
yT = ut - j * bs
yB = yT - bs
col = j == pocU ? clrPOC : color.new(clrUp, 50)
b = box.new(x0, yT, rightB, yB, border_color=color.new(color.red,30), bgcolor=col)
array.push(allBoxes, b)
// Draw lower bins
pocVolL = totL > 0 ? array.get(volsL, pocL) : 0.0
for j = 0 to bins - 1
volj = array.get(volsL, j)
ratio = pocVolL > 0 ? volj / pocVolL : 0.0
wBars = math.max(1, math.ceil(histW * ratio))
x0 = math.max(leftB, rightB - wBars)
yB2 = lbz + j * bs
yT2 = yB2 + bs
col2 = j == pocL ? clrPOC : color.new(clrLo, 50)
b2 = box.new(x0, yT2, rightB, yB2, border_color=color.new(color.lime,30), bgcolor=col2)
array.push(allBoxes, b2)
// Midlines
if showMid
mU = (ut + ub) / 2
mL = (lt + lbz) / 2
lnU = line.new(startBar, mU, zoneEnd, mU, color=clrMid, style=line.style_dashed)
lnL = line.new(startBar, mL, zoneEnd, mL, color=clrMid, style=line.style_dashed)
array.push(allLines, lnU)
array.push(allLines, lnL)
//~~~~~~~~~~~~~~~~~~~~~~~~~~~~~~~~~~~~~~~~~~~~~~~~~~~~~~~~~~~~~~~~~~~~~~~~~~~~~~~~~~~~~~~~~~~~~~~~~~~~~~~~~~~~~~~~~~~~~}
// ~~ Draw Total‑Volume Labels {
if showTotlbl
// Upper zone: total Sell volume
totalSellU = array.sum(sellU)
if totalSellU > 0
labU = label.new(
startBar + histW/2, ut + bs,
"Sell Vol: " + f_formatVol(totalSellU),
xloc = xloc.bar_index,
style = label.style_label_center,
color = color.red,
textcolor = color.white,
size = size.normal
)
array.push(allLabels, labU)
// Lower zone: total Buy volume
totalBuyL = array.sum(buyL)
if totalBuyL > 0
labL = label.new(
startBar + histW/2, lbz - bs,
"Buy Vol: " + f_formatVol(totalBuyL),
xloc = xloc.bar_index,
style = label.style_label_center,
color = color.green,
textcolor = color.white,
size = size.normal
)
array.push(allLabels, labL)
//~~~~~~~~~~~~~~~~~~~~~~~~~~~~~~~~~~~~~~~~~~~~~~~~~~~~~~~~~~~~~~~~~~~~~~~~~~~~~~~~~~~~~~~~~~~~~~~~~~~~~~~~~~~~~~~~~~~~~}
// ~~ Draw POC Vol % {
xLab = zoneEnd + 1
// Upper zone POC
if totU > 0
pvU = array.get(volsU, pocU)
bvU = array.get(buyU, pocU)
svU = array.get(sellU, pocU)
buyPctU = pvU > 0 ? bvU / pvU * 100 : 0
sellPctU = pvU > 0 ? svU / pvU * 100 : 0
totalPctU= pvU / totU * 100
txtU = "POC Vol: " +
"Buy " + str.format("{0,number,#.##}%", buyPctU) + " " +
"Sell " + str.format("{0,number,#.##}%", sellPctU) + " " +
"Total " + str.format("{0,number,#.##}%", totalPctU)
colU = buyPctU >= sellPctU ? color.green : color.red
labPOCU = label.new(
xLab, ut - (pocU + 0.5) * bs, txtU,
xloc = xloc.bar_index,
style = label.style_label_left,
color = colU,
textcolor = color.white,
size = size.small
)
array.push(allLabels, labPOCU)
// Lower zone POC
if totL > 0
pvL = array.get(volsL, pocL)
bvL = array.get(buyL, pocL)
svL = array.get(sellL, pocL)
buyPctL = pvL > 0 ? bvL / pvL * 100 : 0
sellPctL = pvL > 0 ? svL / pvL * 100 : 0
totalPctL = pvL / totL * 100
txtL = "POC Vol: " +
"Buy " + str.format("{0,number,#.##}%", buyPctL) + " " +
"Sell " + str.format("{0,number,#.##}%", sellPctL) + " " +
"Total " + str.format("{0,number,#.##}%", totalPctL)
colL = buyPctL >= sellPctL ? color.green : color.red
labPOCL = label.new(
xLab, lbz + (pocL + 0.5) * bs, txtL,
xloc = xloc.bar_index,
style = label.style_label_left,
color = colL,
textcolor = color.white,
size = size.small
)
array.push(allLabels, labPOCL)
//~~~~~~~~~~~~~~~~~~~~~~~~~~~~~~~~~~~~~~~~~~~~~~~~~~~~~~~~~~~~~~~~~~~~~~~~~~~~~~~~~~~~~~~~~~~~~~~~~~~~~~~~~~~~~~~~~~~~~}
// ~~ 6. POC‑volume trend line {
pocPrice = ut - (pocU + 0.5) * bs
avgPocPrice = ta.sma(pocPrice, len)
delta = avgPocPrice - avgPocPrice
lineColor = delta >= 0 ? color.green : color.red
//~~~~~~~~~~~~~~~~~~~~~~~~~~~~~~~~~~~~~~~~~~~~~~~~~~~~~~~~~~~~~~~~~~~~~~~~~~~~~~~~~~~~~~~~~~~~~~~~~~~~~~~~~~~~~~~~~~~~~}
// ~~ Plot {
plot(
avgPocPrice,
title = "Fair value - drifting over time.",
color = lineColor,
linewidth = 1,
style = plot.style_line
)
//~~~~~~~~~~~~~~~~~~~~~~~~~~~~~~~~~~~~~~~~~~~~~~~~~~~~~~~~~~~~~~~~~~~~~~~~~~~~~~~~~~~~~~~~~~~~~~~~~~~~~~~~~~~~~~~~~~~~~}

Chande Composite Momentum Index [LazyBear]This is a Updated Version of the original indikator from lazy bear!
It has added a clear buy signal if the there is a bullish momentum under the -25 Level!
The buy is only confirmed if the SMA length 2 is sideways or up to prevent opening Trades in a ongoing Downtrend!
the Buy Singnals you find below, the green Dots.
Let me knwo if i shouldd add a sell also or should do any Changes.

🟢🟥 Liquidity Grabs + Volumen Alto by ernesto[Crypto CLEAN]Name: 🟢🟥 Liquidity Grabs + High Volume
This indicator identifies potential liquidity grabs at both swing highs and swing lows, confirmed by a high volume spike. It's designed specifically for crypto trading and works across all timeframes.
🔍 What it does:
Detects possible stop hunts / liquidity sweeps.
Confirms with volume higher than the average (user-defined multiplier).
Marks the event with a clean label above or below the candle (no background coloring).
Great for spotting institutional moves or whale activity.
Compatible with any asset and timeframe.
📌 How it works:
A swing high is considered a liquidity grab if the high breaks recent highs and volume is elevated.
A swing low is a grab if the low breaks recent lows with high volume.
Labels show:
🟥 High Liquidity Grab (above candle)
🟩 Low Liquidity Grab (below candle)
🔔 Alerts included so you never miss a move.

CVD (Cumulative Volume Delta)
Cumulative Volume Delta
Use a moving average with three different
I thought about determining the volatility and direction of the price of the stock price and finding a place to break through.
I made some Mistake coz I'm new corder
I'm reposting this simple script due to house rule violation. (Whatever can haha) 😁
I'm erasing all the comments in my native language that I had in my script... I thought it would make the User uncomfortable, so I locked the code, and I thought maybe that's the problem
Anyway, I'm sorry 😅
MaterialPaletteMaterialPalette Library
█ OVERVIEW
This Pine Script® library provides a convenient way to access and utilize colors based on the popular Material Design color system directly within your TradingView scripts. It offers a comprehensive set of functions to retrieve specific shades of various base colors, allowing developers to create visually consistent and aesthetically pleasing indicators and strategies.
By importing this library, you gain access to functions that generate colors based on saturation, darkness level, and opacity, simplifying the process of managing color palettes in your projects.
█ FEATURES
Provides exported functions for 18 base Material Design colors (e.g., `red()`, `blue()`, `green()`, `amber()`, etc.).
Each color function allows selection from multiple shades based on `saturationLevel` (int) and `darkLevel` (int).
All color functions accept an `opacity` parameter (integer, 0-100).
Includes a `tone()` function for quick access to predefined base tones (e.g., `tone("red")`).
Offers a consistent and organized approach to using Material Design colors in Pine Script®.
Includes detailed `@function`, `@param`, and `@returns` annotations within the code for comprehensive documentation.
█ HOW TO USE
To use this library in your own Pine Script® indicator or strategy, you first need to import it using the `import` statement.
1. Import the Library:
Add the following line at the beginning of your script. Remember to replace `mastertop_astray` with the actual TradingView username the library is published under, and `VERSION` with the specific version number of the library you wish to use (you can find this on the library's script page).
import mastertop_astray/MaterialPalette/VERSION as mp
// Example: import mastertop_astray/MaterialPalette/1 as mp
*(We use `mp` as a short alias for `MaterialPalette` for convenience)*
2. Call Exported Functions:
Once imported, you can call the exported functions using the alias (`mp.` prefix).
//@version=6
indicator("My Indicator Using MaterialPalette")
import mastertop_astray/MaterialPalette/VERSION as mp // Replace VERSION
// --- Get Colors ---
// Get a specific shade: Dark Red (darkLevel=3), highest saturation (13), fully opaque (0)
darkRed = mp.red(13, 3, 0)
// Get another shade: Light Blue (lightLevel=1), medium saturation (e.g., 7), 50% opacity
lightBlueTransparent = mp.lightBlue(7, 1, 50)
// Get a base tone color: Green, fully opaque
baseGreen = mp.tone("green", 0)
// Get another base tone: Amber, 80% opacity
amberToneTransparent = mp.tone("amber", 80)
// --- Use Colors in Plotting ---
plot(close, color = darkRed, title = "Close Line")
plot(sma(close, 20), color = lightBlueTransparent, title = "SMA 20")
bgcolor(close > open ? mp.green(1, 2, 90) : mp.red(1, 2, 90)) // Use light shades for background
// Use a base tone
hline(100, "Upper Band", color = amberToneTransparent)
█ EXPORTED FUNCTIONS
This library provides two main categories of functions:
1. Color Shade Generators (`red()` to `blueGrey()`):
Includes: 18 functions for base colors (`red()`, `pink()`, ..., `blueGrey()`).
Purpose: Generate specific shades of the base color according to Material Design palettes.
Parameter `saturationLevel` (int): Controls color intensity/saturation. The valid range and default value vary depending on the specific color function (typically 1-13 or 1-9). Please check the `@param` annotation in the code for each function.
Parameter `darkLevel` (int): Sets the lightness/darkness of the shade (1: Light, 2: Medium/Base, 3: Dark). Default is 2.
Parameter `opacity` (int): Sets the color's transparency (0 = Opaque, 100 = Invisible). Default is 0.
Returns: The calculated `color` value.
Note: For exact default values and valid saturation ranges for each specific color function, refer to the detailed `@param` annotations within the library's source code.
2. Base Tone Function (`tone()`):
Purpose: Retrieve a single, predefined base color tone from the palette.
Parameter `colorName` (simple string): The text name identifying the desired base color (e.g., 'red', 'blue', 'green', 'light_blue').
Parameter `opacity` (int): Sets the color's transparency (0 = Opaque, 100 = Invisible). Default is 0.
Returns: The corresponding base tone `color`.
Note: Please consult the function's implementation in the source code for the complete list of valid `colorName` strings.
█ VISUALIZATION TABLE (For Demonstration)
The library's source code includes logic (within an `if barstate.islast` block) that generates a large table displaying all available color shades.
Important: This table will only appear on your chart if you add the entire library code itself directly as an indicator. This is primarily intended for demonstration, reference, and development purposes to visualize the palette. When using the library normally via the `import` statement in your own scripts, this table code is not executed or needed.
█ SUMMARY
The `MaterialPalette` library offers a structured and easy way for Pine Script® developers to incorporate Material Design colors into their TradingView scripts, enhancing visual appeal and consistency. Please refer to the detailed comments within the code for specifics on parameter ranges and available tones.
This source code is subject to the terms of the Mozilla Public License 2.0.
© mastertop_astray


Custom RSI + MACD DivergenceBreakdown of the Script:
RSI Calculation: The RSI is calculated using the rsi function, and the value is plotted on the main chart below the price.
MACD Calculation: The MACD line, signal line, and histogram are plotted. These are key components of the MACD oscillator, which is useful for momentum analysis.
Divergence Logic: The script looks for bullish and bearish divergences between the price action and the RSI. A bullish divergence occurs when the price makes a lower low, but the RSI makes a higher low, signaling potential upward movement. A bearish divergence occurs when the price makes a higher high, but the RSI makes a lower high, signaling potential downward movement.
Signal Plotting: When a divergence is detected, the script marks it on the chart using shapes (either a "BUY" label for bullish or "SELL" label for bearish divergences).
Background Color: The background color is altered based on the detected divergence. If a bullish divergence is found, the background turns green, and for bearish divergences, it turns red.
Alerts: Alerts are set up to notify when a bullish or bearish divergence occurs, based on the conditions.
How to Use:
The RSI and MACD will provide additional momentum context.
Divergences (both bullish and bearish) are marked visually on the chart with labels and background colors.
You can set alerts to be notified whenever a divergence occurs, giving you automated trading signals.


Filled/Unfilled Candles + Gap ZonesFilled unfilled filled candlestick
To help traders identify bullish/bearish candles and price gaps that may offer trade opportunities.
---
Features:
1. Candle Coloring:
Green = Unfilled Bullish Candle (close > open).
Red = Filled Bearish Candle (close < open).
2. Gap Detection:
Detects Gap-Up (today's open > yesterday's high).
Detects Gap-Down (today's open < yesterday's low).
3. Gap Zones:
Draws a box around the gap area.
If price fills the gap, the box color turns green to confirm.
4. Alerts:
Alerts you when a gap is filled, signaling potential reversal or continuation setup.

Supertrend Hombrok BotSupertrend Hombrok Bot – Automated Trading Strategy for Dynamic Market Conditions
This trading strategy script has been developed to operate automatically based on detailed market conditions. It combines the popular Supertrend indicator, RSI (Relative Strength Index), Volume, and ATR (Average True Range) to determine the best entry and exit points while maintaining proper risk management.
Key Features:
Supertrend as the Base: Uses the Supertrend indicator to identify the market's trend direction, generating buy signals when the market is in an uptrend and sell signals when in a downtrend.
RSI Filter: The RSI is used to determine overbought and oversold conditions, helping to avoid entries in extreme market conditions. Entries are avoided when RSI > 70 (overbought) and RSI < 30 (oversold), reducing the risk of false movements.
Volume Filter: The strategy checks if the trading volume is above the average multiplied by a user-defined factor. This ensures that only significant movements, with higher liquidity, are considered.
Candle Body Size: The strategy filters only candles with a body large enough relative to the ATR (Average True Range), ensuring that the price movements on the chart have sufficient strength.
Risk Management: The bot is configured to operate with an adjustable Risk/Reward Ratio (R:R). This means that for each trade, both Take Profit (TP) and Stop Loss (SL) are adjusted based on the market's volatility as measured by the ATR.
Automatic Entries and Exits: The script automatically executes entries based on the specified conditions and exits with predefined Stop Loss and Take Profit levels, ensuring risk is controlled for each trade.
How It Works:
Buy Condition: Triggered when the market is in an uptrend (Supertrend), the volume is above the adjusted average, the candle body is strong enough, and the RSI is below the overbought level.
Sell Condition: Triggered when the market is in a downtrend (Supertrend), the volume is above the adjusted average, the candle body is strong enough, and the RSI is above the oversold level.
Alerts:
Buy and Sell Alerts are configured with detailed information, including Stop Loss and Take Profit values, allowing the user to receive notifications when trading conditions are met.
Capital Management:
The capital per trade can be adjusted based on account size and risk profile.
Important Note:
Always test before trading with real capital: While the strategy has been designed based on solid technical analysis methods, always perform tests in real-time market conditions with demo accounts before applying the bot in live trading.
Disclaimer: This script is a tool to assist in the trading process and does not guarantee profit. Past performance is not indicative of future results, and the trader is always responsible for their investment decisions.

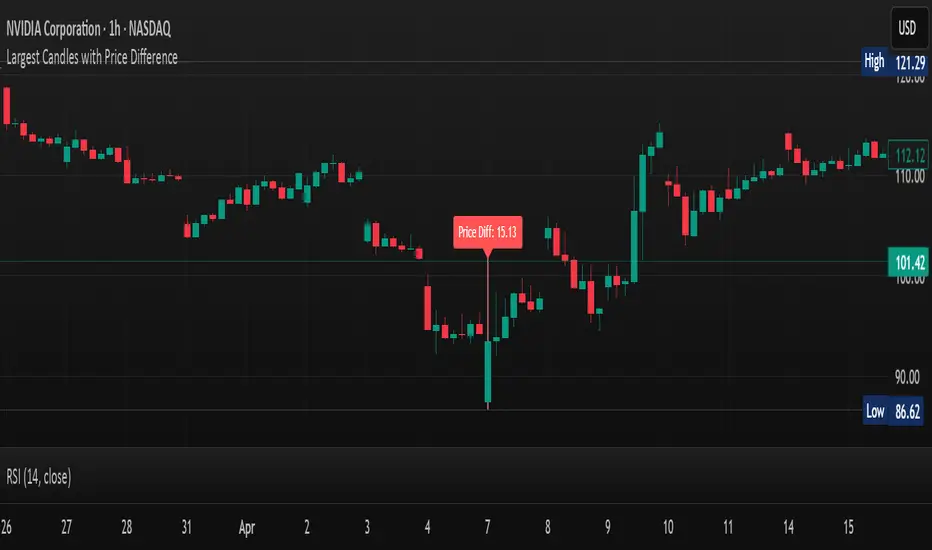
Largest Candles with Price DifferenceThis script shows the largest move on a candle on a particular time frame. So if you are looking at the 10-minute chart, it will tell you what the largest 10-minute candle has been in the past.
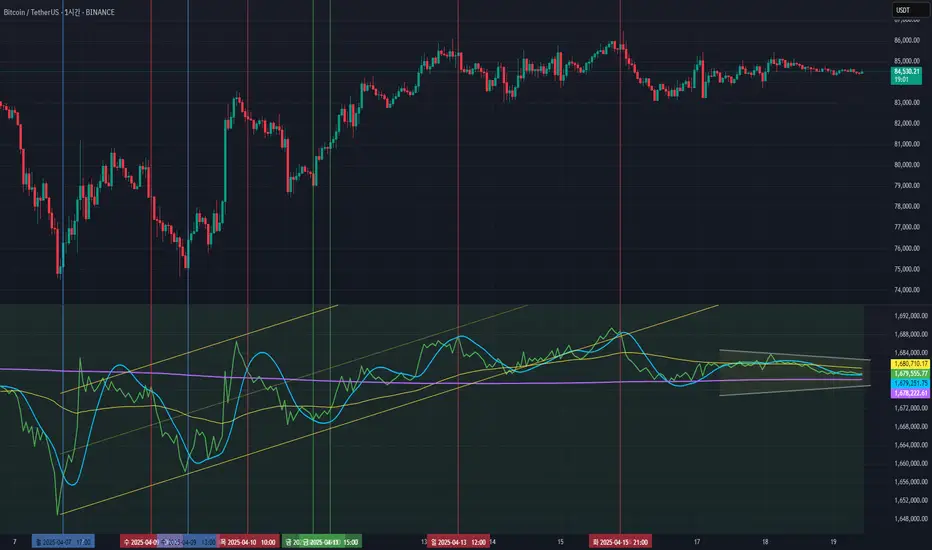
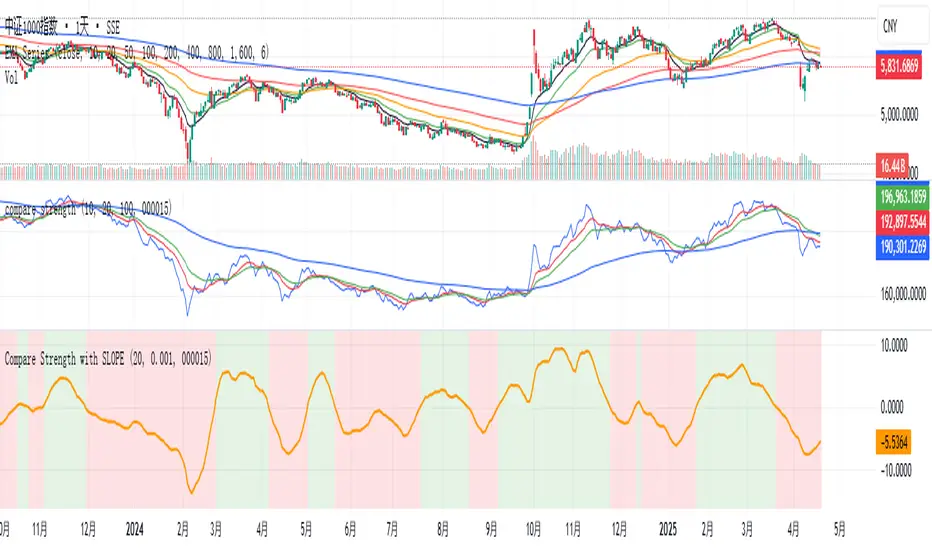
Compare Strength with SLOPE Description
This indicator compares the relative strength between the current asset and a benchmark (e.g., BTC vs. ETH or AAPL vs. SPY) using a linear regression slope of their ratio over time.
The ratio is calculated as: close / benchmark
A linear regression slope is computed over a user-defined window
The slope represents trend strength: if it’s rising, the current asset is outperforming the benchmark
Plots
Gray Line: The raw ratio between the asset and benchmark
Orange Line: The slope of the ratio (shows momentum)
Background Color :
Green: The asset is significantly stronger than the benchmark
Red: The asset is significantly weaker than the benchmark
No color: No clear trend
Settings
Slope Window Length: Number of candles used in the regression (default = 10)
Slope Threshold: Sensitivity of trend detection. Smaller values detect weaker trends.
Example Use Cases
Style Rotation Strategy: Use the slope to determine whether "Growth" or "Value" style is leading.
Pair Trading / Relative Performance: Track which asset is leading in a pair (e.g., BTC vs ETH).
Factor Timing: Serve as a timing model to allocate between different sectors or factors.
Happy trading!
Intraday Long Stoploss DistanceWhile working on intraday 1-minute charts i found it distracting to calculate the stoploss distance from the current price so i created an overlay indicator that plots the values of the last 15 minute and 30 minutes low for safe SL placement so you can get a rough idea of Risk management and lot size to use.
Still in early phases. Few more updates coming soon .stay updated.
*Not a financial advice.

QuantumFlowX™ - Özgün Momentum Algoritması + NUPUGoals:
Momentum Analysis: The primary goal of the momentum indicator is to assess the speed and strength of a price move. We will conduct independent analyses of price and momentum to detect momentum movements.
Divergence Detection: By identifying discrepancies (divergences) between price movements and momentum indicators, we will generate buy and sell signals.
Visualization: The momentum indicator’s visual representation will be clearly shown on the chart either as a line or histogram. Divergences and buy/sell signals will also be marked using shapes.
Steps:
Calculating the Momentum Indicator:
We will calculate the momentum indicator based on price changes over a specified period.
Detecting Divergences Between Price and Momentum:
Divergences will be identified when the price moves in one direction, while the momentum indicator moves in the opposite direction.
Marking Divergences Visually on the Chart:
Divergences will be clearly marked with shapes (arrows or labels) to indicate buy and sell opportunities.
Displaying Momentum Lines and Histograms:
Momentum will be displayed on the chart using lines or histograms, clearly showing the strength and direction of the price move.

Custom Cancel Size PatternObjective:
This TradingView indicator identifies a specific 3-candle pattern based on candle size (measured using True Range) and highlights the third candle (or later) when the pattern is complete.
---
The 3-Candle Pattern Logic:
1. Candle 1 (two candles ago)
Its True Range (TR) must be greater than the current Average True Range (ATR).
This means it's a relatively large candle — we're looking for strong movement here.
2. Candle 2 (one candle ago)
Its TR must be less than the ATR.
This suggests a "cooling off" or a smaller move.
3. Candle 3 (the current candle)
Its TR must be at least 2 times bigger than Candle 2's TR.
This means a breakout or strong move again, following the smaller candle.
---
What the Indicator Does:
Detects this 3-candle pattern as new candles form.
Highlights the third candle (the current one) with a green color and a label beneath it that says "Pattern".
Optionally colors the bar green (you can customize this if you want a different visual style).
---
What You’ll See on the Chart:
When the conditions are met:
A green bar (if bar coloring is enabled).
A label below the bar that says “Pattern” appears under the third candle.


20-Bar Breakout + 20-Day High/LowIt marks High/Low of last 20 days and also breakout of high low of last 20 bars on any timeframe
