Multi-timeframe Difference Forecast (MTD)Description:
The Multi-timeframe Difference Forecast indicator projects potential future price levels by comparing open prices across multiple timeframe pairs. It uses 12 predefined timeframe pairs where each pair consists of a lower and a higher timeframe. For each pair, the indicator calculates a forecast value by adding the difference between the lower timeframe’s open and the higher timeframe’s open to the current bar’s close. These forecast values are then plotted as points into the future and connected by blue line segments, forming a continuous projection line on your chart.
How It Works:
Timeframe Pairs:
The indicator defines 12 pairs. For example:
Pair 1: Lower timeframe = 15 minutes; Higher timeframe = 150 minutes
Pair 2: Lower timeframe = 30 minutes; Higher timeframe = 165 minutes
⋮
Pair 12: Lower timeframe = 180 minutes; Higher timeframe = 720 minutes
Forecast Calculation:
For each pair, the forecast is computed as:
forecast = close + (lower timeframe open - higher timeframe open)
This produces a series of forecast values that are then plotted on the chart.
Time Offset:
Each forecast point is offset into the future by a number of bars calculated as the ratio between the lower timeframe’s duration (in seconds) and the current chart’s timeframe (in seconds). This adjustment helps align the forecast points correctly on the time axis.
Visualization:
The indicator draws blue lines (width = 2) connecting the current price to each forecast point sequentially, forming a polyline that visually represents the projected price trajectory.
How to Use:
Overlay on Chart:
Apply this indicator to any chart, and it will automatically overlay the forecast line on your current price chart.
Timeframe Flexibility:
The calculations adjust to the chart’s timeframe, so you can use it on various timeframes without needing to change the code.
Interpretation:
The forecast line is intended to provide a visual estimate of potential future price movement based on historical open price differences. It is meant to serve as an additional analytical tool rather than a standalone trading signal.
Disclaimer:
This script is provided for educational and informational purposes only and should not be construed as financial or trading advice. Trading involves significant risk, and past performance is not indicative of future results. You should perform your own analysis and consult with a qualified professional before making any trading decisions. Use this indicator at your own risk.
Индикаторы и стратегии

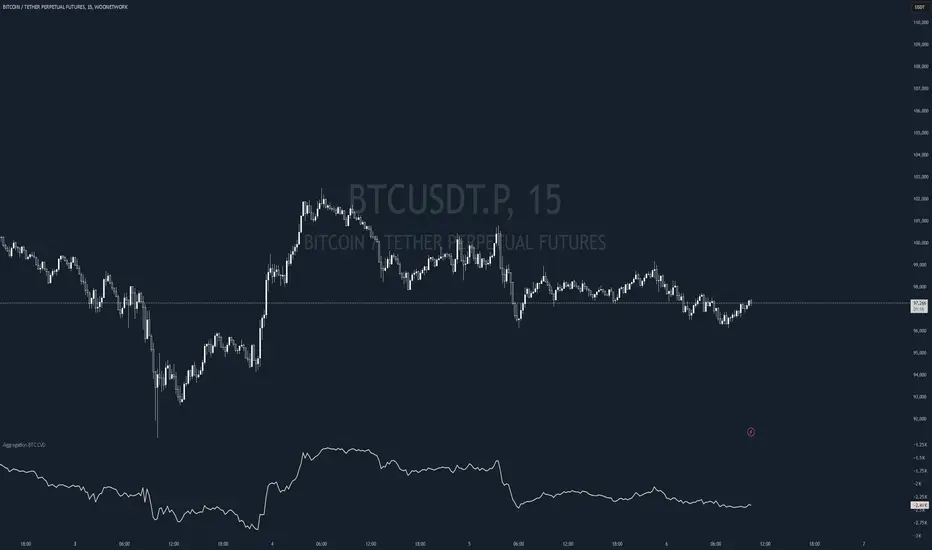
Aggregation BTC CVDThe script calculates the Cumulative Volume Delta (CVD) for multiple cryptocurrency exchanges, then averages these values and plots them.
Indicator Setup:
The script sets up an indicator called "BTC Cumulative Volume Delta (CVD) for multiple cryptocurrency exchanges", displayed as a separate panel (not overlaid on the price chart) with volume format.
Getting 1-minute data from multiple exchanges:
It retrieves 1-minute data (buy and sell volumes) for Bitcoin (BTC) against USD or USDT from several exchanges: Binance, OKEx, Coinbase (both BTCUSDT and BTCUSD), Bitfinex, Bybit, Huobi, and Kraken.
Calculating total buying and selling volume for each exchange:
For each exchange, it calculates the total buying volume (buy_vol_...), selling volume (sell_vol_...), and the difference between them (delta_vol_...).
It then computes the cumulative delta volume (cum_delta_vol_...), which is a running total of delta_vol_....
Calculating the average CVD:
It calculates the average cumulative delta volume (average_cum_delta_vol) by summing the cumulative delta volumes from all exchanges and dividing by the number of exchanges.
Plotting the average CVD:
Finally, it plots the average CVD with white color, and a line width of 2.
This script essentially provides an averaged Cumulative Volume Delta across multiple exchanges, giving a comprehensive view of buying and selling pressure in the Bitcoin market across these platforms.
Ultimate T3 Fibonacci for BTC Scalping. Look at backtest report!Hey Everyone!
I created another script to add to my growing library of strategies and indicators that I use for automated crypto trading! This strategy is for BITCOIN on the 30 minute chart since I designed it to be a scalping strategy. I calculated for trading fees, and use a small amount of capital in the backtest report. But feel free to modify the capital and how much per order to see how it changes the results:)
It is called the "Ultimate T3 Fibonacci Indicator by NHBprod" that computes and displays two T3-based moving averages derived from price data. The t3_function calculates the Tilson T3 indicator by applying a series of exponential moving averages to a combined price metric and then blending these results with specific coefficients derived from an input factor.
The script accepts several user inputs that toggle the use of the T3 filter, select the buy signal method, and set parameters like lengths and volume factors for two variations of the T3 calculation. Two T3 lines, T3 and T32, are computed with different parameters, and their colors change dynamically (green/red for T3 and blue/purple for T32) based on whether the lines are trending upward or downward. Depending on the selected signal method, the script generates buy signals either when T32 crosses over T3 or when the closing price is above T3, and similarly, sell signals are generated on the respective conditions for crossing under or closing below. Finally, the indicator plots the T3 lines on the chart, adds visual buy/sell markers, and sets alert conditions to notify users when the respective trading signals occur.
The user has the ability to tune the parameters using TP/SL, date timerames for analyses, and the actual parameters of the T3 function including the buy/sell signal! Lastly, the user has the option of trading this long, short, or both!
Let me know your thoughts and check out the backtest report!

UtilityLibraryLibrary "UtilityLibrary"
A collection of custom utility functions used in my scripts.
milliseconds_per_bar()
Gets the number of milliseconds per bar.
Returns: (int) The number of milliseconds per bar.
realtime()
Checks if the current bar is the actual realtime bar.
Returns: (bool) `true` when the current bar is the actual realtime bar, `false` otherwise.
replay()
Checks if the current bar is the last replay bar.
Returns: (bool) `true` when the current bar is the last replay bar, `false` otherwise.
bar_elapsed()
Checks how much of the current bar has elapsed.
Returns: (float) Between 0 and 1.
even(number)
Checks if a number is even.
Parameters:
number (float) : (float) The number to evaluate.
Returns: (bool) `true` when the number is even, `false` when the number is odd.
sign(number)
Gets the sign of a float.
Parameters:
number (float) : (float) The number to evaluate.
Returns: (int) 1 or -1, unlike math.sign() which returns 0 if the number is 0.
atan2(y, x)
Derives an angle in radians from the XY coordinate.
Parameters:
y (float) : (float) Y coordinate.
x (float) : (float) X coordinate.
Returns: (float) Between -π and π.
clamp(number, min, max)
Ensures a value is between the `min` and `max` thresholds.
Parameters:
number (float) : (float) The number to clamp.
min (float) : (float) The minimum threshold (0 by default).
max (float) : (float) The maximum threshold (1 by default).
Returns: (float) Between `min` and `max`.
remove_gamma(value)
Removes gamma from normalized sRGB channel values.
Parameters:
value (float) : (float) The normalized channel value .
Returns: (float) Channel value with gamma removed.
add_gama(value)
Adds gamma into normalized linear RGB channel values.
Parameters:
value (float) : (float) The normalized channel value .
Returns: (float) Channel value with gamma added.
rgb_to_xyz(Color)
Extracts XYZ-D65 channels from sRGB colors.
Parameters:
Color (color) : (color) The sRGB color to process.
Returns: (float tuple)
xyz_to_rgb(x, y, z)
Converts XYZ-D65 channels to sRGB channels.
Parameters:
x (float) : (float) The X channel value.
y (float) : (float) The Y channel value.
z (float) : (float) The Z channel value.
Returns: (int tuple)
rgb_to_oklab(Color)
Extracts OKLAB-D65 channels from sRGB colors.
Parameters:
Color (color) : (color) The sRGB color to process.
Returns: (float tuple)
oklab_to_rgb(l, a, b)
Converts OKLAB-D65 channels to sRGB channels.
Parameters:
l (float) : (float) The L channel value.
a (float) : (float) The A channel value.
b (float) : (float) The B channel value.
Returns: (int tuple)
rgb_to_oklch(Color)
Extracts OKLCH channels from sRGB colors.
Parameters:
Color (color) : (color) The sRGB color to process.
Returns: (float tuple)
oklch_to_rgb(l, c, h)
Converts OKLCH channels to sRGB channels.
Parameters:
l (float) : (float) The L channel value.
c (float) : (float) The C channel value.
h (float) : (float) The H channel value.
Returns: (float tuple)
hues(l1, h1, l2, h2, dist)
Ensures the hue angles are set correctly for linearly interpolating OKLCH.
Parameters:
l1 (float) : (float) The first L channel value.
h1 (float) : (float) The first H channel value.
l2 (float) : (float) The second L channel value.
h2 (float) : (float) The second H channel value.
dist (string) : (string) The preferred angular distance to use. Options: `min` or `max` (`min` by default).
Returns: (float tuple)
lerp(a, b, t)
Linearly interpolates between two values.
Parameters:
a (float) : (float) The starting point (first value).
b (float) : (float) The ending point (second value).
t (float) : (float) The interpolation factor .
Returns: (float) Between `a` and `b`.
smoothstep(t, precise)
A non-linear (smooth) interpolation between 0 and 1.
Parameters:
t (float) : (float) The interpolation factor .
precise (bool) : (bool) Sets if the calc should be precise or efficient (`true` by default).
Returns: (float) Between 0 and 1.
ease(t, n, v, x1, y1, x2, y2)
A customizable non-linear interpolation between 0 and 1.
Parameters:
t (float) : (float) The interpolation factor .
n (float) : (float) The degree of ease (1 by default).
v (string) : (string) The easing variant type: `in-out`, `in`, or `out` (`in-out` by default).
x1 (float) : (float) Optional X coordinate of starting point (0 by default).
y1 (float) : (float) Optional Y coordinate of starting point (0 by default).
x2 (float) : (float) Optional X coordinate of ending point (1 by default).
y2 (float) : (float) Optional Y coordinate of ending point (1 by default).
Returns: (float) Between 0 and 1.
mix(color1, color2, blend, space, dist)
Linearly interpolates between two colors.
Parameters:
color1 (color) : (color) The first color.
color2 (color) : (color) The second color.
blend (float) : (float) The interpolation factor .
space (string) : (string) The color space to use for interpolating. Options: `rgb`, `oklab`, and `oklch` (`rgb` by default).
dist (string) : (string) The anglular distance to use for the hue change when the color space is set to `oklch`. Options: `min` and `max` (`min` by default).
Returns: (color) Blend of `color1` and `color2`.

9-30wma//@version=5
indicator("Custom Indicator", overlay=true)
// 9 Günlük EMA ve 30 Günlük WMA
ema9 = ta.ema(close, 9)
wma30 = ta.wma(close, 30)
// Kapanışların 9 EMA ve 30 WMA seviyelerinin üzerinde olup olmadığını kontrol et
isCloseAboveEma9 = close > ema9
isCloseAboveWma30 = close > wma30
// Mavi sinyal: 9 EMA'nın altında, fakat 30 WMA'nın üstünde kapanış yapan ilk mum
blueSignalCondition = ta.crossover(close, ema9) and close < ema9 and close > wma30
// Yeşil sinyal: Mavi sinyali veren mumun üst seviyesinin üstünde kapanış yapan ilk mum
greenSignalCondition = close > ta.highest(blueSignalCondition ? high : na, 1) and blueSignalCondition
// Mavi ve yeşil sinyal çizimleri
plotshape(series=blueSignalCondition, color=color.blue, style=shape.labelup, location=location.belowbar, size=size.small, title="Blue Signal")
plotshape(series=greenSignalCondition, color=color.green, style=shape.labelup, location=location.belowbar, size=size.small, title="Green Signal")

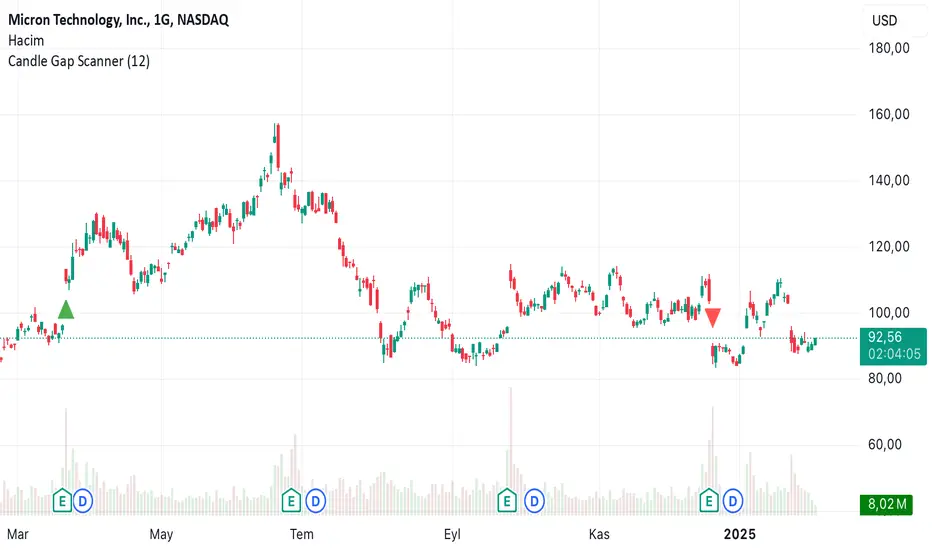
Candle Gap ScannerThis code will compare the first candle with the second candle. If the highest value reached by the first candle is lower than the lowest value reached by the second candle, and this difference is greater than a percentage value that can be adjusted in the settings, it will place a red mark. Additionally, it will compare the first candle with the second candle again. If the lowest value reached by the first candle is higher than the highest value reached by the second candle, and this difference is greater than a percentage value that can be adjusted in the settings, it will place a red mark.
Dynamic SMATimeframe Detection: The indicator first identifies the current timeframe of the chart (e.g., daily, 4-hour, 1-hour).
SMA Calculation: It calculates three different SMAs:
Daily SMA: A 8-period SMA calculated on daily closing prices.
4-Hour SMA: A 50-period SMA calculated on 4-hour closing prices.
1-Hour SMA: A 100-period SMA calculated on 1-hour closing prices.
Dynamic SMA Selection: Based on the detected timeframe, the indicator selects the appropriate SMA to display:
If the timeframe is daily, it uses the daily SMA.
If the timeframe is 4-hour, it uses the 4-hour SMA.
If the timeframe is 1-hour, it uses the 1-hour SMA.
Plotting: The selected SMA is plotted on the chart as a blue line.
Dynamic Label: The indicator also creates a dynamic label that displays the current SMA being used, along with the corresponding timeframe and period. For example, it will show "Active SMA: 8 SMA (Daily)" when the daily SMA is active.
This indicator is useful for traders who want to use different SMAs for different timeframes without having to manually switch between them. It provides a convenient way to see the relevant SMA for the current chart view.

Anchored Moving AverageAn Anchored Moving Average (AMA) is a technical analysis tool that calculates the average price of an asset starting from a specific point in time. Every closing candle calculates the price.

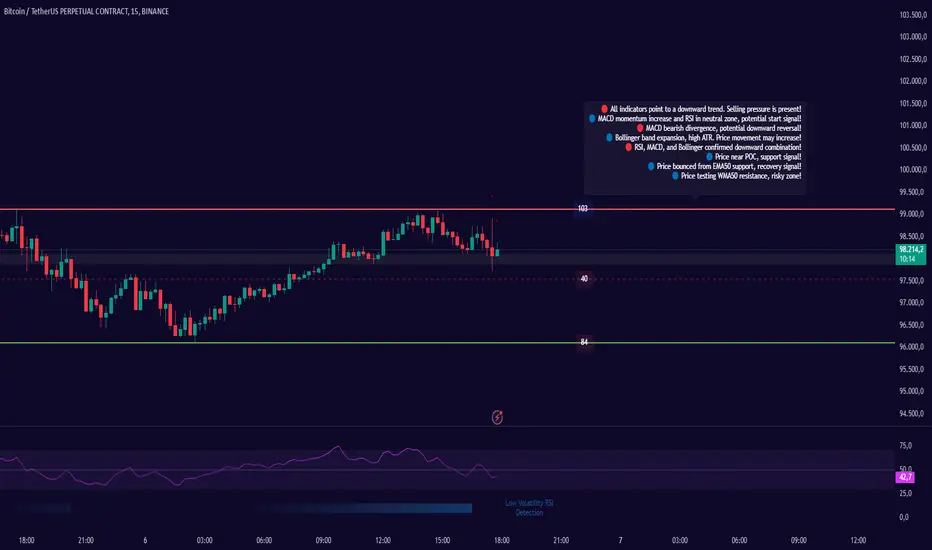
Combined SmartComment & Dynamic S/R LevelsDescription:
The Combined SmartComment & Dynamic S/R Levels script is designed to provide valuable insights for traders using TradingView. It integrates dynamic support and resistance levels with a powerful Intelligent Comment system to enhance decision-making. The Intelligent Comment feature generates market commentary based on key technical indicators, delivering real-time actionable feedback that helps optimize trading strategies.
Intelligent Comment Feature:
The Intelligent Comment function continuously analyzes market conditions and offers relevant insights based on combinations of various technical indicators such as RSI, ATR, MACD, WMA, and others. These comments help traders identify potential price movements, highlighting opportunities to buy, sell, or wait.
Examples of the insights provided by the system include:
RSI in overbought/oversold and price near resistance/support: Indicates potential price reversal points.
Price above VAH and volume increasing: Suggests a strengthening uptrend.
Price near dynamic support/resistance: Alerts when price approaches critical support or resistance zones.
MACD crossovers and RSI movements: Provide signals for potential trend shifts or continuations.
Indicators Used:
RSI (Relative Strength Index)
ATR (Average True Range)
MACD (Moving Average Convergence Divergence)
WMA (Weighted Moving Average)
POC (Point of Control)
Bollinger Bands
SuperSignal
Volume
EMA (Exponential Moving Average)
Dynamic Support/Resistance Levels
How It Works:
The script performs real-time market analysis, assessing multiple technical indicators to generate Intelligent Comments. These comments provide traders with timely guidance on potential market movements, assisting with decision-making in a dynamic market environment. The script also integrates dynamic support and resistance levels to further enhance trading accuracy.
Uptrick: FRAMA Matrix RSIUptrick: FRAMA Matrix RSI
Introduction
The Uptrick: FRAMA Matrix RSI is a momentum-based indicator that integrates the Relative Strength Index (RSI) with the Fractal Adaptive Moving Average (FRAMA). By applying FRAMA's adaptive smoothing to RSI—and further refining it with a Zero-Lag Moving Average (ZLMA)—this script creates a refined and reliable momentum oscillator. The indicator now includes enhanced divergence detection, potential reversal signals, customizable buy/sell signal options, an internal stats table, and a fully customizable bar coloring system for an enhanced visual trading experience.
Why Combine RSI with FRAMA
Traditional RSI is a well-known momentum indicator but has several limitations. It is highly sensitive to price fluctuations, often generating false signals in choppy or volatile markets. FRAMA, in contrast, adapts dynamically to price changes by adjusting its smoothing factor based on market conditions.
By integrating FRAMA into RSI calculations, this indicator reduces noise while preserving RSI's ability to track momentum, adapts to volatility by reducing lag in trending markets and smoothing out choppiness in ranging conditions, enhances trend-following capability for more reliable momentum shifts, and refines overbought and oversold signals by adjusting to the current market structure.
With the new enhancements, such as a manual alpha input, noise filtering, divergence detection, and multiple buy/sell signal options, the indicator offers even greater flexibility and precision for traders. This combination improves the standard RSI by making it more adaptive and responsive to market changes.
Originality
This indicator is unique because it applies FRAMA's adaptive smoothing technique to RSI, creating a dynamic momentum oscillator that adjusts to different market conditions. Many traditional RSI-based indicators either use fixed smoothing methods like exponential moving averages or employ basic RSI calculations without adjusting for volatility.
This script stands out by integrating several elements, including the fractal dimension-based smoothing of FRAMA to reduce noise while retaining responsiveness, the use of Zero-Lag Moving Average smoothing to enhance trend sensitivity and reduce lag, divergence detection to highlight mismatches between price action and RSI momentum, a noise filter and manual alpha option to prevent minor fluctuations from generating false signals, customizable buy/sell signal options that let traders choose between ZLMA-based or FRAMA RSI-based signals, an internal stats table displaying real-time FRAMA calculations such as fractal dimension and the adaptive alpha factor, and a fully customizable bar coloring system to visually distinguish bullish, bearish, and neutral conditions.
Features
Adaptive FRAMA RSI
The indicator applies FRAMA to RSI values, making the momentum oscillator adaptive to volatility while filtering out noise. Unlike a traditional RSI that reacts equally to all price movements, FRAMA RSI adjusts its smoothing factor based on market structure, making it more effective for identifying true momentum shifts.
Zero-Lag Moving Average (ZLMA)
A smoothing technique that minimizes lag while preserving the responsiveness of price movements. It is applied to the FRAMA RSI to further refine signals and ensure smoother trend detection.
Bullish and Bearish Threshold Crossovers
This system compares FRAMA RSI to a user-defined threshold (default is 50). When FRAMA RSI moves above the threshold, it indicates bullish momentum, while movement below signals bearish conditions. The enhanced noise filter ensures that only significant moves trigger signals.
Noise Filter and Manual Alpha
A new noise filter input prevents tiny fluctuations from triggering false signals. In addition, a manual alpha option allows traders to override the automatically computed smoothing factor with a custom value, providing extra control over the indicator’s sensitivity.
Divergence Detection
The indicator identifies divergence patterns by comparing FRAMA RSI pivots to price action. Bullish divergence occurs when price makes a lower low while FRAMA RSI makes a higher low, and bearish divergence occurs when price makes a higher high while FRAMA RSI makes a lower high. These signals can help traders anticipate potential reversals.
Reversal Signals
Labels appear on the chart when FRAMA RSI confirms classic RSI overbought (70) or oversold (30) conditions, providing visual cues for potential trend reversals.
Buy and Sell Signal Options
Traders can now choose between two signal-generation methods. ZLMA-based signals trigger when the ZLMA of FRAMA RSI crosses key overbought (70) or oversold (30) levels, while FRAMA RSI-based signals trigger when FRAMA RSI itself crosses these levels. This added flexibility allows users to tailor the indicator to their preferred trading style.
ZLMA:
FRAMA:
Customizable Alerts
Alerts notify traders when FRAMA RSI crosses key levels, divergence signals occur, reversal conditions are met, or buy/sell signals trigger. This ensures that important trading events are not missed.
Fully Customizable Bar Coloring System
Users can color bars based on different conditions, enhancing visual clarity. Bar coloring modes include: FRAMA RSI threshold (bars change color based on whether FRAMA RSI is above or below the threshold), ZLMA crossover (bars change when ZLMA crosses overbought or oversold levels), buy/sell signals (bars change when official signals trigger), divergence (bars highlight when bullish or bearish divergence is detected), and reversals (bars indicate when RSI reaches overbought or oversold conditions confirmed by FRAMA RSI). The system also remembers the last applied bar color, ensuring a smooth visual transition.
Input Parameters and Features
Core Inputs
RSI Length (default: 14) defines the period for RSI calculations.
FRAMA Lookback (default: 16) determines the length for the FRAMA smoothing function.
RSI Bull Threshold (default: 50) sets the level above which the market is considered bullish and below which it is bearish.
Noise Filter (default: 1.0) ensures that small fluctuations do not trigger false bullish or bearish signals.
Additional Features
Show Bull and Bear Alerts (default: true) enables notifications when FRAMA RSI crosses the threshold.
Enable Divergence Detection (default: false) highlights bullish and bearish divergences based on price and FRAMA RSI pivots.
Show Potential Reversal Signals (default: false) identifies overbought (70) and oversold (30) levels as possible trend reversal points.
Buy and Sell Signal Option (default: ZLMA) allows traders to choose between ZLMA-based signals or FRAMA RSI-based signals for trade entry.
ZLMA Enhancements
ZLMA Length (default: 14) determines the period for the Zero-Lag Moving Average applied to FRAMA RSI.
Visualization Options
Show Internal Stats Table (default: false) displays real-time FRAMA calculations, including fractal dimension and the adaptive alpha smoothing factor.
Show Threshold FRAMA Signals (default: false) plots buy and sell labels when FRAMA RSI crosses the threshold level.
How It Works
FRAMA Calculation
FRAMA dynamically adjusts smoothing based on the price fractal dimension. The alpha smoothing factor is derived from the fractal dimension or can be set manually to maintain responsiveness.
RSI with FRAMA Smoothing
RSI is calculated using the user-defined lookback period. FRAMA is then applied to the RSI to make it more adaptive to volatility. Optionally, ZLMA is applied to further refine the signals and reduce lag.
Bullish and Bearish Threshold Crosses
A bullish condition occurs when FRAMA RSI crosses above the threshold, while a bearish condition occurs when it falls below. The noise filter ensures that only significant trend shifts generate signals.
Buy and Sell Signal Options
Traders can choose between ZLMA crossovers or FRAMA RSI crossovers as the basis for buy and sell signals, offering flexibility in trade entry timing.
Divergence Detection
The indicator identifies divergences where price action and FRAMA RSI momentum do not align, potentially signaling upcoming reversals.
Reversal Signal Labels
When classic RSI overbought or oversold levels are confirmed by FRAMA RSI conditions, reversal labels are added on the chart to highlight potential exhaustion points.
Bar Coloring System
Bars are dynamically colored based on various conditions such as RSI thresholds, ZLMA crossovers, buy/sell signals, divergence, and reversals, allowing traders to quickly interpret market sentiment.
Alerts and Internal Stats
Customizable alerts notify traders of key events, and an optional internal stats table displays real-time calculations (fractal dimension, alpha value, and RSI values) to help users understand the underlying dynamics of the indicator.
Summary
The Uptrick: FRAMA Matrix RSI offers an enhanced approach to momentum analysis by combining RSI with adaptive FRAMA smoothing and additional layers of signal refinement. The indicator now includes adaptive RSI smoothing to reduce noise and improve responsiveness, Zero-Lag Moving Average filtering to minimize lag, divergence and reversal detection to identify potential turning points, customizable buy/sell signal options that let traders choose between different signal methodologies, a fully customizable bar coloring system to visually distinguish market conditions, and an internal stats table for real-time insight into FRAMA calculation parameters.
Whether used for trend confirmation, divergence detection, or momentum-based strategies, this indicator provides a powerful and adaptive approach to trading.
Disclaimer
This script is for informational and educational purposes only. Trading involves risk, and past performance does not guarantee future results. Always conduct proper research and consult with a financial advisor before making trading decisions.

4Hour Zone SeparatorThis custom TradingView indicator draws vertical lines on your chart to visually separate the 4-hour trading zones within a single trading day. The indicator helps traders identify key time intervals throughout the day for better market analysis and decision-making.
Features:
• Time-Based Zones: The indicator divides the day into six distinct 4-hour periods, starting from midnight (00:00) and continuing every 4 hours. Each zone is marked by a vertical line on the chart.
• User Customization: You can toggle the visibility of the lines for each 4-hour period (00:00, 04:00, 08:00, 12:00, 16:00, 20:00) based on your preference. This allows you to focus on specific zones that matter most for your analysis.
• Line Styling Options: Choose from three different line styles — Solid, Dashed, or Dotted — and adjust the thickness to your desired preference.
• Dynamic Time Adjustment: The indicator automatically adjusts for the time zone, ensuring that the 00:00 timestamp reflects the correct start of the day based on your chart’s time zone.
How It Works:
1. The indicator starts by calculating the beginning of the day at 00:00, then it sequentially places vertical lines every 4 hours.
2. Each line is color-coded for easy identification, and the lines stretch from the highest to the lowest point on the chart for that range.
3. The lines are drawn only when the chart enters a new 4-hour zone.
This tool is especially useful for day traders who want to track price action during specific times of the day and make informed decisions based on market behavior within each 4-hour period.

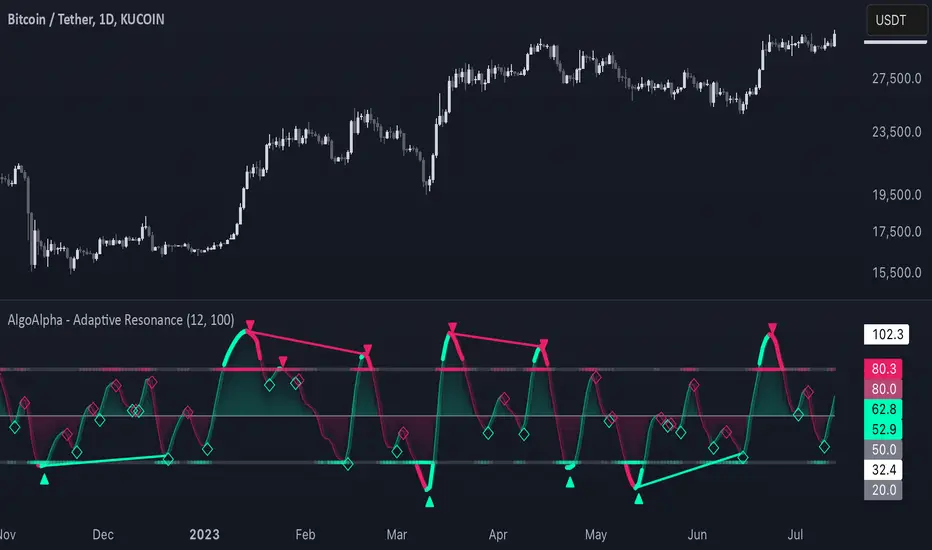
Adaptive Resonance Oscillator [AlgoAlpha]Introducing the Adaptive Resonance Oscillator , an advanced momentum-based oscillator designed to dynamically adjust to changing market conditions. This innovative indicator detects market frequency through a Hilbert Transform approach, adapting in real-time to identify overbought and oversold conditions with improved accuracy. With built-in divergence detection, trend analysis, and customizable smoothing, this tool is perfect for traders looking to refine their entries and exits based on adaptive oscillation mechanics.
🚀 Key Features :
🔹 Adaptive Frequency Detection – Uses Hilbert Transform principles to dynamically determine market cycle length for precise oscillator calculation.
⚙️ Customizable Smoothing – Option to apply a Hull Moving Average (HMA) for enhanced signal clarity.
📈 Divergence Detection – Identifies bullish and bearish divergences with visual markers, helping traders spot early trend reversals.
🟢 Overbought & Oversold Signals – Highlights extreme momentum conditions with adjustable thresholds.
🔔 Real-Time Alerts – Get notified for crossovers, divergences, and strong trend shifts directly on your TradingView chart.
🎨 Fully Customizable Appearance – Modify colors, divergence sensitivity, and smoothing options to fit your trading style.
🛠 How to Use :
Add the Adaptive Resonance Oscillator to your TradingView chart by clicking the ★ to favorite it.
Monitor the Charts , switch between smoothed and I smoothed modes to identify trend and price swings, use divergences and reversal signals for potential entry/exits.
Set alerts for bullish/bearish crossovers and divergence signals to stay ahead of market moves.
⚙ How It Works :
The indicator begins by applying a Hilbert Transform frequency estimation to the price series, identifying the dominant market cycle length. This is used to calculate a period for the RSI that matches its resonant frequency with the dominant market frequency, dynamically adjusting the Oscillator. The oscillator then applies an optional Hull Moving Average (HMA) smoothing for signal refinement. Additionally, the indicator scans for bullish and bearish divergences by comparing oscillator movements against price action, plotting signals accordingly. When overbought/oversold conditions or divergence events occur, alerts are triggered to notify the trader in real time.
Support and Resistance all in one The Support and Resistance Indicator (v4) is designed to identify and track key price levels in financial markets. Here's how it works:
Core Functionality
Level Detection
Uses pivot points to identify significant price levels
Looks for swing highs (resistance) and swing lows (support)
Requires price action to pivot over a specified period (default 10 bars)
Dynamic Level Management
Maintains separate arrays for support and resistance levels
Limits maximum displayed levels (default 10) to prevent chart clutter
Removes oldest levels when maximum is reached
Ensures new levels are sufficiently distant from existing ones (minimum 1% separation)
Touch Detection System
Monitors price interaction with established levels
Counts when price comes within 0.1% of any level
Updates touch count and strength classification
Categories: "New" (1 touch), "Moderate" (2 touches), "Strong" (3+ touches)
Visual Representation
Draws horizontal lines at each level
Updates line width based on strength (thicker for stronger levels)
Shows labels with price and strength information
Color coding: Red (new/moderate levels), Green (strong levels)
Displays triangles (▼▲) at pivot points
Trading Applications
Support/Resistance Trading
Strong levels (3+ touches) suggest reliable trading zones
More touches indicate higher probability reversal points
Use for stop loss and target placement
Breakout Trading
Monitor breaks of strong levels
Higher touch count suggests more significant breakouts
Watch for false breakouts at weaker levels
Risk Management
Place stops beyond strong levels
Use level strength to adjust position size
Consider multiple timeframe analysis
Best Practices
Use with other indicators for confirmation
Consider market context and trend
Monitor level strength development
Don't rely solely on touch count
Watch for price reaction at levels
Customization Options
Adjust pivot length for different timeframes
Modify minimum distance between levels
Change required touches for "Strong" classification
Toggle strength labels display
Choose line style (Solid/Dashed/Dotted)
This indicator helps identify key price levels where market participants have shown interest, making it valuable for trade planning and risk management

Volume Zones Internal Visualizer [LuxAlgo]The Volume Zones Internal Visualizer is an alternate candle type intended to reveal lower timeframe volume activity while on a higher timeframe chart.
It displays the candle's range, the highest and lowest zones of accumulated volume throughout the candle, and the Lower Timeframe (LTF) candle close, which contained the most volume in the session (Candle Session).
🔶 USAGE
The indicator is intended to be used as its own independent candle type. It is not a replacement for traditional candlesticks; however, it is recommended that you hide the chart's display when using this indicator. Another option is to display this indicator in an additional pane alongside the normal chart, as displayed above.
The display consists of candle ranges represented by outlined boxes, within the ranges you will notice a transparent-colored zone, a solid-colored zone, and a line.
Each of these displays different points of volume-related information from an analysis of LTF data.
In addition to this analysis, the indicator also locates the LTF candle with the highest volume, and displays its close represented by the line. This line is considered as the "Peak Activity Level" (PAL), since throughout the (HTF) candle session, this candle's close is the outcome of the most volume transacted at the time.
We are further tracking these PALs by continuing to extend them into the future, looking towards them for potential further interaction. Once a PAL is crossed, we are removing it from display as it has been mitigated.
🔶 DETAILS
The indicator aggregates the volume data from each LTF candle and creates a volume profile from it; the number of rows in the profile is determined by the "Row Size" setting.
With this profile, it locates and displays the highest (solid area) and lowest (transparent area) volume zones from the profile created.
🔶 SETTINGS
Row Size: Sets the number of rows used for the calculation of the volume profile based on LTF data.
Intrabar Timeframe: Sets the Lower Timeframe to use for calculations.
Show Last Unmitigated PALs: Choose how many Unmitigated PALs to extend.
Style: Toggle on and off features, as well as adjust colors for each.

Time Zone & SessionsDa las sesiones de London, New York, Asia y Austr.
Además un time zone incorporado para marcar días

Extended RunShows number of bar closing above SMA5 in serie if serie is more than a set value
(default = 6)

MOKI V1The "MOKI V1" script is a trading strategy on the TradingView platform that uses a combination of two key indicators to identify buy and sell signals:
EMA200 (Exponential Moving Average 200): Used to determine the overall market trend. This line helps ensure that trades are made in the direction of the primary market trend.
RSI (Relative Strength Index): Used to measure the strength or weakness of a trend. In this strategy, a reading above 50 for the RSI indicates stronger buy signals.
Engulfing Pattern: This candlestick pattern occurs when a green (bullish) candle completely engulfs the previous red (bearish) candle. It is used as a buy signal when combined with the other indicators.

Volatility Momentum Breakout StrategyDescription:
Overview:
The Volatility Momentum Breakout Strategy is designed to capture significant price moves by combining a volatility breakout approach with trend and momentum filters. This strategy dynamically calculates breakout levels based on market volatility and uses these levels along with trend and momentum conditions to identify trade opportunities.
How It Works:
1. Volatility Breakout:
• Methodology:
The strategy computes the highest high and lowest low over a defined lookback period (excluding the current bar to avoid look-ahead bias). A multiple of the Average True Range (ATR) is then added to (or subtracted from) these levels to form dynamic breakout thresholds.
• Purpose:
This method helps capture significant price movements (breakouts) while ensuring that only past data is used, thereby maintaining realistic signal generation.
2. Trend Filtering:
• Methodology:
A short-term Exponential Moving Average (EMA) is applied to determine the prevailing trend.
• Purpose:
Long trades are considered only when the current price is above the EMA, indicating an uptrend, while short trades are taken only when the price is below the EMA, indicating a downtrend.
3. Momentum Confirmation:
• Methodology:
The Relative Strength Index (RSI) is used to gauge market momentum.
• Purpose:
For long entries, the RSI must be above a mid-level (e.g., above 50) to confirm upward momentum, and for short entries, it must be below a similar threshold. This helps filter out signals during overextended conditions.
Entry Conditions:
• Long Entry:
A long position is triggered when the current closing price exceeds the calculated long breakout level, the price is above the short-term EMA, and the RSI confirms momentum (e.g., above 50).
• Short Entry:
A short position is triggered when the closing price falls below the calculated short breakout level, the price is below the EMA, and the RSI confirms momentum (e.g., below 50).
Risk Management:
• Position Sizing:
Trades are sized to risk a fixed percentage of account equity (set here to 5% per trade in the code, with each trade’s stop loss defined so that risk is limited to approximately 2% of the entry price).
• Stop Loss & Take Profit:
A stop loss is placed a fixed ATR multiple away from the entry price, and a take profit target is set to achieve a 1:2 risk-reward ratio.
• Realistic Backtesting:
The strategy is backtested using an initial capital of $10,000, with a commission of 0.1% per trade and slippage of 1 tick per bar—parameters chosen to reflect conditions faced by the average trader.
Important Disclaimers:
• No Look-Ahead Bias:
All breakout levels are calculated using only past data (excluding the current bar) to ensure that the strategy does not “peek” into future data.
• Educational Purpose:
This strategy is experimental and provided solely for educational purposes. Past performance is not indicative of future results.
• User Responsibility:
Traders should thoroughly backtest and paper trade the strategy under various market conditions and adjust parameters to fit their own risk tolerance and trading style before live deployment.
Conclusion:
By integrating volatility-based breakout signals with trend and momentum filters, the Volatility Momentum Breakout Strategy offers a unique method to capture significant price moves in a disciplined manner. This publication provides a transparent explanation of the strategy’s components and realistic backtesting parameters, making it a useful tool for educational purposes and further customization by the TradingView community.

Advanced Multi-Timeframe Trading System (Risk Managed)Description:
This strategy is an original approach that combines two main analytical components to identify potential trade opportunities while simulating realistic trading conditions:
1. Market Trend Analysis via an Approximate Hurst Exponent
• What It Does:
The strategy computes a rough measure of market trending using an approximate Hurst exponent. A value above 0.5 suggests persistent, trending behavior, while a value below 0.5 indicates a tendency toward mean-reversion.
• How It’s Used:
The Hurst exponent is calculated on both the chart’s current timeframe and a higher timeframe (default: Daily) to capture both local and broader market dynamics.
2. Fibonacci Retracement Levels
• What It Does:
Using daily high and low data from a selected timeframe (default: Daily), the script computes key Fibonacci retracement levels.
• How It’s Used:
• The 61.8% level (Golden Ratio) serves as a key threshold:
• A long entry is signaled when the price crosses above this level if the daily Hurst exponent confirms a trending market.
• The 38.2% level is used to identify short-entry opportunities when the price crosses below it and the daily Hurst indicates non-trending conditions.
Signal Logic:
• Long Entry:
When the price crosses above the 61.8% Fibonacci level (Golden Ratio) and the daily Hurst exponent is greater than 0.5, suggesting a trending market.
• Short Entry:
When the price crosses below the 38.2% Fibonacci level and the daily Hurst exponent is less than 0.5, indicating a less trending or potentially reversing market.
Risk Management & Trade Execution:
• Stop-Loss:
Each trade is risk-managed with a stop-loss set at 2% below (for longs) or above (for shorts) the entry price. This ensures that no single trade risks more than a small, sustainable portion of the account.
• Take Profit:
A take profit order targets a risk-reward ratio of 1:2 (i.e., the target profit is twice the amount risked).
• Position Sizing:
Trades are executed with a fixed position size equal to 10% of account equity.
• Trade Frequency Limits:
• Daily Limit: A maximum of 5 trades per day
• Overall Limit: No more than 510 trades during the backtesting period (e.g., since 2019)
These limits are imposed to simulate realistic trading frequency and to avoid overtrading in backtest results.
Backtesting Parameters:
• Initial Capital: $10,000
• Commission: 0.1% per trade
• Slippage: 1 tick per bar
These settings aim to reflect the conditions faced by the average trader and help ensure that the backtesting results are realistic and not misleading.
Chart Overlays & Visual Aids:
• Fibonacci Levels:
The key Fibonacci retracement levels are plotted on the chart, and the zone between the 61.8% and 38.2% levels is highlighted to show a key retracement area.
• Market Trend Background:
The chart background is tinted green when the daily Hurst exponent indicates a trending market (value > 0.5) and red otherwise.
• Information Table:
An on-chart table displays key parameters such as the current Hurst exponent, daily Hurst value, the number of trades executed today, and the global trade count.
Disclaimer:
Past performance is not indicative of future results. This strategy is experimental and provided solely for educational purposes. It is essential that you backtest and paper trade using your own settings before considering any live deployment. The Hurst exponent calculation is an approximation and should be interpreted as a rough gauge of market behavior. Adjust the parameters and risk management settings according to your personal risk tolerance and market conditions.
Additional Notes:
• Originality & Usefulness:
This script is an original mashup that combines trend analysis with Fibonacci retracement methods. The description above explains how these components work together to provide trading signals.
• Realistic Results:
The strategy uses realistic account sizes, commission rates, slippage, and risk management rules to generate backtesting results that are representative of real-world trading.
• Educational Purpose:
This script is intended to support the TradingView community by offering insights into combining multiple analysis techniques in one strategy. It is not a “get-rich-quick” system but rather an educational tool to help traders understand risk management and trade signal logic.
By using this script, you acknowledge that trading involves risk and that you are responsible for testing and adjusting the strategy to fit your own trading environment. This publication is fully open source, and any modifications should include proper attribution if significant portions of the code are reused.

Median Deviation Bands | QuantumResearchIntroducing QuantumResearch’s Median Deviation Bands Indicator
The Median Deviation Bands indicator is an advanced volatility-based tool designed to help traders identify price trends, market reversals, and potential trading opportunities.
By using a percentile-based median baseline combined with standard deviation bands, this indicator provides a dynamic framework for analyzing price movements and assessing market volatility.
How It Works
Baseline Calculation:
The median price over a user-defined period (default: 50) is calculated using the 50th percentile of price data.
This serves as the central reference point for trend analysis.
Trend Identification:
Bullish Trend: Occurs when the price crosses above the baseline.
Bearish Trend: Occurs when the price crosses below the baseline.
Deviation Bands:
The indicator plots three sets of upper and lower bands, representing 1x, 2x, and 3x standard deviations from the median.
These bands act as dynamic support and resistance zones, helping traders identify overbought and oversold conditions.
Visual Representation
The Median Deviation Bands indicator offers a clear, customizable visual layout:
Color-Coded Baseline:
Green (Bullish): Price is above the median.
Red (Bearish): Price is below the median.
Deviation Bands:
First Band (Light Fill): Represents 1 standard deviation from the baseline.
Second Band (Medium Fill): Represents 2 standard deviations, highlighting stronger trends.
Third Band (Dark Fill): Represents 3 standard deviations, showing extreme price conditions.
Trend Markers:
Green Up Arrows: Indicate the start of a bullish trend when price crosses above the baseline.
Red Down Arrows: Indicate the start of a bearish trend when price crosses below the baseline.
Customization & Parameters
The Median Deviation Bands indicator includes multiple user-configurable settings to adapt to different trading strategies:
Baseline Length: Default set to 50, determines the lookback period for median calculation.
Source Price: Selectable input price for calculations (default: close).
Band Visibility: Traders can toggle individual deviation bands on or off to match their preferences.
Trend Markers: Option to enable or disable up/down trend arrows.
Color Modes: Choose from eight color schemes to customize the indicator’s appearance.
Trading Applications
This indicator is highly versatile and can be applied to multiple trading strategies, including:
Volatility-Based Trading: Price movement within and outside the bands helps traders gauge volatility and market conditions.
Trend Following: The baseline and deviation bands help confirm ongoing trends.
Mean Reversion Strategies: Traders can look for price reactions at extreme bands (±3 standard deviations).
Final Note
QuantumResearch’s Median Deviation Bands indicator provides a unique approach to market analysis by integrating percentile-based median price levels with standard deviation-based volatility bands.
This combination helps traders understand price behavior in relation to historical volatility, making it a valuable tool for both trend-following and mean-reversion strategies.
As always, backtesting and customization are recommended to optimize performance across different market conditions.

Auto-Length Moving Average + Trend Signals (Zeiierman)█ Overview
The Auto-Length Moving Average + Trend Signals (Zeiierman) is an easy-to-use indicator designed to help traders dynamically adjust their moving average length based on market conditions. This tool adapts in real-time, expanding and contracting the moving average based on trend strength and momentum shifts.
The indicator smooths out price fluctuations by modifying its length while ensuring responsiveness to new trends. In addition to its adaptive length algorithm, it incorporates trend confirmation signals, helping traders identify potential trend reversals and continuations with greater confidence.
This indicator suits scalpers, swing traders, and trend-following investors who want a self-adjusting moving average that adapts to volatility, momentum, and price action dynamics.
█ How It Works
⚪ Dynamic Moving Average Length
The core feature of this indicator is its ability to automatically adjust the length of the moving average based on trend persistence and market conditions:
Expands in strong trends to reduce noise.
Contracts in choppy or reversing markets for faster reaction.
This allows for a more accurate moving average that aligns with current price dynamics.
⚪ Trend Confirmation & Signals
The indicator includes built-in trend detection logic, classifying trends based on market structure. It evaluates trend strength based on consecutive bars and smooths out transitions between bullish, bearish, and neutral conditions.
Uptrend: Price is persistently above the adjusted moving average.
Downtrend: Price remains below the adjusted moving average.
Neutral: Price fluctuates around the moving average, indicating possible consolidation.
⚪ Adaptive Trend Smoothing
A smoothing factor is applied to enhance trend readability while minimizing excessive lag. This balances reactivity with stability, making it easier to follow longer-term trends while avoiding false signals.
█ How to Use
⚪ Trend Identification
Bullish Trend: The indicator confirms an uptrend when the price consistently stays above the dynamically adjusted moving average.
Bearish Trend: A downtrend is recognized when the price remains below the moving average.
⚪ Trade Entry & Exit
Enter long when the dynamic moving average is green and a trend signal occurs. Exit when the price crosses below the dynamic moving average.
Enter short when the dynamic moving average is red and a trend signal occurs. Exit when the price crosses above the dynamic moving average.
█ Slope-Based Reset
This mode resets the trend counter when the moving average slope changes direction.
⚪ Interpretation & Insights
Best for trend-following traders who want to filter out noise and only reset when a clear shift in momentum occurs.
Higher slope length (N): More stable trends, fewer resets.
Lower slope length (N): More reactive to small price swings, frequent resets.
Useful in swing trading to track significant trend reversals.
█ RSI-Based Reset
The counter resets when the Relative Strength Index (RSI) crosses predefined overbought or oversold levels.
⚪ Interpretation & Insights
Best for reversal traders who look for extreme overbought/oversold conditions.
High RSI threshold (e.g., 80/20): Fewer resets, only extreme conditions trigger adjustments.
Lower RSI threshold (e.g., 60/40): More frequent resets, detecting smaller corrections.
Great for detecting exhaustion in trends before potential reversals.
█ Volume-Based Reset
A reset occurs when current volume significantly exceeds its moving average, signaling a shift in market participation.
⚪ Interpretation & Insights
Best for traders who follow institutional activity (high volume often means large players are active).
Higher volume SMA length: More stable trends, only resets on massive volume spikes.
Lower volume SMA length: More reactive to short-term volume shifts.
Useful in identifying breakout conditions and trend acceleration points.
█ Bollinger Band-Based Reset
A reset occurs when price closes above the upper Bollinger Band or below the lower Bollinger Band, signaling potential overextension.
⚪ Interpretation & Insights
Best for traders looking for volatility-based trend shifts.
Higher Bollinger Band multiplier (k = 2.5+): Captures only major price extremes.
Lower Bollinger Band multiplier (k = 1.5): Resets on moderate volatility changes.
Useful for detecting overextensions in strong trends before potential retracements.
█ MACD-Based Reset
A reset occurs when the MACD line crosses the signal line, indicating a momentum shift.
⚪ Interpretation & Insights
Best for momentum traders looking for trend continuation vs. exhaustion signals.
Longer MACD lengths (260, 120, 90): Captures major trend shifts.
Shorter MACD lengths (10, 5, 3): Reacts quickly to momentum changes.
Useful for detecting strong divergences and market shifts.
█ Stochastic-Based Reset
A reset occurs when Stochastic %K crosses overbought or oversold levels.
⚪ Interpretation & Insights
Best for short-term traders looking for fast momentum shifts.
Longer Stochastic length: Filters out false signals.
Shorter Stochastic length: Captures quick intraday shifts.
█ CCI-Based Reset
A reset occurs when the Commodity Channel Index (CCI) crosses predefined overbought or oversold levels. The CCI measures the price deviation from its statistical mean, making it a useful tool for detecting overextensions in price action.
⚪ Interpretation & Insights
Best for cycle traders who aim to identify overextended price deviations in trending or ranging markets.
Higher CCI threshold (e.g., ±200): Detects extreme overbought/oversold conditions before reversals.
Lower CCI threshold (e.g., ±10): More sensitive to trend shifts, useful for early signal detection.
Ideal for detecting momentum shifts before price reverts to its mean or continues trending strongly.
█ Momentum-Based Reset
A reset occurs when Momentum (Rate of Change) crosses zero, indicating a potential shift in price direction.
⚪ Interpretation & Insights
Best for trend-following traders who want to track acceleration vs. deceleration.
Higher momentum length: Captures longer-term shifts.
Lower momentum length: More responsive to short-term trend changes.
█ How to Interpret the Trend Strength Table
The Trend Strength Table provides valuable insights into the current market conditions by tracking how the dynamic moving average is adjusting based on trend persistence. Each metric in the table plays a role in understanding the strength, longevity, and stability of a trend.
⚪ Counter Value
Represents the current length of trend persistence before a reset occurs.
The higher the counter, the longer the current trend has been in place without resetting.
When this value reaches the Counter Break Threshold, the moving average resets and contracts to become more reactive.
Example:
A low counter value (e.g., 10) suggests a recent trend reset, meaning the market might be changing directions frequently.
A high counter value (e.g., 495) means the trend has been ongoing for a long time, indicating strong trend persistence.
⚪ Trend Strength
Measures how strong the current trend is based on the trend confirmation logic.
Higher values indicate stronger trends, while lower values suggest weaker trends or consolidations.
This value is dynamic and updates based on price action.
Example:
Trend Strength of 760 → Indicates a high-confidence trend.
Trend Strength of 50 → Suggests weak price action, possibly a choppy market.
⚪ Highest Trend Score
Tracks the strongest trend score recorded during the session.
Helps traders identify the most dominant trend observed in the timeframe.
This metric is useful for analyzing historical trend strength and comparing it with current conditions.
Example:
Highest Trend Score = 760 → Suggests that at some point, there was a strong trend in play.
If the current trend strength is much lower than this value, it could indicate trend exhaustion.
⚪ Average Trend Score
This is a rolling average of trend strength across the session.
Provides a bigger picture of how the trend strength fluctuates over time.
If the average trend score is high, the market has had persistent trends.
If it's low, the market may have been choppy or sideways.
Example:
Average Trend Score of 147 vs. Current Trend Strength of 760 → Indicates that the current trend is significantly stronger than the historical average, meaning a breakout might be occurring.
Average Trend Score of 700+ → Suggests a strong trending market overall.
█ Settings
⚪ Dynamic MA Controls
Base MA Length – Sets the starting length of the moving average before dynamic adjustments.
Max Dynamic Length – Defines the upper limit for how much the moving average can expand.
Trend Confirmation Length – The number of bars required to validate an uptrend or downtrend.
⚪ Reset & Adaptive Conditions
Reset Condition Type – Choose what triggers the moving average reset (Slope, RSI, Volume, MACD, etc.).
Trend Smoothing Factor – Adjusts how smoothly the moving average responds to price changes.
-----------------
Disclaimer
The content provided in my scripts, indicators, ideas, algorithms, and systems is for educational and informational purposes only. It does not constitute financial advice, investment recommendations, or a solicitation to buy or sell any financial instruments. I will not accept liability for any loss or damage, including without limitation any loss of profit, which may arise directly or indirectly from the use of or reliance on such information.
All investments involve risk, and the past performance of a security, industry, sector, market, financial product, trading strategy, backtest, or individual's trading does not guarantee future results or returns. Investors are fully responsible for any investment decisions they make. Such decisions should be based solely on an evaluation of their financial circumstances, investment objectives, risk tolerance, and liquidity needs.

AI Volume Breakout for scalpingPurpose of the Indicator
This script is designed for trading, specifically for scalping, which involves making numerous trades within a very short time frame to take advantage of small price movements. The indicator looks for volume breakouts, which are moments when trading volume significantly increases, potentially signaling the start of a new price movement.
Key Components:
Parameters:
Volume Threshold (volumeThreshold): Determines how much volume must increase from one bar to the next for it to be considered significant. Set at 4.0, meaning volume must quadruplicate for a breakout signal.
Price Change Threshold (priceChangeThreshold): Defines the minimum price change required for a breakout signal. Here, it's 1.5% of the bar's opening price.
SMA Length (smaLength): The period for the Simple Moving Average, which helps confirm the trend direction. Here, it's set to 20.
Cooldown Period (cooldownPeriod): Prevents signals from being too close together, set to 10 bars.
ATR Period (atrPeriod): The period for calculating Average True Range (ATR), used to measure market volatility.
Volatility Threshold (volatilityThreshold): If ATR divided by the close price exceeds this, the market is considered too volatile for trading according to this strategy.
Calculations:
SMA (Simple Moving Average): Used for trend confirmation. A bullish signal is more likely if the price is above this average.
ATR (Average True Range): Measures market volatility. Lower volatility (below the threshold) is preferred for this strategy.
Signal Generation:
The indicator checks if:
Volume has increased significantly (volumeDelta > 0 and volume / volume >= volumeThreshold).
There's enough price change (math.abs(priceDelta / open) >= priceChangeThreshold).
The market isn't too volatile (lowVolatility).
The trend supports the direction of the price change (trendUp for bullish, trendDown for bearish).
If all these conditions are met, it predicts:
1 (Bullish) if conditions suggest buying.
0 (Bearish) if conditions suggest selling.
Cooldown Mechanism:
After a signal, the script waits for a number of bars (cooldownPeriod) before considering another signal to avoid over-trading.
Visual Feedback:
Labels are placed on the chart:
Green label for bullish breakouts below the low price.
Red label for bearish breakouts above the high price.
How to Use:
Entry Points: Look for the labels on your chart to decide when to enter trades.
Risk Management: Since this is for scalping, ensure each trade has tight stop-losses to manage risk due to the quick, small movements.
Market Conditions: This strategy might work best in markets with consistent volume and price changes but not extreme volatility.
Caveats:
This isn't real AI; it's a heuristic based on volume and price. Actual AI would involve machine learning algorithms trained on historical data.
Always backtest any strategy, and consider how it behaves in different market conditions, not just the ones it was designed for.
Bollinger Bands Long Strategy
This strategy is designed for identifying and executing long trades based on Bollinger Bands and RSI. It aims to capitalize on potential oversold conditions and subsequent price recovery.
Key Features:
- Bollinger Bands (10,2): The strategy uses Bollinger Bands with a 10-period moving average and a multiplier of 2 to define price volatility.
- RSI Filter: A trade is only triggered when the RSI (14-period) is below 30, ensuring entry during oversold conditions.
- Entry Condition: A long trade is entered immediately when the price crosses below the lower Bollinger Band and the RSI is under 30.
- Exit Condition: The position is exited when the price reaches or crosses above the Bollinger Band basis (20-period moving average).
Best Used For:
- Identifying oversold conditions with a strong potential for a rebound.
- Markets or assets with clear oscillations and volatility e.g., BTC.
**Disclaimer:** This strategy is for educational purposes and should be used with caution. Backtesting and risk management are essential before live trading.
