Trendline Breakout Navigator [LuxAlgo]The Trendline Breakout Navigator indicator shows three trendlines, representing trends of different significance between Swing Points.
Dots highlight a Higher Low (HL) or Lower High (LH) that pierces through the Trendline without the closing price breaking the Trendline.
A bar color and background color option is included, which offers insights into the price against the trendlines.
🔶 USAGE
Trendlines (TL) are drawn, starting as a horizontal line from a Swing Point.
When an HL (in the case of a bullish TL) or an LH (bearish TL) is found, this Swing Point is connected to the first Swing Point. In both cases, the TL can be optimized when one or more historical close prices breach the TL (see DETAILS).
A solid-styled long-term trendline represents the overall market direction, while a dashed-styled medium-term trendline captures medium-term movements within the long-term trend. Finally, a dotted-styled short-term trendline tracks short-term fluctuations.
🔹 Swing Points vs. Trend
A "Higher High" (HH) or "Lower Low" (LL) will initialize a new trendline, respectively, starting from the previous "Swing Low" or Swing High".
To spot the trend shift, "HH/LL" labels and an optional background color are included. They can be enabled/disabled or set at "Long, Medium, or Short" term TL (Settings—"MS", "HH/LL" and "Background Color").
These features are linked to one Trendline of choice only.
Where the "HH/LL" labels can show a potential trend shift, the background color is:
Green from the moment the close price breaks above a bearish trendline or when an HH occurs
Red from the moment the close price breaks below a bullish trendline or when an LL occurs
🔹 Bar Color
The bar color will depend on the location of the closing price against the three trendlines. When a trendline is unavailable (for example, if the close price breaks the TL and there is no HH/LL), the last known trendline value will be considered.
All three trendlines influence the bar color.
If the close price is above the "Long Term" TL, the bar color will show a gradient of green, darker when the close price is below the "Medium Term" and/or "Short Term" TLs.
On the other hand, when the close price is below the "Long Term" TL, the bar color will show a gradient of red, which becomes darker when the close price is above the "Medium Term" and/or "Short Term" TLs.
To keep the above example simple, only the "Long Term" TL is considered. The white line (not included in the script) resembles the actual value of the TL at each bar, where you can see the effect on the bar color.
Combined with the trendlines and dots, the bar color can provide extra depth and insights into the underlying trends.
🔹 Tested Trendlines
If a new HL/LH pierces the Trendline without the close price breaking the Trendline, the Trendline will be updated.
The exact location where the price exceeded the Trendline is visualized by a dot, colored blue on a bullish trendline and orange when bearish.
These dots can be indicative of a potential trend continuation or reversal.
🔹 Higher TimeFrame Option
The "Period" setting enables users to visualize higher-timeframe trendlines as long as the line length doesn't exceed 5000 bars.
🔶 DETAILS
When a new trendline is drawn, the script first draws a preliminary line and then checks whether a historical close price exceeded this line above (in the case of a bearish TL) or below (in a bullish case).
Subsequently, the most valid point in between is chosen as the starting point of the Trendline.
🔶 SETTINGS
Period: Choose "chart" for trendlines from the current chart timeframe, or choose a higher timeframe
🔹 Swing Length
Toggle and Swing Length for three trendlines: Period used for the swing detection, with higher values returning longer-term Swing Levels.
🔹 Style
Trendline: color for bullish/bearish Trendline
Wick Dot: color for bullish/bearish trendline test
Term: Long-, medium- or short-term
HH/LL: Show HH/LL labels (with or without previous Swing High/Low) of chosen Term
Background Color: Green when the closing price is above the trendline of choice, red otherwise
Bar Color
Индикаторы и стратегии

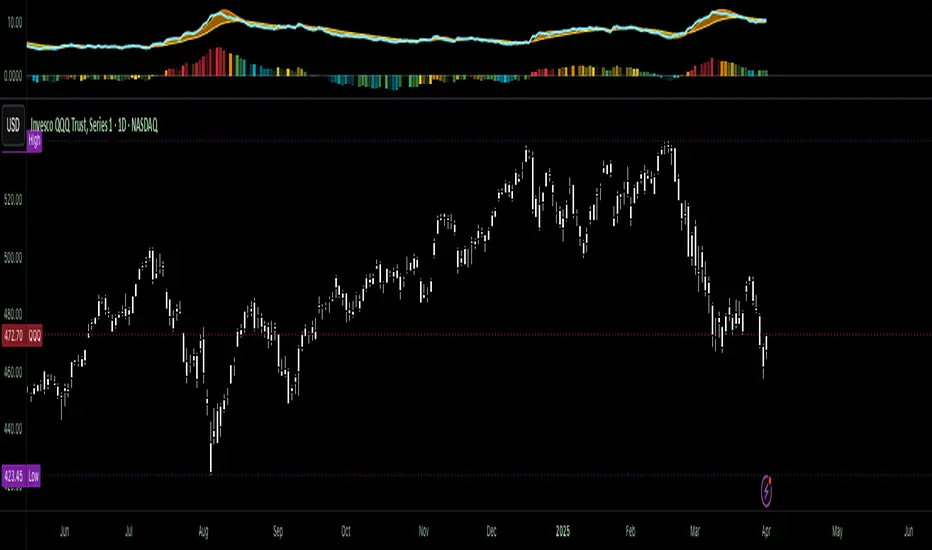
Uptrick: Z-Score FlowOverview
Uptrick: Z-Score Flow is a technical indicator that integrates trend-sensitive momentum analysi s with mean-reversion logic derived from Z-Score calculations. Its primary objective is to identify market conditions where price has either stretched too far from its mean (overbought or oversold) or sits at a statistically “normal” range, and then cross-reference this observation with trend direction and RSI-based momentum signals. The result is a more contextual approach to trade entry and exit, emphasizing precision, clarity, and adaptability across varying market regimes.
Introduction
Financial instruments frequently transition between trending modes, where price extends strongly in one direction, and ranging modes, where price oscillates around a central value. A simple statistical measure like Z-Score can highlight price extremes by comparing the current price against its historical mean and standard deviation. However, such extremes alone can be misleading if the broader market structure is trending forcefully. Uptrick: Z-Score Flow aims to solve this gap by combining Z-Score with an exponential moving average (EMA) trend filter and a smoothed RSI momentum check, thus filtering out signals that contradict the prevailing market environment.
Purpose
The purpose of this script is to help traders pinpoint both mean-reversion opportunities and trend-based pullbacks in a way that is statistically grounded yet still mindful of overarching price action. By pairing Z-Score thresholds with supportive conditions, the script reduces the likelihood of acting on random price spikes or dips and instead focuses on movements that are significant within both historical and current contextual frameworks.
Originality and Uniquness
Layered Signal Verification: Signals require the fulfillment of multiple layers (Z-Score extreme, EMA trend bias, and RSI momentum posture) rather than merely breaching a statistical threshold.
RSI Zone Lockout: Once RSI enters an overbought/oversold zone and triggers a signal, the script locks out subsequent signals until RSI recovers above or below those zones, limiting back-to-back triggers.
Controlled Cooldown: A dedicated cooldown mechanic ensures that the script waits a specified number of bars before issuing a new signal in the opposite direction.
Gradient-Based Visualization: Distinct gradient fills between price and the Z-Mean line enhance readability, showing at a glance whether price is trading above or below its statistical average.
Comprehensive Metrics Panel: An optional on-chart table summarizes the Z-Score’s key metrics, streamlining the process of verifying current statistical extremes, mean levels, and momentum directions.
Why these indicators were merged
Z-Score measurements excel at identifying when price deviates from its mean, but they do not intrinsically reveal whether the market’s trajectory supports a reversion or if price might continue along its trend. The EMA, commonly used for spotting trend directions, offers valuable insight into whether price is predominantly ascending or descending. However, relying solely on a trend filter overlooks the intensity of price moves. RSI then adds a dedicated measure of momentum, helping confirm if the market’s energy aligns with a potential reversal (for example, price is statistically low but RSI suggests looming upward momentum). By uniting these three lenses—Z-Score for statistical context, EMA for trend direction, and RSI for momentum force—the script offers a more comprehensive and adaptable system, aiming to avoid false positives caused by focusing on just one aspect of price behavior.
Calculations
The core calculation begins with a simple moving average (SMA) of price over zLen bars, referred to as the basis. Next, the script computes the standard deviation of price over the same window. Dividing the difference between the current price and the basis by this standard deviation produces the Z-Score, indicating how many standard deviations the price is from its mean. A positive Z-Score reveals price is above its average; a negative reading indicates the opposite.
To detect overall market direction, the script calculates an exponential moving average (emaTrend) over emaTrendLen bars. If price is above this EMA, the script deems the market bullish; if below, it’s considered bearish. For momentum confirmation, the script computes a standard RSI over rsiLen bars, then applies a smoothing EMA over rsiEmaLen bars. This smoothed RSI (rsiEma) is monitored for both its absolute level (oversold or overbought) and its slope (the difference between the current and previous value). Finally, slopeIndex determines how many bars back the script compares the basis to check whether the Z-Mean line is generally rising, falling, or flat, which then informs the coloring scheme on the chart.
Calculations and Rational
Simple Moving Average for Baseline: An SMA is used for the core mean because it places equal weight on each bar in the lookback period. This helps maintain a straightforward interpretation of overbought or oversold conditions in the context of a uniform historical average.
Standard Deviation for Volatility: Standard deviation measures the variability of the data around the mean. By dividing price’s difference from the mean by this value, the Z-Score can highlight whether price is unusually stretched given typical volatility.
Exponential Moving Average for Trend: Unlike an SMA, an EMA places more emphasis on recent data, reacting quicker to new price developments. This quicker response helps the script promptly identify trend shifts, which can be crucial for filtering out signals that go against a strong directional move.
RSI for Momentum Confirmation: RSI is an oscillator that gauges price movement strength by comparing average gains to average losses over a set period. By further smoothing this RSI with another EMA, short-lived oscillations become less influential, making signals more robust.
SlopeIndex for Slope-Based Coloring: To clarify whether the market’s central tendency is rising or falling, the script compares the basis now to its level slopeIndex bars ago. A higher current reading indicates an upward slope; a lower reading, a downward slope; and similar readings, a flat slope. This is visually represented on the chart, providing an immediate sense of the directionality.
Inputs
zLen (Z-Score Period)
Specifies how many bars to include for computing the SMA and standard deviation that form the basis of the Z-Score calculation. Larger values produce smoother but slower signals; smaller values catch quick changes but may generate noise.
emaTrendLen (EMA Trend Filter)
Sets the length of the EMA used to detect the market’s primary direction. This is pivotal for distinguishing whether signals should be considered (price aligning with an uptrend or downtrend) or filtered out.
rsiLen (RSI Length)
Defines the window for the initial RSI calculation. This RSI, when combined with the subsequent smoothing EMA, forms the foundation for momentum-based signal confirmations.
rsiEmaLen (EMA of RSI Period)
Applies an exponential moving average over the RSI readings for additional smoothing. This step helps mitigate rapid RSI fluctuations that might otherwise produce whipsaw signals.
zBuyLevel (Z-Score Buy Threshold)
Determines how negative the Z-Score must be for the script to consider a potential oversold signal. If the Z-Score dives below this threshold (and other criteria are met), a buy signal is generated.
zSellLevel (Z-Score Sell Threshold)
Determines how positive the Z-Score must be for a potential overbought signal. If the Z-Score surpasses this threshold (and other checks are satisfied), a sell signal is generated.
cooldownBars (Cooldown (Bars))
Enforces a bar-based delay between opposite signals. Once a buy signal has fired, the script must wait the specified number of bars before registering a new sell signal, and vice versa.
slopeIndex (Slope Sensitivity (Bars))
Specifies how many bars back the script compares the current basis for slope coloration. A bigger slopeIndex highlights larger directional trends, while a smaller number emphasizes shorter-term shifts.
showMeanLine (Show Z-Score Mean Line)
Enables or disables the plotting of the Z-Mean and its slope-based coloring. Traders who prefer minimal chart clutter may turn this off while still retaining signals.
Features
Statistical Core (Z-Score Detection):
This feature computes the Z-Score by taking the difference between the current price and the basis (SMA) and dividing by the standard deviation. In effect, it translates price fluctuations into a standardized measure that reveals how significant a move is relative to the typical variation seen over the lookback. When the Z-Score crosses predefined thresholds (zBuyLevel for oversold and zSellLevel for overbought), it signals that price could be at an extreme.
How It Works: On each bar, the script updates the SMA and standard deviation. The Z-Score is then refreshed accordingly. Traders can interpret particularly large negative or positive Z-Score values as scenarios where price is abnormally low or high.
EMA Trend Filter:
An EMA over emaTrendLen bars is used to classify the market as bullish if the price is above it and bearish if the price is below it. This classification is applied to the Z-Score signals, accepting them only when they align with the broader price direction.
How It Works: If the script detects a Z-Score below zBuyLevel, it further checks if price is actually in a downtrend (below EMA) before issuing a buy signal. This might seem counterintuitive, but a “downtrend” environment plus an oversold reading often signals a potential bounce or a mean-reversion play. Conversely, for sell signals, the script checks if the market is in an uptrend first. If it is, an overbought reading aligns with potential profit-taking.
RSI Momentum Confirmation with Oversold/Overbought Lockout:
RSI is calculated over rsiLen, then smoothed by an EMA over rsiEmaLen. If this smoothed RSI dips below a certain threshold (for example, 30) and then begins to slope upward, the indicator treats it as a potential sign of recovering momentum. Similarly, if RSI climbs above a certain threshold (for instance, 70) and starts to slope downward, that suggests dwindling momentum. Additionally, once RSI is in these zones, the indicator locks out repetitive signals until RSI fully exits and re-enters those extreme territories.
How It Works: Each bar, the script measures whether RSI has dropped below the oversold threshold (like 30) and has a positive slope. If it does, the buy side is considered “unlocked.” For sell signals, RSI must exceed an overbought threshold (70) and slope downward. The combination of threshold and slope helps confirm that a reversal is genuinely in progress instead of issuing signals while momentum remains weak or stuck in extremes.
Cooldown Mechanism:
The script features a custom bar-based cooldown that prevents issuing new signals in the opposite direction immediately after one is triggered. This helps avoid whipsaw situations where the market quickly flips from oversold to overbought or vice versa.
How It Works: When a buy signal fires, the indicator notes the bar index. If the Z-Score and RSI conditions later suggest a sell, the script compares the current bar index to the last buy signal’s bar index. If the difference is within cooldownBars, the signal is disallowed. This ensures a predefined “quiet period” before switching signals.
Slope-Based Coloring (Z-Mean Line and Shadow):
The script compares the current basis value to its value slopeIndex bars ago. A higher reading now indicates a generally upward slope, while a lower reading indicates a downward slope. The script then shades the Z-Mean line in a corresponding bullish or bearish color, or remains neutral if little change is detected.
How It Works: This slope calculation is refreshingly straightforward: basis – basis . If the result is positive, the line is colored bullish; if negative, it is colored bearish; if approximately zero, it remains neutral. This provides a quick visual cue of the medium-term directional bias.
Gradient Overlays:
With gradient fills, the script highlights where price stands in relation to the Z-Mean. When price is above the basis, a purple-shaded region is painted, visually indicating a “bearish zone” for potential overbought conditions. When price is below, a teal-like overlay is used, suggesting a “bullish zone” for potential oversold conditions.
How It Works: Each bar, the script checks if price is above or below the basis. It then applies a fill between close and basis, using distinct colors to show whether the market is trading above or below its mean. This creates an immediate sense of how extended the market might be.
Buy and Sell Labels (with Alerts):
When a legitimate buy or sell condition passes every check (Z-Score threshold, EMA trend alignment, RSI gating, and cooldown clearance), the script plots a corresponding label directly on the chart. It also fires an alert (if alerts are set up), making it convenient for traders who want timely notifications.
How It Works: If rawBuy or rawSell conditions are met (refined by RSI, EMA trend, and cooldown constraints), the script calls the respective plot function to paint an arrow label on the chart. Alerts are triggered simultaneously, carrying easily recognizable messages.
Metrics Table:
The optional on-chart table (activated by showMetrics) presents real-time Z-Score data, including the current Z-Score, its rolling mean, the maximum and minimum Z-Score values observed over the last zLen bars, a percentile position, and a short-term directional note (rising, falling, or flat).
Current – The present Z-Score reading
Mean – Average Z-Score over the zLen period
Min/Max – Lowest and highest Z-Score values within zLen
Position – Where the current Z-Score sits between the min and max (as a percentile)
Trend – Whether the Z-Score is increasing, decreasing, or flat
Conclusion
Uptrick: Z-Score Flow offers a versatile solution for traders who need a statistically informed perspective on price extremes combined with practical checks for overall trend and momentum. By leveraging a well-defined combination of Z-Score, EMA trend classification, RSI-based momentum gating, slope-based visualization, and a cooldown mechanic, the script reduces the occurrence of false or premature signals. Its gradient fills and optional metrics table contribute further clarity, ensuring that users can quickly assess market posture and make more confident trading decisions in real time.
Disclaimer
This script is intended solely for informational and educational purposes. Trading in any financial market comes with substantial risk, and there is no guarantee of success or the avoidance of loss. Historical performance does not ensure future results. Always conduct thorough research and consider professional guidance prior to making any investment or trading decisions.

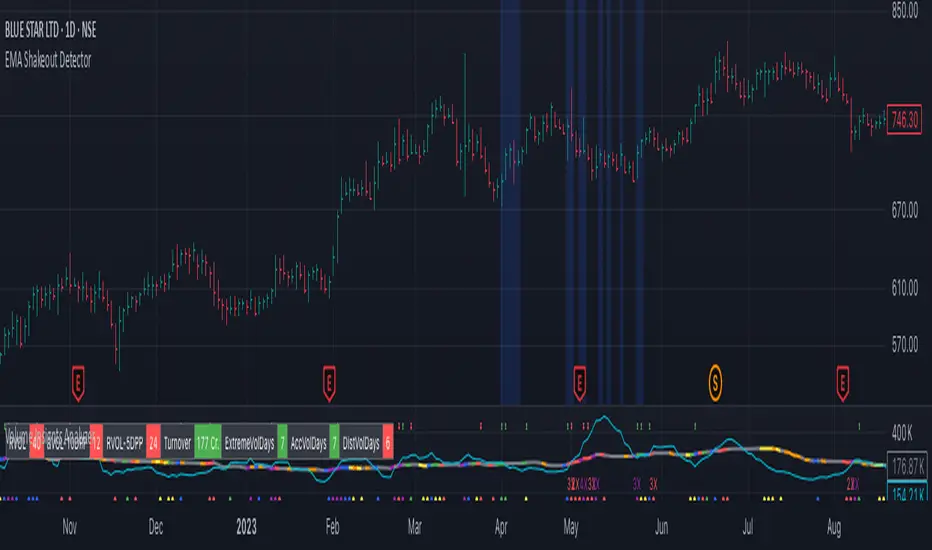
EMA Shakeout DetectorEMA Shakeout & Reclaim Zones
Description:
This Pine Script helps traders quickly identify potential shakeout entries based on price action and volume dynamics. Shakeouts often signal strong accumulation, where institutions drive the stock below a key moving average before reclaiming it, creating an opportunity for traders to enter at favorable prices.
How It Works:
1. Volume Surge Filtering:
a. Computes the 51-day Simple Moving Average (SMA) of volume.
b. Identifies days where volume surged 2x above the 51-day average.
c. Filters stocks that had at least two such high-volume days in the last 21 trading days (configurable).
2. Stock Selection Criteria:
a. The stock must be within 25% of its 52-week high.
b. It should have rallied at least 30% from its 52-week low.
Shakeout Conditions:
1. The stock must be trading above the 51-day EMA before the shakeout.
2. A sudden price drop of more than 10% occurs, pushing the stock below the 51-day EMA.
3. A key index (e.g., Nifty 50, S&P 500) must be trading above its 10-day EMA, ensuring overall market strength.
Visualization:
Shakeout zones are highlighted in blue, making it easier to spot potential accumulation areas and study price & volume action in more detail.
This script is ideal for traders looking to identify institutional shakeouts and gain an edge by recognizing high-probability reversal setups.
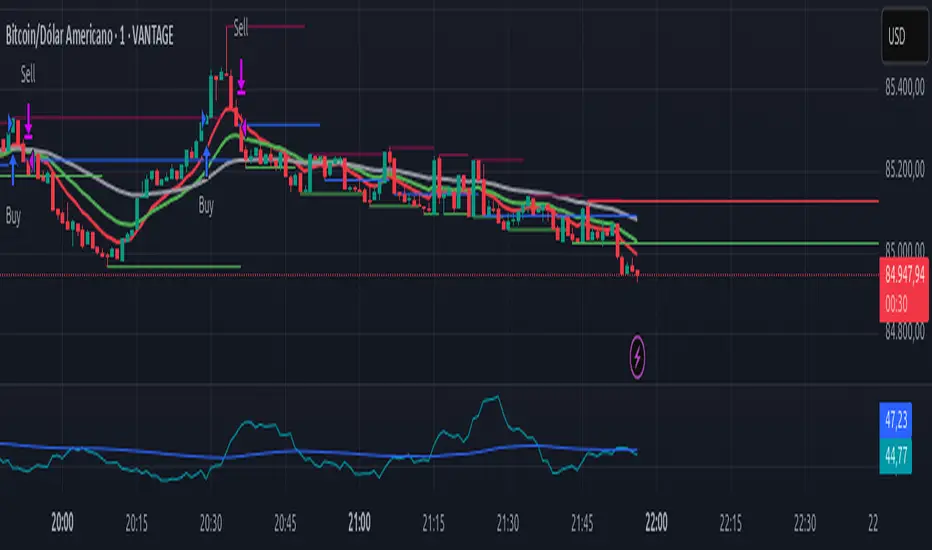
Advanced HFT Detection with VWAP & SpreadsExplanation of the HFT Detection Strategy
🔹 1. Key Indicators Used in the Strategy
It's works by combining VWAP, moving averages (SMA), volume spikes, and price jumps to detect potential HFT activity.
✅ (A) VWAP (Volume Weighted Average Price)
VWAP acts as a benchmark price that professional traders and institutions use to execute large orders.
If price is above VWAP, buyers are in control → Bullish trend
If price is below VWAP, sellers are in control → Bearish trend
HFT algorithms often place buy orders above VWAP and sell orders below VWAP to follow momentum.
➡️ Why VWAP? It ensures that signals follow the institutional trading trend.
✅ (B) Moving Averages (SMA)
Moving averages smooth out price data and help in detecting short-term momentum changes.
Fast Moving Average (5-period SMA): Reacts quickly to price changes
Slow Moving Average (20-period SMA): Identifies trend direction
➡️ Why SMA? It filters noise and confirms short-term trend shifts.
✅ (C) Volume Spike Detection
High-frequency trading is often accompanied by large volume surges. We define a volume spike as:
📌 Current Volume > 2× Average Volume of last 20 bars
➡️ Why Volume? HFTs execute rapid buy/sell orders when they detect liquidity, leading to sudden volume bursts.
✅ (D) Price Jump Detection (Sudden Volatility)
HFT algorithms often exploit quick price movements. We check if the price has moved more than twice the ATR (Average True Range) in the last 5 bars.
➡️ Why ATR? It helps to detect abnormal price movements compared to normal volatility.
🔹 2. Trading Signal Logic
Now that we have VWAP, moving averages, volume, and price movement filters, we generate buy and sell signals based on conditions.
✅ (A) Buy Signal Condition
A BUY signal is triggered when:
✔ Fast SMA crosses above Slow SMA → Short-term trend is turning bullish
✔ Volume spike occurs → HFTs are active
✔ Sudden price jump detected → High volatility
✔ Price is above VWAP → Confirms bullish trend
➡️ Why this works? It confirms that institutional traders & HFTs are buying aggressively.
✅ (B) Sell Signal Condition
A SELL signal is triggered when:
✔ Fast SMA crosses below Slow SMA → Short-term trend is turning bearish
✔ Volume spike occurs → HFTs are selling aggressively
✔ Sudden price drop detected → High volatility
✔ Price is below VWAP → Confirms bearish trend
➡️ Why this works? It confirms that institutional traders & HFTs are selling aggressively.
🔹 3. Visual Representation (Plotting Signals & VWAP)
Once we detect buy and sell signals, we mark them on the chart.
✅ (A) Buy/Sell Markers
🟢 Buy → Green upward arrow below the candle
🔴 Sell → Red downward arrow above the candle
✅ (B) VWAP Line on Chart
We also plot VWAP as a blue line to visualize trend direction.
✅ (C) Highlighting Volume Spikes
To easily spot HFT activity, we highlight volume spike bars with a blue background.
🔹 4. How to Use This Strategy?
1️⃣ Apply this script on a 1-minute or 5-minute intraday chart.
2️⃣ Look for BUY signals above VWAP and SELL signals below VWAP.
3️⃣ Verify that the volume spikes before taking action.
4️⃣ Use stop-loss & risk management (e.g., stop-loss at recent low/high).
🚀 Summary: Why This Strategy Works?
✅ VWAP ensures we follow institutional traders
✅ Volume spikes confirm sudden liquidity inflows
✅ Price jumps detect fast market moves caused by HFT bots
✅ Moving averages smooth out short-term trend shifts

Pearson Correlation [Mr_Rakun] Pearson Correlation
This script calculates the Pearson correlation coefficient (r) between the closing price of the current asset and another selected asset.
🔍 How It Works:
• The user selects a correlation period (default: 20) and a symbol (default: ETH/USDT).
• The script retrieves the closing prices of both assets.
• The Pearson correlation formula is applied:
r = \frac{n(\sum xy) - (\sum x)(\sum y)}{\sqrt{ }}
• The correlation is plotted as a histogram:
• +1 (green line) → Perfect positive correlation
• -1 (red line) → Perfect negative correlation
• 0 (gray line) → No correlation
📊 Why Use This?
This indicator helps traders identify relationships between assets, such as whether two markets move together or inversely. It is useful for hedging strategies, portfolio diversification, and market comparisons.

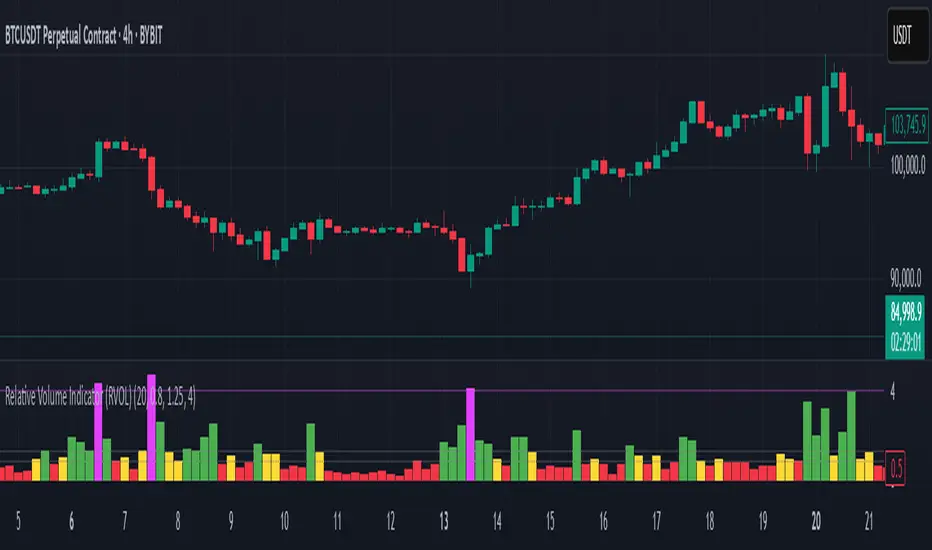
Relative Volume Indicator (RVOL)Relative Volume Indicator (RVOL)
The Relative Volume Indicator (RVOL) helps traders identify unusual volume activity by comparing the current volume to the average historical volume. This makes it easier to spot potential breakouts, reversals, or significant market events that are accompanied by volume confirmation.
What This Indicator Shows
This indicator displays volume as a multiple of average volume, where:
- 1.0x means 100% of average volume
- 2.0x means 200% of average volume (twice the average)
- 0.5x means 50% of average volume (half the average)
Color Coding
The volume bars are color-coded based on configurable thresholds:
- Red: Below average volume (< Average Volume Threshold)
- Yellow: Average volume (between Average Volume and Above Average thresholds)
- Green: Above average volume (between Above Average and Extreme thresholds)
- Magenta: Extreme volume (> Extreme Volume Threshold)
Horizontal Reference Lines
Three dotted horizontal reference lines help you visualize the thresholds:
- Lower gray line: Average Volume Threshold (default: 0.8x)
- Upper gray line: Above Average Threshold (default: 1.25x)
- Magenta line: Extreme Volume Threshold (default: 4.0x)
How To Use This Indicator
1. Volume Confirmation: Use green bars to confirm breakouts or trend changes - stronger moves often come with above-average volume.
2. Low Volume Warning: Red bars during price movements may indicate weak conviction and potential reversals.
3. Extreme Volume Events: Magenta bars (extreme volume) often signal major market events or potential exhaustion points that could lead to reversals.
4. Volume Divergence: Look for divergences between price and volume - for example, if price makes new highs but volume is decreasing (more yellow/red bars), the move may be losing strength.
Settings Configuration
- Average Volume Lookback Period: Number of bars used to calculate the average volume (default: 20)
- Average Volume Threshold: Volume below this level is considered below average (default: 0.8x)
- Above Average Threshold: Volume above this level is considered above average (default: 1.25x)
- Extreme Volume Threshold: Volume above this level is considered extreme (default: 4.0x)
- Colors: Customize colors for each volume category
Important Note: Adjust threshold values only through the indicator settings (not in the Style tab). Changing values in the Style tab will not adjust the coloring of the volume bars.
Adjust these settings based on the specific asset being analyzed and your trading timeframe. More volatile assets may require higher thresholds, while less volatile ones might need lower thresholds.
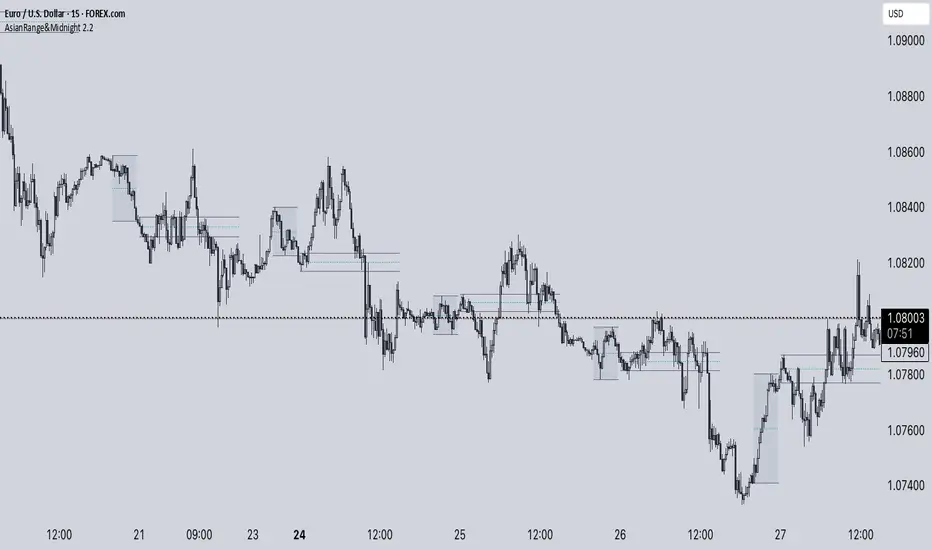
AsianRange&Midnight 2.2### Midnight Setup: Trading Strategy
#### **Bias Definition (Trend Identification)**
- The Daily (D) bias is defined the previous day and validated on the line chart.
- On the Daily chart, identify the nearest V-shaped formation that has broken close to the current price. This formation determines the Daily bias direction.
#### **H4 Bias Analysis (Trend Confirmation)**
- Switch to an H4 chart to refine the analysis.
- Identify a similar V-shaped formation that has broken in the H4 timeframe.
- If the Daily and H4 biases are aligned, the setup is valid.
#### **Entry Strategy (Position Entries)**
- **Bearish Bias (D and H4 identical):**
- Short entry at the high level of the Midnight range.
- **Bullish Bias (D and H4 identical):**
- Long entry at the low level of the Midnight range.
#### **Bias Divergence (Context Adaptation)**
- If the H4 bias is opposite to the Daily bias, this indicates an H4 retracement of the Daily bias.
- Enter a counter-trend trade with reduced risk.
- No TP target beyond 50% of the extension validating the Daily break. It is also not recommended to enter against this divergence beyond 50%.
#### **Divergence Scenarios (Reactions to Divergences)**
- **Daily Bearish Bias, H4 Bullish Bias:**
- Long entry at the Midnight Low.
- **Daily Bullish Bias, H4 Bearish Bias:**
- Short entry at the Midnight High.
#### **Daily Bias Resumption (Trend Alignment)**
- As soon as the H4 bias resumes the Daily bias direction, follow this trend and adjust the position accordingly.
#### **Instructions for Divergent Bias (Managing Divergence)**
- When holding a position with a divergent bias, it is crucial to manage it carefully.
- Exit counter-trend trades as soon as the H4 bias realigns with the Daily bias.
- Limit the duration of counter-trend trades per session and adjust the H4 bias for the next session if needed.
#### **SL/TP Management (Profit Taking and Protection Optimization)**
- **Take Profit (TP):**
- Entry in M15 with a minimum RR of 3.
- TP at 5H NYE, or RR 5, or 15H NYE.
- **Stop Loss (SL):**
- Minimum 15 pips, placed just above the nearest swing to the entry point to protect capital.
- **Red Announcement Days:**
- Either abstain from trading or set a 40-pip SL to limit volatility impact.
- **At 6H/7H NYE:**
- Manage the trade based on its progress: exit, set to BE (Break Even), or keep the SL in place.
- Any SL adjustment outside these rules can only be made if supported by data or backtests.
#### **Risk Management (Capital Protection)**
- Maximum risk of **1% of capital per trade** (allowing for **10 consecutive losses** without significantly affecting capital).
- In case of a loss, **reduce risk by 50% on the next trade** until the loss is recovered.
#### **Efficiency Conditions (When This Setup Works Best)**
- This setup is particularly effective in **strong trends**, where the market has a clear direction.
- It is **less effective in ranging markets**, where prices move within a narrow range without a clear trend.
Setup Midnight : Stratégie de Trading
SUPeR TReND 2.718An evolved version of the classic Supertrend, SUPeR TReND 2.718 is built to deliver elegant, high-precision trend detection using Euler's constant (e = 2.718) as its default multiplier. Designed for clarity and visual flow, this indicator brings together smooth line work, intelligent color logic, and a minimalistic tally system that tracks trend persistence — all in a highly customizable, overlay-ready format.
Unlike traditional implementations, this version maintains line visibility regardless of fill opacity, ensuring crisp tracking even in complex environments. Ideal for traders who value both aesthetics and actionable structure.
__________________________________________________________
🔑 Key Features:
- 📐 ATR-based Supertrend with default multiplier = e (2.718)
- 📉 Dynamic trend line with optional fill beneath price
- ⏳ Trend duration tally label (count-only or full format)
- ⬆️ Higher-timeframe Supertrend overlay (optional)
- 🟢 Directional candle coloring for clarity
- 🟡 Subtle anchor line to guide perception without clutter
- ⚙️ PineScript v6 compliant, efficient and modular
__________________________________________________________
🧠 Interpretation Guide:
- The Supertrend line tracks trend support or resistance — beneath price in uptrends, above in downtrends.
- The shaded fill reflects direction with 70% transparency.
- The trend tally label counts how long the current trend has lasted.
- Candle colors confirm direction without overtaking price action.
- The optional HTF line shows higher-timeframe context.
- A soft yellow anchor line stabilizes the fill relationship without distraction.
__________________________________________________________
⚙️ Inputs & Controls:
- ✏️ ATR Length – Volatility lookback
- 🧮 Multiplier – Default = 2.718 (Euler's number)
- 🕰️ Higher Timeframe – Choose your bias frame
- 👁️ Show HTF / Main – Toggle each trend layer
- 🧾 Show Label / Simplify – Show trend duration, with or without arrows
- 🎨 Color Candles – Turn directional bar coloring on or off
- 🪄 Show Fill – Toggle the shaded visual rhythm
- 🎛️ All visuals use tuned colors and transparencies for clarity
__________________________________________________________
🚀 Best Practices:
- ✅ Works on any time frame; shines on 1h v. 1D
- 🔁 Use the HTF line for macro bias filtering
- 📊 Combine with volume or liquidity overlays for edge
- 🧱 Use as a structural base layer with minimalist stacks
__________________________________________________________
📈 Strategy Tips:
- 🧭 MTF Trend Alignment: Enable the HTF line to filter trades. If the HTF trend is up, only take longs on the lower frame, and vice versa.
- 🔁 Pullback Entries: During a strong trend, consider short-term dips below the Supertrend line as possible re-entry zones — only if HTF remains aligned.
- ⏳ Tally for Exhaustion: When the bar count exceeds 15+, look for confluence (volume divergence, key levels, reversal signals).
- ⚠️ HTF Flip + Extended Trend: When the HTF trend reverses while the main trend is extended, that may be a macro exit or fade signal.
- 🚫 Solo Mode: Disable HTF and use the main trend + tally as a standalone signal layer.
- 🧠 Swing Setup Friendly: Especially powerful on 1D or 1h in swing systems or trend-based grid strategies.

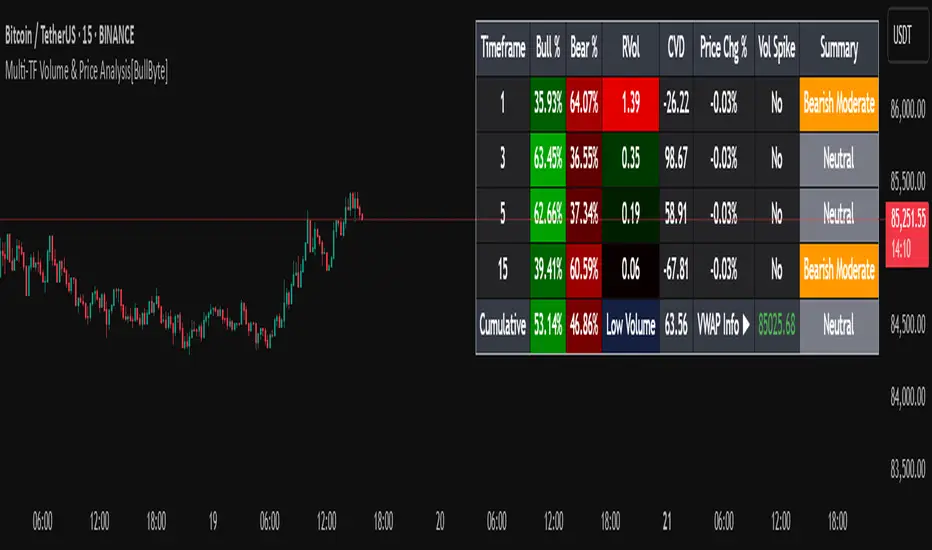
Multi-TF Volume & Price Analysis[BullByte]This indicator offers a comprehensive view of market dynamics by combining volume and price analysis across multiple timeframes. It calculates key metrics—such as bullish/bearish volume percentages, relative volume (RVol), cumulative volume delta (CVD), and price change percentages—for each timeframe that you choose (for example, 1, 3, 5, and 15 minutes). Here are the main features in simple terms:
- Multi-Timeframe Analysis:
The tool analyzes volume and price action from four different timeframes simultaneously. This means you get insights from short-term and slightly longer-term trends in one view.
- Volume Breakdown:
It splits the volume into bullish and bearish parts by comparing closing and opening prices. This helps you see how much of the trading volume is driving the market upward versus downward.
- Relative Volume & Spike Detection:
It calculates relative volume (current volume compared to a moving average) and flags any significant volume spikes based on a customizable multiplier. This feature helps identify unusual trading activity.
- Volume Smoothing Option:
For a cleaner signal, you can enable a smoothing option (using an exponential moving average) to reduce noise in the volume data.
- Advanced Summary:
The indicator combines volume data, price changes, and volume spikes to produce an overall market summary for each timeframe—labeling conditions as “Bullish Strong,” “Bullish Moderate,” “Bearish Strong,” “Bearish Moderate,” or “Neutral.”
- Cumulative Overview:
In addition to individual timeframe analysis, it aggregates the data to offer a cumulative view. This includes a collective bullish/bearish percentage, overall CVD, and even a simplified volume level (Low, Normal, or High).
- Customizable Dashboard:
All these metrics are neatly displayed in a dashboard on the chart. You can customize its position and text size. The dashboard uses dynamic, color-coded cells to instantly convey the market sentiment—making it easy to spot trends at a glance.
- VWAP Integration:
Finally, the dashboard includes VWAP information, providing an additional layer of context to the price action.
Overall, this indicator is designed to provide a quick yet thorough snapshot of market conditions, enabling traders to make more informed decisions with a clear visual representation of volume and price activity across different timeframes.
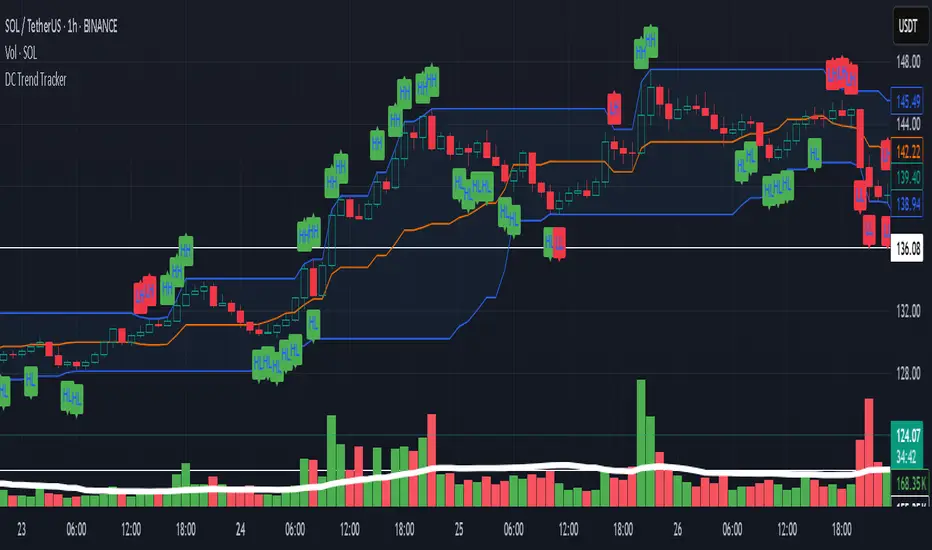
Donchian Channel Trend Tracker by KellyLikesCrypto### Overview
This indicator is written in Pine Script® (version 6) and is designed to overlay on a price chart. It combines the classic Donchian Channel—a tool popular among trend-following traders—with additional trend-tracking features. By identifying when the channel’s highs and lows are making new extreme values, the indicator helps signal potential trend shifts. It is especially suited for scalpers using 1-hour charts, as it provides clear, actionable signals for rapid entry and exit decisions.
---
### Key Components & Inputs
1. **User Inputs:**
- **Length:** The period over which the indicator calculates the highest high and the lowest low (default is 27 bars). This value can be adjusted to smooth or tighten the channel based on the trader’s preference.
- **Offset:** A parameter allowing the plotted lines to be shifted left or right on the chart, providing flexibility in aligning the indicator with price action.
2. **Donchian Channel Calculations:**
- **Lower Bound (`lower`):** Calculated using `ta.lowest(length)`, it identifies the lowest low over the defined period.
- **Upper Bound (`upper`):** Determined by `ta.highest(length)`, capturing the highest high during the same period.
- **Basis:** The midline of the channel, computed as the average of the upper and lower bounds. This line can serve as an equilibrium or reference point in the trend analysis.
---
### Visual Representation
- **Plotting the Channels:**
- The **basis** is plotted in a standout orange color (#FF6D00) to make the central trend reference easily visible.
- The **upper** and **lower** bounds are plotted in blue (#2962FF), creating clear boundaries for the price action.
- The area between these two lines is filled with a semi-transparent blue, enhancing the visual context of the channel and helping traders quickly assess whether price is near an extreme or within a normal range.
---
### Trend Identification Logic
Beyond plotting the basic Donchian Channel, the indicator introduces additional logic to track short-term trend changes:
1. **Higher Highs and Higher Lows:**
- **Higher High (`higherHigh`):** This condition checks if the current upper bound is greater than the previous bar’s upper bound, signaling a potential upward push.
- **Higher Low (`higherLow`):** Similarly, it checks if the current lower bound exceeds the previous bar’s lower bound, reinforcing an upward trend if the support level is rising.
2. **Lower Highs and Lower Lows:**
- **Lower High (`lowerHigh`):** This evaluates if the current upper bound is less than that of the previous bar, indicating a possible downward shift.
- **Lower Low (`lowerLow`):** It verifies if the current lower bound is lower than the previous bar’s, further confirming a bearish tendency.
The use of the `nz()` function ensures that on the very first bar—where no previous data exists—the code handles the values gracefully without causing errors.
---
### Visual Markers for Trend Signals
To make trend signals immediately apparent:
- **Markers are Plotted on the Chart:**
- **Green Labels ("HH" and "HL"):** These are placed on the chart when the indicator detects higher highs or higher lows, suggesting bullish momentum.
- **Red Labels ("LH" and "LL"):** These markers are shown when lower highs or lower lows are detected, indicating bearish pressure.
Each label is plotted either above or below the corresponding bar, ensuring that the chart remains uncluttered and that the trend signals are clear.
---
### Scalping Strategy on 1-Hour Charts
This indicator is specifically tailored for scalping strategies on 1-hour charts. Scalping involves capturing small, rapid profits from short-term price movements, and the clear trend signals provided by this tool can help traders pinpoint optimal entry and exit points. Here’s how it integrates into a scalping strategy:
- **Quick Trend Identification:** The green markers (HH and HL) suggest bullish conditions ideal for quick long entries, while the red markers (LH and LL) signal bearish conditions suitable for short entries.
- **Timing and Precision:** On a 1-hour chart, the indicator’s sensitivity to higher highs and lower lows allows traders to make rapid decisions aligned with the prevailing trend.
- **Complementary Analysis:** While the indicator provides fast signals, it is recommended to use it alongside additional tools (like oscillators or volume analysis) and strict risk management practices, ensuring that scalpers can confirm entries and exits efficiently.
By leveraging the indicator’s visual cues within a broader scalping framework, traders can enhance their ability to capture quick moves, thus optimizing their overall strategy on 1-hour timeframes.
---
### Conclusion
The “Donchian Channel Trend Tracker by KellyLikesCrypto” is a powerful tool for visualizing price extremes and trend direction. By combining the classical Donchian Channel with additional trend-tracking markers, it offers traders a clear and immediate way to assess whether the market is gaining bullish momentum or beginning to turn bearish. Its customizable parameters and clear visual signals make it particularly effective for a scalping strategy on 1-hour charts, where rapid decision-making is crucial.
This detailed breakdown should provide a comprehensive understanding of how each component of the indicator works together and how it can be effectively integrated into a short-term scalping strategy.
ATR - Asymmetric Turbulence Ribbon🧭 Asymmetric Turbulence Ribbon (ATR)
The Asymmetric Turbulence Ribbon (ATR) is an enhanced and reimagined version of the standard Average True Range (ATR) indicator. It visualizes not just raw volatility, but the structure, momentum, and efficiency of volatility through a multi-layered visual approach.
It contains two distinct visual systems:
1. A zero-centered histogram that expresses how current volatility compares to its historical average, with intensity and color showing speed and conviction
2. A braided ribbon made of dual ATR-based moving averages that highlight transitions in volatility behavior—whether volatility is expanding or contracting
The name reflects its purpose: to capture asymmetric, evolving turbulence in market behavior, through structure-aware volatility tracking.
_______________________________________________________________
🔧 Inputs (Fibonacci defaults)
ATR Length
Lookback period for ATR calculation (default: 13)
ATR Base Avg. Length
Moving average period used as the zero baseline for histogram (default: 55)
ATR ROC Lookback
Number of bars to measure rate of change for histogram color mapping (default: 8)
Timeframe Override
Optionally calculate ATR values from a higher or fixed timeframe (e.g., 1D) for macro-volatility overlay
Show Ribbon Fill
Toggles colored fill between ATR EMA and HMA lines
Show ATR MAs
Toggles visibility of ATR EMA and HMA lines
Show Crossover Markers
Shows directional triangle markers where ATR EMA and HMA cross
Show Histogram
Toggles the entire histogram display
_______________________________________________________________
📊 Histogram Component: Volatility Energy Profile
The histogram shows how far the current ATR is from its moving average baseline, centered around zero. This lets you interpret volatility pressure—whether it's expanding, contracting, or preparing to reverse.
To complement this, the indicator also plots the raw ATR line in aqua. This is the actual average true range value—used internally in both the histogram and ribbon calculations. By default, it appears as a slightly thicker line, providing a clear reference point for comparing historical volatility trends and absolute levels.
Use the baseline ATR to:
- Compare real-time volatility to previous peaks or troughs
- Monitor how ATR behaves near histogram flips or ribbon crossovers
- Evaluate volatility phases in absolute terms alongside relative momentum
The ATR line is particularly helpful for users who want to keep tabs on raw volatility values while still benefiting from the enhanced visual storytelling of the histogram and ribbon systems.
Each histogram bar is colored based on the rate of change (ROC) in ATR: The faster ATR rises or falls, the more intense the color. Meanwhile, the opacity of each bar is adjusted by the effort/result ratio of the price candle (body vs. range), showing how much price movement was achieved with conviction.
Color Interpretation:
🔴 Red
Strong volatility expansion
Market entering or deepening into a volatility burst
Seen during breakouts, panic moves, or macro shock events
Often accompanied by large real candle bodies
🟠 Orange
Moderate volatility expansion
Heating up phase, often precedes breakouts
Common in strong trending environments
Signals tightening before acceleration
🟡 Yellow
Mild volatility increase
Transitional state—energy building, not yet exploding
Appears in early trend development or pullbacks
🟢 Green
Mild volatility contraction
ATR cooling off
Seen during consolidation, reversion, or range balance
Good time to assess upcoming directional setups
🔵 Aqua
Moderate compression
Volatility is clearly declining
Signals consolidation within larger structure
Pre-breakout zones often form here
🔵 Deep Blue
Strong volatility compression
Market is coiling or dormant
Can signal upcoming squeeze or fade environment
Often followed by sharp expansion
Opacity scaling:
Brighter bars = efficient, directional price action (strong bodies)
Faded bars = indecision, chop, absorption, or wick-heavy structure
Together, color and opacity give a 2D view of market volatility: Hue = the type and direction of volatility
Opacity = the quality and structure behind it
Use this to gauge whether volatility is rising with conviction, fading into neutrality, or compressing toward breakout potential.
_______________________________________________________________
🪡 Ribbon Component: Volatility Rhythm Structure
The ribbon overlays two moving averages of ATR:
EMA (yellow) – faster, more reactive
HMA (orange) – smoother, more rhythmic
Their relationship creates the ribbon logic:
Yellow fill (EMA > HMA)
Short-term volatility is increasing faster than the longer-term rhythm
Signals active expansion and engagement
Orange fill (HMA > EMA)
Volatility is decaying or leveling off
Suggests possible exhaustion, pullback, or range
Crossover triangle markers (optional, off by default to avoid clutter) identify the moment of shift in volatility phase.
The ribbon reflects the shape of volatility over time—ideal for mapping cyclical energy shifts, transitional states, and alignment between current and average volatility.
_______________________________________________________________
📐 Strategy Application
Use the Asymmetric Turbulence Ribbon to:
- Detect volatility expansions before breakouts or directional runs
- Spot compression zones that precede structural ruptures
- Visually separate efficient moves from noisy market activity
- Confirm or fade trade setups based on underlying energy state
- Track the volatility environment across multiple timeframes using the override
_______________________________________________________________
🎯 Ideal Timeframes
Designed to function across all timeframes, but particularly powerful on intraday to daily ranges (1H to 1D)
Use the timeframe override to anchor your chart in higher-timeframe volatility context, like daily ATR behavior influencing a 1H setup.
_______________________________________________________________
🧬 Customization Tips
- Increase ATR ROC Lookback for smoother color transitions
- Extend ATR Base Avg Length for more macro-driven histogram centering
- Disable the histogram for ribbon-only rhythm view
- Use opacity and color shifts in the histogram to detect stealth energy builds
- Align ATR phases with structure or order flow tools for high-quality setups
Sigma Expected Movement)Okay, here's a brief description of what the final Pine Script code achieves:
Indicator Description:
This indicator calculates and plots expected price movement ranges based on the VIX index for daily, weekly, or monthly periods. It uses user-selectable VIX data (Today's Open / Previous Close) and a center price source (Today's Open / Previous Close).
Key features include:
Up to three customizable deviation levels, based on user-defined percentages of the calculated expected move.
Configurable visibility, color, opacity (default 50%), line style, and width (default 1) for each deviation level.
Optional filled area boxes between the 1st and 2nd deviation levels (enabled by default), with customizable fill color/opacity.
An optional center price line with configurable visibility (disabled by default), color, opacity, style, and width.
All drawings appear only within a user-defined time window (e.g., specific market hours).
Does not display price labels on the lines.
Optional rounding of calculated price levels.

Multiple VWMATradingView Indicator: Multiple VWMA
This TradingView indicator allows you to display up to five separate Volume Weighted Moving Averages (VWMAs) directly on your price chart.
What it does:
Plots 5 VWMAs: It calculates and draws five distinct VWMA lines (or other styles) on the chart.
Volume Weighting: Unlike simple moving averages, a VWMA gives more weight to prices where trading volume was higher, potentially offering a clearer picture of the trend strength confirmed by volume.
Highly Customizable: Each of the five VWMAs can be configured independently through the indicator's settings panel. For each one, you can set:
Length: The lookback period (number of bars) used for the calculation.
Source: The price data to use (e.g., close, open, high, low, hl2, etc.).
Timeframe: You can calculate each VWMA based on a different timeframe than the one currently displayed on your chart (e.g., view daily VWMAs on an hourly chart). Leave blank to use the chart's timeframe.
Offset: Shift the VWMA line forwards or backwards on the chart by a specific number of bars.
Style: Choose how each VWMA is displayed (Line, Histogram, or Cross).
Overlay: The VWMAs are plotted directly over the price bars for easy comparison.
Purpose:
This indicator is useful for traders who want to analyze trends using multiple volume-weighted perspectives simultaneously. By comparing VWMAs of different lengths or based on different timeframes, you can gain insights into short-term vs. long-term trends, potential support/resistance levels, and the significance of price movements based on accompanying volume.

Multi-timeframe Trend & Momentum DashboardMulti-Timeframe Trend & Momentum Dashboard
This indicator is a comprehensive multi-timeframe analysis tool designed for traders who want to quickly assess market trends and momentum across several timeframes. It combines trend detection with duration tracking and displays key information in an easy-to-read on-chart table. Key features include:
Multi-Timeframe Analysis:
Analyzes nine different timeframes (from 1-minute up to 1-week) simultaneously, helping you gauge the overall market trend at a glance.
Trend Detection & Duration:
Uses a combination of a short-term EMA and a long-term SMA to determine whether the market is bullish, bearish, or neutral. It also tracks how long the current trend has persisted in terms of consecutive bars and displays this duration next to each timeframe.
RSI Display & Visual Alerts:
Calculates the RSI for each timeframe. RSI values are color-coded—green when above 50 (indicating bullish momentum) and red when below 50 (indicating bearish conditions). Additionally, if the market is bearish on a particular timeframe while the RSI is above 50, the RSI cell flashes yellow to alert you of a potential trend reversal or divergence.
On-Chart Trend Start Markers:
When a new trend is detected on your current chart’s timeframe, the indicator automatically marks the bar with a label showing the new trend direction, providing a clear visual cue for trend changes.
This powerful tool is perfect for traders looking to combine multi-timeframe trend analysis with momentum indicators, enabling a more informed and dynamic trading strategy. Whether you’re a day trader or swing trader, the Multi-Timeframe Trend & Momentum Dashboard brings clarity to market conditions across multiple time horizons.

ATR and Moving AverageUsing ATR and Moving Average: A Technical Analysis Strategy
The Average True Range (ATR) and the Moving Average are two important technical analysis tools that can be used together to identify trading opportunities in the market. In this article, we will explore how to use these two tools and how the crossover between them can indicate changes in the market.
What is ATR?
The Average True Range (ATR) is a measure of the volatility of an asset, which calculates the average true range of an asset over a period of time. The true range is the difference between the closing price and the opening price of an asset, or the difference between the closing price and the highest or lowest price of the day. ATR is an important measure of volatility, as it helps to identify the magnitude of price fluctuations of an asset.
What is Moving Average?
The Moving Average is a technical analysis tool that calculates the average price of an asset over a period of time. The Moving Average can be used to identify trends and price patterns, and is an important tool for traders. There are different types of Moving Averages, including the Simple Moving Average (SMA), the Exponential Moving Average (EMA), and the Weighted Moving Average (WMA).
Crossover between ATR and Moving Average
The crossover between ATR and Moving Average can be an important indicator of changes in the market. When ATR crosses above the Moving Average, it may indicate that the volatility of the asset is increasing and that the price may be about to rise. This occurs because ATR is increasing, which means that the true range of the asset is increasing, and the Moving Average is being surpassed, which means that the price is rising.
On the other hand, when ATR crosses below the Moving Average, it may indicate that the volatility of the asset is decreasing and that the price may be about to fall. This occurs because ATR is decreasing, which means that the true range of the asset is decreasing, and the Moving Average is being surpassed, which means that the price is falling.
Trading Strategies
There are several trading strategies that can be used with the crossover between ATR and Moving Average. Some of these strategies include:
Buying when ATR crosses above the Moving Average, with the expectation that the price will rise.
Selling when ATR crosses below the Moving Average, with the expectation that the price will fall.
Using the crossover between ATR and Moving Average as a filter for other trading strategies, such as trend analysis or pattern recognition.
In summary, the crossover between ATR and Moving Average can be an important indicator of changes in the market, and can be used as a technical analysis tool to identify trading opportunities. However, it is important to remember that no trading strategy is foolproof, and that it is always important to use a disciplined approach and manage risk adequately.
2:45 AM Candle High/Low Crossing Bars2:45 AM Candle High/Low Crossing Bars is an indicator that focuses on the trading view 2:45am NY TIME high and low indicating green for buy and red bars for sell, with the 2:45am new york time highlight/ If the next candle sweeps the low we buy while if it sweeps the high we sell, all time zoon must be the new York UTC time.

Supertrend + MACD CrossoverKey Elements of the Template:
Supertrend Settings:
supertrendFactor: Adjustable to control the sensitivity of the Supertrend.
supertrendATRLength: ATR length used for Supertrend calculation.
MACD Settings:
macdFastLength, macdSlowLength, macdSignalSmoothing: These settings allow you to fine-tune the MACD for better results.
Risk Management:
Stop-Loss: The stop-loss is based on the ATR (Average True Range), a volatility-based indicator.
Take-Profit: The take-profit is based on the risk-reward ratio (set to 3x by default).
Both stop-loss and take-profit are dynamic, based on ATR, which adjusts according to market volatility.
Buy and Sell Signals:
Buy Signal: Supertrend is bullish, and MACD line crosses above the Signal line.
Sell Signal: Supertrend is bearish, and MACD line crosses below the Signal line.
Visual Elements:
The Supertrend line is plotted in green (bullish) and red (bearish).
Buy and Sell signals are shown with green and red triangles on the chart.
Next Steps for Optimization:
Backtesting:
Run backtests on BTC in the 5-minute timeframe and adjust parameters (Supertrend factor, MACD settings, risk-reward ratio) to find the optimal configuration for the 60% win ratio.
Fine-Tuning Parameters:
Adjust supertrendFactor and macdFastLength to find more optimal values based on BTC's market behavior.
Tweak the risk-reward ratio to maximize profitability while maintaining a good win ratio.
Evaluate Market Conditions:
The performance of the strategy can vary based on market volatility. It may be helpful to evaluate performance in different market conditions or pair it with a filter like RSI or volume.
Let me know if you'd like further tweaks or explanations!

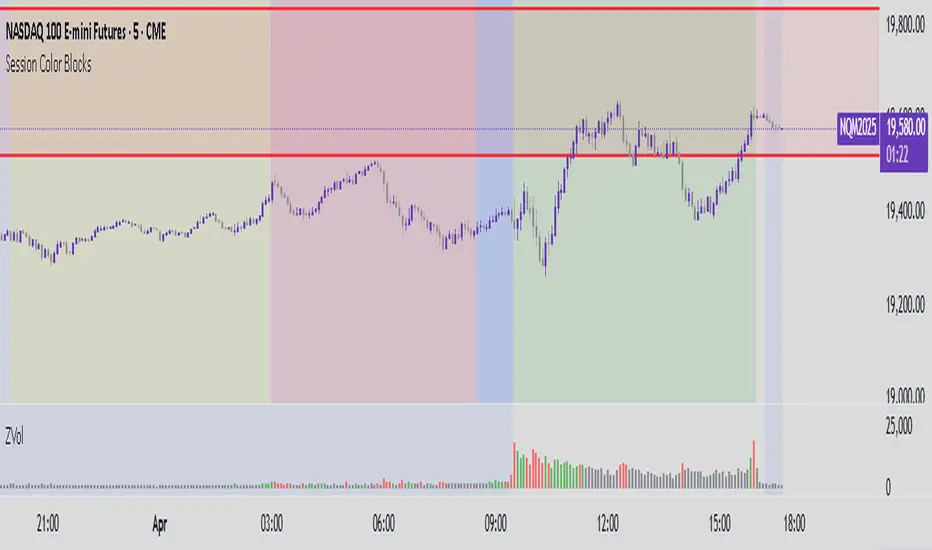
Session Color Blocks🧠 Purpose:
To visually highlight different market sessions — Asia, London, Premarket (US), and New York — using colored background blocks on the chart for better timing, context, and trade planning.
🕓 Session Times Used (Eastern Time / New York Time):
Session Time (ET) Color
Asia 8:00 PM – 3:00 AM 🟨 Yellow
London 3:00 AM – 8:30 AM 🟥 Red
Premarket 8:30 AM – 9:30 AM 🟦 Blue
New York 9:30 AM – 4:00 PM 🟩 Green
(DST is automatically handled via "America/New_York" timezone)
✅ Features:
Session colors appear only when that session is active.
Sessions are mutually exclusive, so no overlapping blocks.
Works on any symbol, especially useful for US stock/futures traders.
Auto-adjusts for daylight savings (using TradingView's IANA timezones).
🔧 Future Enhancements (Optional):
Toggle each session on/off
Add vertical lines or labels for session opens
Extend to weekends or custom sessions
Market Push Meter - CoffeeStyleMarket Push Meter - CoffeeKiller Indicator Guide
Welcome traders! This guide will walk you through the Market Push Meter indicator, a sophisticated volume analysis tool developed by CoffeeKiller with the help and assistance of FindBetterTrades that measures and visualizes the ongoing battle between buyers and sellers through volume pressure analysis.
🔔 **Warning: This Is Not a Standard Volume Indicator** 🔔 This indicator analyzes volume pressure in a unique way, combining directional volume with price action to identify market imbalances between buyers and sellers. All credit for the core logic for this indicator goes to FindBetterTrades and his/hers Volume Pressure Histogram (Normalized) (this is my adaptation and style added to that core logic, thus the CoffeeStyle name was added).
Core Concept: Volume Pressure Analysis
The foundation of this indicator lies in measuring the imbalance between buying and selling volume, providing insights into which market participants are exerting more pressure on price movements.
Volume Pressure Columns: Buying vs Selling Force
- Positive Green Columns: Net buying pressure
- Negative Red Columns: Net selling pressure
- Color intensity varies based on pressure strength
- Special coloring for new high/low boundaries
Marker Lines: Dynamic Support/Resistance
- High Marker Line (Magenta): Tracks the highest point reached during buying phases
- Low Marker Line (Cyan): Tracks the lowest point reached during selling phases
- Creates visual boundaries showing pressure extremes
Peak Detection System:
- Triangular markers identify significant local maxima and minima
- Background highlighting shows important pressure peaks
- Helps identify potential reversal points and pressure exhaustion
Reference Lines:
- Overbought Level: Threshold for extreme selling pressure
- Oversold Level: Threshold for extreme buying pressure
- Used to identify potential reversal zones
Core Components
1. Volume Pressure Calculation
- Separation of up-volume and down-volume
- Calculation of net volume pressure
- Smoothing for consistent visualization
- Normalization against total volume for percentage scaling
2. Boundary Tracking System
- Automatic detection of highest values in buying phases
- Automatic detection of lowest values in selling phases
- Step-line visualization of boundaries
- Color-coded for easy identification
3. Peak Detection System
- Identification of local maxima and minima
- Background highlighting of significant peaks
- Triangle markers for peak visualization
- Zero-line cross detection for trend changes
4. Threshold Settings
- Extreme threshold multiplier for identifying significant pressure
- Overbought/oversold levels for potential reversals
- Dynamic color coding based on pressure intensity
- Alert conditions for key pressure levels
Main Features
Volume Analysis Settings
- Customizable volume MA length
- Signal smoothing for clearer readings
- Optional log scale for handling wide range variations
- Adjustable threshold multiplier for sensitivity
Visual Elements
- Color-coded columns showing pressure direction and strength
- Dynamic marker lines for pressure boundaries
- Peak triangles for significant turning points
- Background highlighting for peak identification
- Overbought/oversold reference lines
Signal Generation
- Zero-line crosses for trend change signals
- Boundary breaks for pressure strength
- Peak formation for potential reversals
- Color changes for pressure direction and intensity
- Alert conditions for extreme pressure levels
Customization Options
- Volume analysis parameters
- Marker line visibility and colors
- Peak marker display options
- Log scale toggle for handling various markets
- Overbought/oversold threshold adjustments
Trading Applications
1. Trend Identification
- Volume pressure crossing above zero: buying pressure emerging
- Volume pressure crossing below zero: selling pressure emerging
- Column color: indicates pressure direction
- Column height: indicates pressure strength
- Signal line: confirms overall trend direction
2. Reversal Detection
- Peak triangles after extended trend: potential exhaustion
- Background highlighting: significant reversal points
- Volume pressure approaching marker lines: potential trend change
- Color shifts from bright to muted: decreasing pressure
- Readings beyond overbought/oversold levels: potential reversal zones
3. Pressure Analysis
- Breaking above previous high boundary: accelerating buying pressure
- Breaking below previous low boundary: accelerating selling pressure
- Special coloring (magenta/cyan): boundary breaks indicating strength
- Extreme readings: potential climactic buying/selling
4. Market Structure Assessment
- Consecutive higher peaks: strengthening buying structure
- Consecutive lower troughs: strengthening selling structure
- Peak comparisons: relative strength of pressure phases
- Boundary line steps: market structure levels
Optimization Guide
1. Volume Analysis Settings
- Volume MA Length: Default 25 provides balanced signals
- Lower values (10-15): More responsive, potentially noisier
- Higher values (30-50): Smoother, fewer false signals
- Signal Smoothing Length: Default 8 provides good balance
- Lower values: More responsive to pressure changes
- Higher values: Smoother trend identification
2. Threshold Settings
- Extreme Threshold Multiplier: Default 20.0
- Lower values: More signals, potentially more noise
- Higher values: Fewer signals, but more significant
- Overbought/Oversold Levels: Defaults at 20/-20
- Adjust based on instrument volatility
- Wider settings for more volatile instruments
3. Visual Customization
- Marker Line Colors: Adjust for visibility on your chart
- Peak Marker Color: Default yellow provides good contrast
- Enable/disable background highlights based on preference
- Consider log scale for instruments with wide volume ranges
4. Alert Settings
- Configure alerts for high buying pressure
- Configure alerts for high selling pressure
- Set additional alerts for zero-line crosses
- Consider timeframe when setting alert sensitivity
Best Practices
1. Signal Confirmation
- Wait for zero-line crosses to confirm pressure changes
- Look for peak formations to identify potential reversals
- Check for boundary breaks to confirm strong pressure
- Use with price action for entry/exit precision
- Consider extreme threshold crossings as significant signals
2. Timeframe Selection
- Lower timeframes: more signals, potential noise
- Higher timeframes: cleaner signals, less frequent
- Multiple timeframes: confirm signals across time horizons
- Match to your trading style and holding period
3. Market Context
- Strong buying phase: positive columns breaking above marker line
- Strong selling phase: negative columns breaking below marker line
- Columns approaching zero: potential pressure shift
- Columns beyond overbought/oversold: extreme conditions, potential reversal
4. Combining with Other Indicators
- Use with trend indicators for confirmation
- Pair with price action oscillators for divergence detection
- Combine with traditional volume indicators for validation
- Consider support/resistance levels with boundary lines
Advanced Trading Strategies
1. Boundary Break Strategy
- Enter long when volume pressure breaks above previous high marker line
- Enter short when volume pressure breaks below previous low marker line
- Use zero-line as initial stop-loss reference
- Take profits at formation of opposing peaks
2. Peak Trading Strategy
- Identify significant peaks with triangular markers
- Look for consecutive lower peaks in buying phases for shorting opportunities
- Look for consecutive higher troughs in selling phases for buying opportunities
- Use zero-line crosses as confirmation
3. Extreme Reading Strategy
- Look for volume pressure beyond overbought/oversold levels
- Watch for color changes and peak formations
- Enter counter-trend positions after confirmed peaks
- Use tight stops due to extreme market conditions
4. Volume Color Strategy
- Enter long when columns turn bright green (increasing buying pressure)
- Enter short when columns turn bright red (increasing selling pressure)
- Exit when color intensity fades (decreasing pressure)
- Use marker lines as dynamic support/resistance
Practical Analysis Examples
Bullish Market Scenario
- Volume pressure crosses above zero line
- Green columns grow in height and intensity
- High marker line forms steps upward
- Peak triangles appear at local maxima
- Background highlights appear at significant buying pressure peaks
Bearish Market Scenario
- Volume pressure crosses below zero line
- Red columns grow in depth and intensity
- Low marker line forms steps downward
- Peak triangles appear at local minima
- Background highlights appear at significant selling pressure troughs
Consolidation Scenario
- Volume pressure oscillates around zero line
- Column colors alternate frequently
- Marker lines remain relatively flat
- Few or no new peak highlights appear
- Pressure values remain small
Understanding Market Dynamics Through Market Push Meter
At its core, this indicator provides a unique lens to visualize market pressure through volume analysis:
1. Volume Imbalance: By separating and comparing buying volume (up candles) from selling volume (down candles), the indicator provides insights into which side is exerting more pressure in the market.
2. Normalized Pressure: The indicator normalizes volume pressure as a percentage of total volume, making it more comparable across different market conditions and instruments.
3. Dynamic Boundaries: The marker lines create a visual representation of the "high water marks" of pressure in both directions, helping to identify when markets are making new pressure extremes.
4. Exhaustion Signals: The peak detection system highlights moments where pressure has reached a local maximum or minimum, often precursors to reversals or consolidations.
Remember:
- Combine signals from volume pressure, marker lines, and peak formations
- Use appropriate timeframe settings for your trading style
- Customize the indicator to match your visual preferences and market
- Consider overall market conditions and correlate with price action
This indicator works best when:
- Used as part of a comprehensive trading system
- Combined with proper risk management
- Applied with an understanding of current market conditions
- Signals are confirmed by price action and other indicators
DISCLAIMER: This indicator and its signals are intended solely for educational and informational purposes. They do not constitute financial advice. Trading involves significant risk of loss. Always conduct your own analysis and consult with financial professionals before making trading decisions.

Institutional Activity AnalysisThe Institutional Activity Analysis (IAA) indicator is a powerful tool designed to help traders identify potential institutional buying and selling activity in the market. By analyzing volume, price movement, and accumulation/distribution trends, this indicator provides insights into market dynamics that may signal significant activity.
This indicator is not a buy or sell recommendation but rather a tool to assist traders in understanding market behavior. It should be used in conjunction with other technical analysis tools and strategies for a comprehensive trading approach.
Key Features:
Smart Money Flow Index (SMFI):
1). Tracks the flow of "smart money" by analyzing price action relative to volume.
2). Helps identify whether institutional activity is bullish or bearish.
Accumulation/Distribution (Acc/Dist):
1). Measures buying and selling pressure in the market.
2). Indicates whether the market is in an accumulation (buying) or distribution (selling) phase.
Volume Spike Detection:
1. Identifies unusual volume spikes that may signal institutional activity.
2. Highlights these spikes with a yellow circle on the chart.
Significant Price Movement:
1. Detects strong price movements accompanied by high volume.
2. Marks these movements with a green triangle on the chart.
Customizable Dashboard:
1. Displays key metrics such as volume flow, smart money flow, accumulation/distribution, and volatility.
2. Includes visual signals for volume spikes and significant moves.
3. The dashboard can be positioned anywhere on the chart or turned off.
Heatmap for Activity Intensity:
1. Visualizes the intensity of market activity by combining volume and price volatility.
How to Read the Indicator:
Smart Money Flow (SMFI):
1. A positive SMFI value indicates bullish institutional activity.
2. A negative SMFI value suggests bearish institutional activity.
3. The blue line on the indicator represents the smoothed SMFI.
Accumulation/Distribution (Acc/Dist):
1. A positive slope indicates accumulation (buying pressure).
2. A negative slope indicates distribution (selling pressure).
3. The purple line on the indicator shows the smoothed Acc/Dist slope.
Volume Spikes:
1. Yellow circles on the chart indicate unusual volume spikes.
2. These spikes may signal institutional interest or significant market activity.
Significant Price Movements:
1. Green triangles on the chart highlight strong price movements with high volume.
2. These movements may indicate potential breakouts or reversals.
Dashboard:
The dashboard provides a quick summary of key metrics:
1. Volume Flow: Indicates whether volume is above or below the average.
2. Smart Money: Shows whether institutional activity is bullish or bearish.
3. Acc/Dist: Displays whether the market is in accumulation or distribution.
4. Volatility: Provides the current volatility level.
5. Signals: Highlights whether there are volume spikes or significant moves.
How to Use the Indicator:
Identify Institutional Activity:
1. Look for confluences between volume spikes, significant price movements, and the direction of the SMFI and Acc/Dist slope.
2. For example, a volume spike combined with a positive SMFI and accumulation may indicate bullish institutional activity.
Confirm Market Trends:
1. Use the indicator to confirm trends by analyzing the direction of the SMFI and Acc/Dist slope.
2. A rising SMFI and positive Acc/Dist slope suggest a strong uptrend, while the opposite indicates a downtrend.
Monitor Volatility:
1. High volatility combined with volume spikes may signal potential breakouts or reversals.
2. Use the volatility metric on the dashboard to gauge market conditions.
Set Alerts:
1. Use the built-in alert conditions to get notified of volume spikes and significant price movements.
2. Alerts can help you stay informed about potential market opportunities.
Important Notes:
1. This is not a buy or sell recommendation. The IAA indicator is a technical analysis tool designed to provide insights into market activity. Always use it in conjunction with other tools and strategies.
2. The indicator works best when combined with other forms of analysis, such as support/resistance levels, trendlines, and candlestick patterns.
3. Past performance is not indicative of future results. Always practice proper risk management and trade responsibly.
Customization:
The indicator includes several customizable settings:
1. Volume Spike Threshold: Adjust the sensitivity for detecting volume spikes.
2. Smoothing Period: Change the period for calculating SMFI and Acc/Dist.
3. Price Movement Threshold: Modify the sensitivity for detecting significant price movements.
4. Dashboard Position: Move the dashboard to any corner of the chart or turn it off.
5. Visual Settings: Customize the colors and transparency of the dashboard and signals.
Example Use Case:
Imagine you're analyzing a stock that has been consolidating for several days. Suddenly, the IAA indicator detects:
1. A volume spike (yellow circle),
2. A significant price movement (green triangle),
3. A positive SMFI (bullish smart money flow),
4. And an accumulation phase (positive Acc/Dist slope).
This confluence of signals may indicate that institutional buyers are entering the market, potentially leading to a breakout. You can then use this information to plan your trade, such as setting alerts or monitoring for confirmation from other indicators.
Disclaimer:
The Institutional Activity Analysis (IAA) indicator is for educational and informational purposes only. It is not financial advice or a recommendation to buy or sell any security. Always conduct your own research and consult with a financial advisor before making trading decisions. Use this tool responsibly and at your own risk.
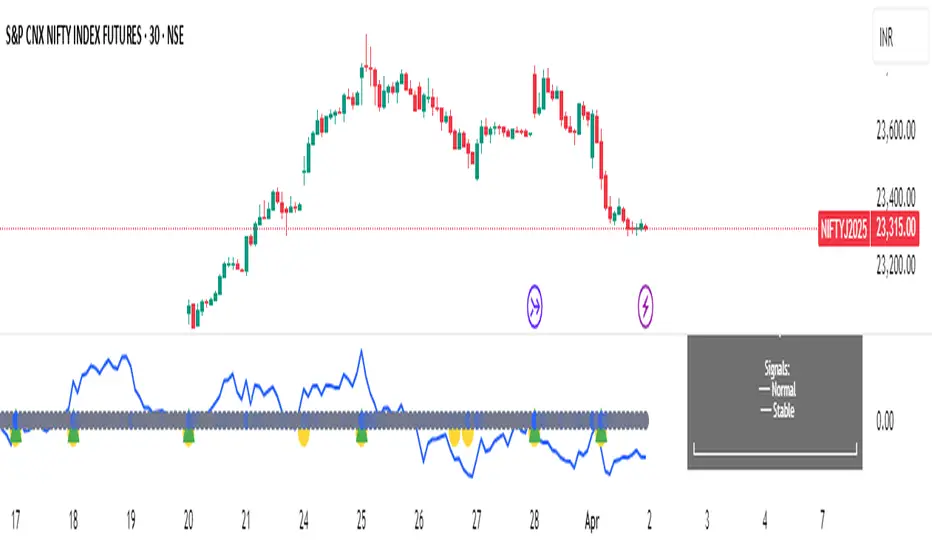
Relative Directional Index (RDI)🔍 Overview
The Relative Directional Index (RDI) is a hybrid tool that fuses the Average Directional and the Relative Strength Indices (ADX and RSI) into a single, highly visual interface. While the former captures trend strength, the latter reveals momentum shifts and potential exhaustion. Together, they can confirm trend structure, anticipate reversals, and sharpen the timing entries and exits.
📌 Why Combine ADX with RSI?
Most indicators focus on either trend-following (like ADX) or momentum detection (like RSI)—but rarely both. Each comes with trade-offs:
- ADX alone confirms trend strength but ignores momentum.
- RSI alone signals overbought/oversold, but lacks trend context.
The RDI resolves this by integrating both, offering:
- Smarter filters for trend entries
- Early warnings of momentum breakdowns
- More confident signal validation
🧠 Design Note: Fibonacci Harmony
All default values—5, 13, 21—are Fibonacci numbers. This is intentional, as these values reflect the natural rhythm of market cycles, and promote harmonic calibration between price action and indicator logic.
🔥 Key Features
✅ ADX Histogram
- Green bars = trend gaining strength
- Red bars = trend weakening
- Adjustable transparency for visual tuning
✅ ADX Line (Orange)
- Measures trend strength over time
- Rising = accelerating trend
- Falling = trend may be fading
✅ RSI Line (Lemon Yellow)
- Captures momentum surges and slowdowns
- Above 50 = bullish control
- Below 50 = bearish pressure
✅ Trend Strength Squares
- Bright green = strong uptrend
- Bright red = strong downtrend
- Faded colors = range-bound or indecisive
✅ ADX/RSI Crossover Markers
- Yellow square = RSI crosses above ADX → momentum building
- Orange square = ADX crosses above RSI → trend still dominant
✅ Customizable Reference Lines
- Yellow (50) = strong trend threshold
- Red (30) = weak trend zone
- Green (70) = overextended, potential exhaustion
_______________________________________________________
🎯 How to Trade with the RDI
The RDI helps traders identify momentum-supported trends, catch early reversals, and avoid false signals during consolidation.
✅ Trend Confirmation Entries
🔼 Bullish → Enter long on pullbacks or resistance breakouts
- ADX rising above 30
- RSI above 50
- Green trend square visible
🔽 Bearish → Enter short on breakdowns or failed retests
- ADX rising
- RSI below 50
- Red trend square visible
🧯 Exit if RSI crosses back against trend direction or ADX flattens
🚨 Reversal Setups Using Divergence
📈 Bullish Divergence → Long entry after confirmation (e.g. engulfing bar, volume spike)
- Price prints lower low
- RSI prints higher low
- Green triangle
📉 Bearish Divergence → Short entry on breakdown
- Price prints higher high
- RSI prints lower high
- Red triangle
Tip: Stronger if ADX is declining (fading trend strength)
🔂 Breakout Detection via Cross Markers
- Yellow square = RSI > ADX → breakout brewing
- Orange square = ADX > RSI → trend continuation likely
⏸️ Avoid Choppy Markets
- RSI between 45–55
- Faded trend squares
- Flat ADX below 20–30
🧠 Pro Tips
- Combine RDI with VWAPs, moving averages and/or pitchforks
- Watch for alignment between trend and momentum
- Use divergence markers as confirmation, not stand-alone triggers
_______________________________________________________
⚠️ Hidden Divergence (Optional)
The RDI includes optional hidden divergence detection. These signals suggest trend continuation but are off by default. Use with discretion—best in established trends, not sideways markets.
🙈 Hidden Bullish
- Price prints higher low
- RSI prints lower low
🙈 Hidden Bearish
- Price prints lower high
- RSI prints higher high
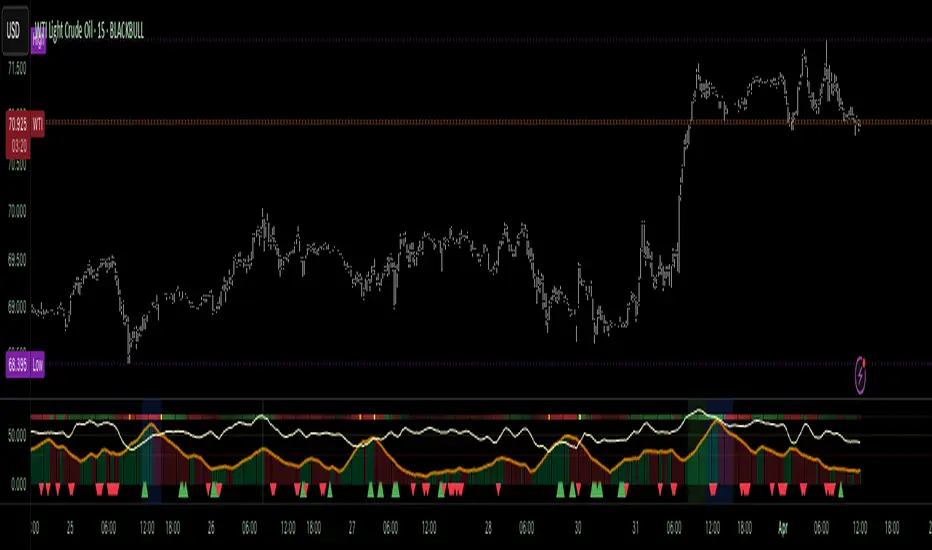
Kase Permission StochasticOverview
The Kase Permission Stochastic indicator is an advanced momentum oscillator developed from Kase's trading methodology. It offers enhanced signal smoothing and filtering compared to traditional stochastic oscillators, providing clearer entry and exit signals with fewer false triggers.
How It Works
This indicator calculates a specialized stochastic using a multi-stage smoothing process:
Initial stochastic calculation based on high, low, and close prices
Application of weighted moving averages (WMA) for short-term smoothing
Progressive smoothing through differential factors
Final smoothing to reduce noise and highlight significant trend changes
The indicator oscillates between 0 and 100, with two main components:
Main Line (Green): The smoothed stochastic value
Signal Line (Yellow): A further smoothed version of the main line
Signal Generation
Trading signals are generated when the main line crosses the signal line:
Buy Signal (Green Triangle): When the main line crosses above the signal line
Sell Signal (Red Triangle): When the main line crosses below the signal line
Key Features
Multiple Smoothing Algorithms: Uses a combination of weighted and exponential moving averages for superior noise reduction
Clear Visualization: Color-coded lines and background filling
Reference Levels: Horizontal lines at 25, 50, and 75 for context
Customizable Colors: All visual elements can be color-customized
Customization Options
PST Length: Base period for the stochastic calculation (default: 9)
PST X: Multiplier for the lookback period (default: 5)
PST Smooth: Smoothing factor for progressive calculations (default: 3)
Smooth Period: Final smoothing period (default: 10)
Trading Applications
Trend Confirmation: Use crossovers to confirm entries in the direction of the prevailing trend
Reversal Detection: Identify potential market reversals when crossovers occur at extreme levels
Range-Bound Markets: Look for oscillations between overbought and oversold levels
Filter for Other Indicators: Use as a confirmation tool alongside other technical indicators
Best Practices
Most effective in trending markets or during well-defined ranges
Combine with price action analysis for better context
Consider the overall market environment before taking signals
Use longer settings for fewer but higher-quality signals
The Kase Permission Stochastic delivers a sophisticated approach to momentum analysis, offering a refined perspective on market conditions while filtering out much of the noise that affects standard oscillators.

Smarter Money Concepts - FVGs [PhenLabs]📊 Smarter Money Concepts - FVGs
Version: PineScript™ v6
📌 Description
Smarter Money Concepts - FVGs is a sophisticated indicator designed to identify and track Fair Value Gaps (FVGs) in price action. These gaps represent market inefficiencies where price moves quickly, creating imbalances that often attract subsequent price action for mitigation. By highlighting these key areas, traders can identify potential zones for reversals, continuations, and price targets.
The indicator employs volume filtering ideology to highlight only the most significant FVGs, reducing noise and focusing on gaps formed during periods of higher relative volume. This combination of price structure analysis and volume confirmation provides traders with high-probability areas of interest that institutional smart money may target during future price movements.
🚀 Points of Innovation
Volume-Filtered Gap Detection : Eliminates low-significance FVGs by requiring a minimum volume threshold, focusing only on gaps formed with institutional participation
Equilibrium Line Visualization : Displays the midpoint of each gap as a potential precision target for trades
Automated Gap Mitigation Tracking : Monitors when price revisits and mitigates gaps, automatically managing visual elements
Time-Based Gap Management : Intelligently filters gaps based on a configurable timeframe, maintaining chart clarity
Dual Direction Analysis : Simultaneously tracks both bullish and bearish gaps, providing a complete market structure view
Memory-Optimized Design : Implements efficient memory management for smooth chart performance even with numerous FVGs
🔧 Core Components
Fair Value Gap Detection : Identifies price inefficiencies where the current candle’s low is higher than the previous candle’s high (bearish FVG) or where the current candle’s high is lower than the previous candle’s low (bullish FVG).
Volume Filtering Mechanism : Calculates relative volume compared to a moving average to qualify only gaps formed during significant market activity.
Mitigation Tracking : Continuously monitors price action to detect when gaps get filled, with options to either hide or maintain visual representation of mitigated gaps.
🔥 Key Features
Customizable Gap Display : Toggle visibility of bullish and bearish gaps independently to focus on your preferred market direction
Volume Threshold Control : Adjust the minimum volume ratio required for gap qualification, allowing fine-tuning between sensitivity and significance
Flexible Mitigation Methods : Choose between “Wick” or “Close” methods for determining when a gap has been mitigated, adapting to different trading styles
Visual Customization : Full control over colors, transparency, and style of gap boxes and equilibrium lines
🎨 Visualization
Gap Boxes : Rectangular highlights showing the exact price range of each Fair Value Gap. Bullish gaps indicate potential upward price targets, while bearish gaps show potential downward targets.
Equilibrium Lines : Dotted lines running through the center of each gap, representing the mathematical midpoint that often serves as a precision target for price movement.
📖 Usage Guidelines
General Settings
Days to Analyze : Default: 15, Range: 1-100. Controls how many days of historical gaps to display, balancing between comprehensive analysis and chart clarity
Visual Settings
Bull Color : Default:(#596fd33f). Color for bullish Fair Value Gaps, typically using high transparency for clear chart visibility
Bear Color : Default:(#d3454575). Color for bearish Fair Value Gaps, typically using high transparency for clear chart visibility
Equilibrium Line : Default: Enabled. Toggles visibility of the center equilibrium line for each FVG
Eq. Line Color : Default: Black with 99% transparency. Sets the color of equilibrium lines, usually kept subtle to avoid chart clutter
Eq. Line Style : Default: Dotted, Options: Dotted, Solid, Dashed. Determines the line style for equilibrium lines
Mitigation Settings
Mitigation Method : Default: Wick, Options: Wick, Close. Determines how gap mitigation is calculated - “Wick” uses high/low values while “Close” uses open/close values for more conservative mitigation criteria
Hide Mitigated : Default: Enabled. When enabled, gaps become transparent once mitigated, reducing visual clutter while maintaining historical context
Volume Filter
Volume Filter : Default: Enabled. When enabled, only shows gaps formed with significant volume relative to recent average
Min Ratio : Default: 1.5, Range: 0.1-10.0. Minimum volume ratio compared to average required to display an FVG; higher values filter out more gaps
Periods : Default: 15, Range: 5-50. Number of periods used to calculate the average volume baseline
✅ Best Use Cases
Identifying potential reversal zones where price may react after extended moves
Finding precise targets for take-profit placement in trend-following strategies
Detecting institutional interest areas for potential breakout or breakdown confirmations
Plotting significant support and resistance zones based on structural imbalances
Developing fade strategies at key market structure points
Confirming trade entries when price approaches significant unfilled gaps
⚠️ Limitations
Works best on higher timeframes where gaps reflect more significant market inefficiencies
Very choppy or ranging markets may produce small gaps with limited predictive value
Volume filtering depends on accurate volume data, which may be less reliable for some symbols
Performance may be affected when displaying a very large number of historical gaps
Some gaps may never be fully mitigated, particularly in strongly trending markets
💡 What Makes This Unique
Volume Intelligence : Unlike basic FVG indicators, this script incorporates volume analysis to identify the most significant structural imbalances, focusing on quality over quantity.
Visual Clarity Management : Automatic handling of mitigated gaps and memory management ensures your chart remains clean and informative even over extended analysis periods.
Dual-Direction Comprehensive Analysis : Simultaneously tracks both bullish and bearish gaps, providing a complete market structure picture rather than forcing a directional bias.
🔬 How It Works
1. Gap Detection Process :
The indicator examines each candle in relation to previous candles, identifying when a gap forms between the low of candle and high of candle (bearish FVG) or between the high of candle and low of candle (bullish FVG). This specific candle relationship identifies true structural imbalances.
2. Volume Qualification :
For each potential gap, the algorithm calculates the relative volume compared to the configured period average. Only gaps formed with volume exceeding the minimum ratio threshold are displayed, ensuring focus on institutionally significant imbalances.
3. Equilibrium Calculation :
For each qualified gap, the script calculates the precise mathematical midpoint, which becomes the equilibrium line - a key target that price often gravitates toward during mitigation attempts.
4. Mitigation Tracking :
The indicator continuously monitors price action against existing gaps, determining mitigation based on the selected method (wick or close). When price reaches the equilibrium point, the gap is considered mitigated and can be visually updated accordingly.
💡 Note:
Fair Value Gaps represent market inefficiencies that often, but not always, get filled. Use this indicator as part of a complete trading strategy rather than as a standalone system. The most valuable signals typically come from combining FVG analysis with other confirmatory indicators and overall market context. For optimal results, start with the default settings and gradually adjust parameters to match your specific trading timeframe and style.
