BeSight Mega SpotBeSight Mega Spot – Zone Based Price Grid Indicator
สคริปต์นี้ถูกออกแบบมาเพื่อช่วยเทรดเดอร์มองเห็นโซนราคาสำคัญที่ราคาอาจเกิดปฏิกิริยา โดยอ้างอิงจากระดับราคาที่ลงท้ายด้วย 0 และ 5 (เช่น 1350, 1355, 1360 เป็นต้น) ซึ่งมักเป็นระดับที่มีการตั้งคำสั่งซื้อขายจำนวนมากในตลาด
BeSight Mega Spot – Zone-Based Price Grid Indicator
This indicator is designed to help traders visualize key price zones where the market often reacts, based on price levels ending with 0 or 5 (e.g., 1350, 1355, 1360). These levels are commonly used for pending orders, liquidity, or price clustering zones.
It displays horizontal grid lines at fixed step intervals (default: every 5 points), covering the entire visible price range of the chart. Each price level is labeled for better clarity and planning.
🟦 Blue lines: Price levels ending in 0
⬜ Gray lines: Price levels ending in 5
This tool is useful for identifying potential institutional behavior zones, price consolidation, accumulation/distribution areas, or psychological support/resistance levels.
🧠 Notes:
- This indicator is not a buy/sell signal tool or predictive system.
- It works best when used in conjunction with other technical tools such as Supply/Demand zones or Smart Money Concepts (SMC) analysis.
- Compatible with all instruments: stocks, futures, forex, crypto, etc.
✅ How to use:
1. Add the indicator to your chart
2. Observe how price interacts with the 0/5 grid zones
3. Use the lines to assist with breakout, retest, or reversal planning
4. Combine with price action or other indicators for higher precision
✨ Developed by BeSight – A Community Of Traders
---------------------------------------------------------------------------------------
อินดิเคเตอร์นี้จะแสดงเส้นแนวนอนแบบตาราง (Grid) ที่แบ่งช่วงราคาออกเป็นระยะ ๆ ตามค่าที่ผู้ใช้กำหนด เช่น ทุก ๆ 5 จุด และครอบคลุมช่วงราคาทั้งหมดของกราฟ โดยแสดงเป็นเส้นแบบ dotted พร้อมป้ายราคาเพื่อให้มองเห็นได้ชัดเจน
🟦 เส้นสีน้ำเงิน: แสดงระดับราคาที่ลงท้ายด้วย 0
⬜ เส้นสีเทา: แสดงระดับราคาที่ลงท้ายด้วย 5
เหมาะสำหรับผู้ที่ต้องการดูโซนราคา "หยุดพัก / เก็บของ / เปิดโพซิชัน" ซึ่งอาจสะท้อนพฤติกรรมของผู้เล่นรายใหญ่หรือสถาบันในตลาด
🧠 ข้อควรรู้:
- อินดิเคเตอร์นี้ไม่ได้บอกจุดเข้าเทรดหรือการคาดการณ์ แต่ช่วยในการวางแผนแนวรับ-แนวต้านร่วมกับเครื่องมือวิเคราะห์อื่น ๆ
- รองรับทุกสินทรัพย์ที่มีหน่วยราคาคงที่ (หุ้น, ฟิวเจอร์ส, ฟอเร็กซ์, คริปโต ฯลฯ)
✅ วิธีใช้งาน:
1. เพิ่มอินดิเคเตอร์นี้ลงบนกราฟ
2. ใช้เส้น Grid เป็นแนวประกอบในการดูพฤติกรรมราคา เช่น การหยุดลง, การเบรกแนว, การกลับตัว
3. ผสมผสานกับโซน Demand/Supply หรือโซน SMC เพื่อความแม่นยำ
✨ พัฒนาโดย BeSight – คอมมูนิตี้ของเทรดเดอร์ตัวจริง
Индикаторы и стратегии

Weekly Levels Prep (Smart Weekly Candle)This script draws key weekly levels based on the most recent completed weekly candle (Monday–Friday). It automatically calculates and plots:
✅ Weekly High & Low
✅ Midpoint (50% level)
✅ Extension levels above and below
All levels are dynamically updated every new week and are visually marked with clean color-coded horizontal lines. Price values are shown near the price axis for clear visibility across all timeframes.
Great for:
Weekly preparation
Swing trading setups
Mean reversion and range breakouts
🔄 Works on all timeframes
🔍 Lightweight and non-intrusive
Built by a trader, for traders. 💼📈

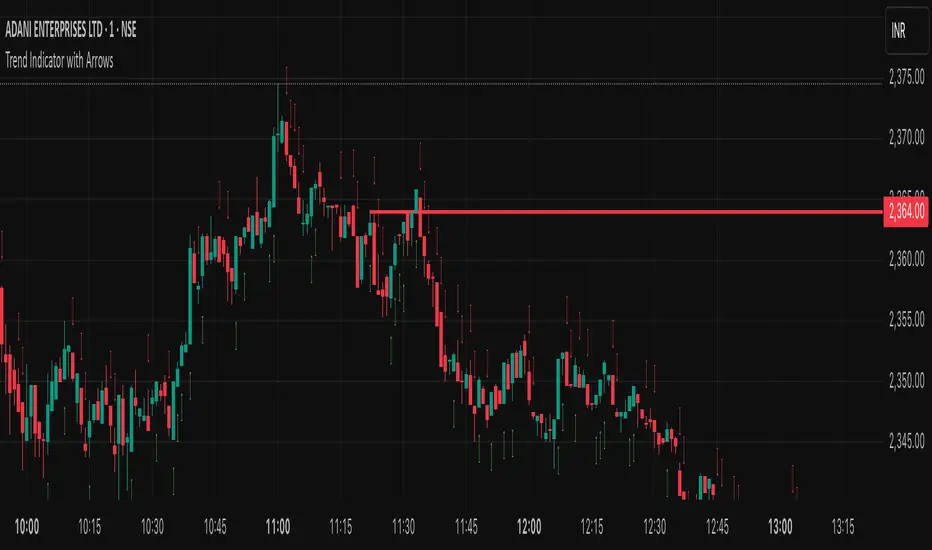
Trend Indicator with ArrowsTrend Indicator with arrows is a NoBrainer indicator to see the trend clearly.
UpTrend is defined as a candle closing above previous high. I
DownTrend is defined as a candle closing below previous low
A consolidation is defined as a candle closing inside previous candle high low.
UpTrend - Indicated with a green arrow below the candle with the current indicator.
DownTrend - ndicated with a red arrow above the candle with the current indicator.
So How to use this Indicator?
Identify zones of consolidation where the indicator doesn't show any arrows. Upon shift from consolidation to UpTrend or DownTrend take a entry. This is one way.
Second and most useful way is wait for Support or resistant hit.
If it's a support. Upon support hit wait for Consolidation, DownTrend and then UpTrend/(Consolidation again with uptrend) for long entry.
If its a resistance. Upon resistance hit wait for Consolidation, Uptrend and then DownTrend/(Consolidation again with DownTrend) for short Entry.
TrendLibrary "Trend"
calculateSlopeTrend(source, length, thresholdMultiplier)
Parameters:
source (float)
length (int)
thresholdMultiplier (float)
Purpose:
The primary goal of this function is to determine the short-term trend direction of a given data series (like closing prices). It does this by calculating the slope of the data over a specified period and then comparing that slope against a dynamic threshold based on the data's recent volatility. It classifies the trend into one of three states: Upward, Downward, or Flat.
Parameters:
`source` (Type: `series float`): This is the input data series you want to analyze. It expects a series of floating-point numbers, typically price data like `close`, `open`, `hl2` (high+low)/2, etc.
`length` (Type: `int`): This integer defines the lookback period. The function will analyze the `source` data over the last `length` bars to calculate the slope and standard deviation.
`thresholdMultiplier` (Type: `float`, Default: `0.1`): This is a sensitivity factor. It's multiplied by the standard deviation to determine how steep the slope needs to be before it's considered a true upward or downward trend. A smaller value makes it more sensitive (detects trends earlier, potentially more false signals), while a larger value makes it less sensitive (requires a stronger move to confirm a trend).
Calculation Steps:
Linear Regression: It first calculates the value of a linear regression line fitted to the `source` data over the specified `length` (`ta.linreg(source, length, 0)`). Linear regression finds the "best fit" straight line through the data points.
Slope Calculation: It then determines the slope of this linear regression line. Since `ta.linreg` gives the *value* of the line on the current bar, the slope is calculated as the difference between the current bar's linear regression value (`linRegValue`) and the previous bar's value (`linRegValue `). A positive difference means an upward slope, negative means downward.
Volatility Measurement: It calculates the standard deviation (`ta.stdev(source, length)`) of the `source` data over the same `length`. Standard deviation is a measure of how spread out the data is, essentially quantifying its recent volatility.
Adaptive Threshold: An adaptive threshold (`threshold`) is calculated by multiplying the standard deviation (`stdDev`) by the `thresholdMultiplier`. This is crucial because it means the definition of a "flat" trend adapts to the market's volatility. In volatile times, the threshold will be wider, requiring a larger slope to signal a trend. In quiet times, the threshold will be narrower.
Trend Determination: Finally, it compares the calculated `slope` to the adaptive `threshold`:
If the `slope` is greater than the positive `threshold`, the trend is considered **Upward**, and the function returns `1`.
If the `slope` is less than the negative `threshold` (`-threshold`), the trend is considered **Downward**, and the function returns `-1`.
If the `slope` falls between `-threshold` and `+threshold` (inclusive of 0), the trend is considered **Flat**, and the function returns `0`.
Return Value:
The function returns an integer representing the determined trend direction:
`1`: Upward trend
`-1`: Downward trend
`0`: Flat trend
In essence, this library function provides a way to gauge trend direction using linear regression, but with a smart filter (the adaptive threshold) to avoid classifying minor noise or low-volatility periods as significant trends.
Impulse Candle with Volume & Std AnalysisImpulse Candle with Volume & Std Analysis
This indicator highlights “impulse” candles on your chart by combining price action and volume analysis to gauge the strength of market moves.
How It Works:
Impulse Candle Detection:
The indicator measures the candle’s body size and compares it to the Average True Range (ATR). When a candle’s body exceeds a user-defined multiple of the ATR (the “Impulse Factor”), it is flagged as an impulse candle.
Volume Analysis:
For each impulse candle, the indicator calculates the expected volume (Impulse Factor × average volume) and compares the actual volume against this expected value. It uses the standard deviation of volume over a specified period to classify the move’s volume as:
Extreme Low: More than 2 standard deviations below the expected volume
Low: Between 1 and 2 standard deviations below expected
Normal: Within 1 standard deviation of expected volume
High: Between 1 and 2 standard deviations above expected
Extreme High: More than 2 standard deviations above expected
Visual Cues:
The impulse candles are color-coded based on the volume classification.
A text-only label (with customizable text color) appears just above each impulse candle, indicating its volume category. The label has no background, ensuring a clean, unobtrusive look.
Customization:
Users can adjust parameters such as the Impulse Factor, ATR length, and volume averaging period to tailor the indicator to their trading style.
This tool is perfect for traders who want a quick visual representation of both significant price moves and the corresponding volume strength behind those moves.

P-Motion Trend | QuantEdgeB⚡ Introducing P-Motion Trend (PMT) by QuantEdgeB
🧭 Overview
P-Motion Trend is a refined trend-following framework built for modern market dynamics. It combines DEMA filtering, percentile-based smoothing, and volatility-adjusted envelopes to create a clear, noise-filtered trend map directly on your chart.
This overlay indicator is engineered to detect breakout zones, trend continuation setups, and market regime shifts with maximum clarity and minimum lag.
Whether you're swing trading crypto, managing intraday FX moves, or positioning in equities — P-Motion Trend adapts, aligns, and simplifies.
🧠 Core Logic
1️⃣ DEMA Filtering Core
The input source is processed through a Double EMA to reduce lag while retaining trend sensitivity.
2️⃣ Percentile Median Smoothing
To eliminate short-lived spikes, the DEMA output is passed through a percentile median rank — effectively smoothing without distortion.
3️⃣ Volatility Envelope with EMA Basis
An exponential moving average (EMA) is applied to the smoothed median, and standard deviation bands are wrapped around it:
• ✅ Long Signal → Price closes above the upper band
• ❌ Short Signal → Price closes below the lower band
• ➖ Inside Band = Neutral
These bands expand/contract with market volatility — protecting against false breakouts in quiet regimes and adapting quickly to strong moves.
📊 Visual & Analytical Layers
• 🎯 Bar Coloring: Color-coded candles highlight trend state at a glance.
• 📈 EMA Ribbon Overlay: A dynamic ribbon of EMAs helps confirm internal momentum and detect transitions (trend decay or acceleration).
• 🔹Gradient Fill Zones: Visually communicates squeeze vs. expansion phases based on band width.
⚙️ Custom Settings
• EMA Length – Defines the core trend path (default: 21)
• SD Length – Controls volatility band smoothing (default: 30)
• SD Mult Up/Down – Sets thresholds for breakout confirmation (default: 1.5)
• DEMA Filter Source – Raw input used for trend processing
• DEMA Filter Length – Sets DEMA smoothing (default: 7)
• Median Length – Percentile-based smoothing window (default: 2)
📌 Use Cases
✅ Trend Confirmation
Use PMT to confirm whether the price action is structurally valid for trend continuation. A close above the upper band signals entry alignment.
🛡️ Reversal Guard
Avoid early reversion entries. PMT keeps you in-trend until price truly breaks structure.
🔍 Momentum Visualizer
With multiple EMA bands, the indicator also functions as a momentum envelope to spot divergence between price and smoothed trend flow.
🔚 Conclusion
P-Motion Trend is a hybrid volatility + trend system built with precision smoothing, dynamic filtering, and clean visual output. It balances agility with stability, helping you:
• Filter out price noise
• Enter with structure
• Stay in trades longer
• Exit with confidence
🧩 Summary of Benefits
• 🔹 Lag-minimized trend structure via DEMA core
• 🔹 Real-time volatility band adaptation
• 🔹 Gradient visual feedback on compression/expansion
• 🔹 EMA ribbon assists in phase detection
• 🔹 Suitable for all markets & timeframes
📌 Disclaimer: Past performance is not indicative of future results. No trading strategy can guarantee success in financial markets.
📌 Strategic Advice: Always backtest, optimize, and align parameters with your trading objectives and risk tolerance before live trading.

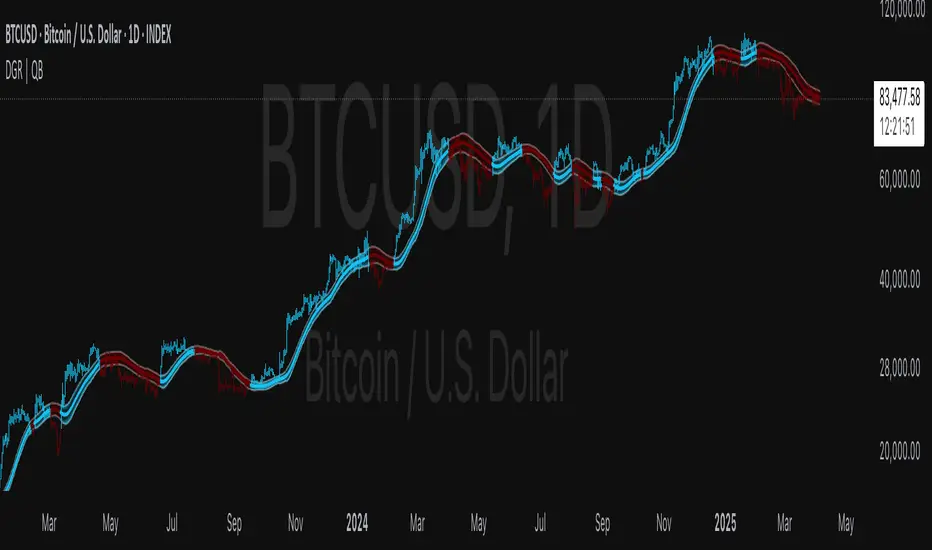
DEGA RMA | QuantEdgeB🧠 Introducing DEGA RMA (DGR ) by QuantEdgeB
🛠️ Overview
DEGA RMA (DGR) is a precision-engineered trend-following system that merges DEMA, Gaussian kernel smoothing, and ATR-based envelopes into a single, seamless overlay indicator. Its mission: to filter out market noise while accurately capturing directional bias using a layered volatility-sensitive trend core.
DGR excels at identifying valid breakouts, sustained momentum conditions, and trend-defining price behavior without falling into the trap of frequent signal reversals.
🔍 How It Works
1️⃣ Double Exponential Moving Average (DEMA)
The system begins by applying a DEMA to the selected price source. DEMA responds faster than a traditional EMA, making it ideal for capturing transitions in momentum.
2️⃣ Gaussian Filtering
A custom Gaussian kernel is used to smooth the DEMA signal. The Gaussian function applies symmetrical weights, centered around the most recent bar, effectively softening sharp price oscillations while preserving the underlying trend structure.
3️⃣ Recursive Moving Average (RMA) Core
The filtered Gaussian output is then processed through an RMA to generate a stable dynamic baseline. This baseline becomes the foundation for the final trend logic.
4️⃣ ATR-Scaled Breakout Zones
Upper and lower trend envelopes are calculated using a custom ATR filter built on DEMA-smoothed volatility.
• ✅ Long Signal when price closes above the upper envelope
• ❌ Short Signal when price closes below the lower envelope
• ➖ Neutral when inside the band (no signal noise)
✨ Key Features
🔹 Multi-Layer Trend Model
DEMA → Gaussian → RMA creates a signal structure that is both responsive and robust.
🔹 Volatility-Aware Entry System
Adaptive ATR bands adjust in real-time, expanding during high volatility and contracting during calm periods.
🔹 Noise-Reducing Gaussian Kernel
Sigma-adjustable kernel ensures signal smoothness without introducing excessive lag.
🔹 Clean Visual System
Candle coloring and band fills make trend state easy to read and act on at a glance.
⚙️ Custom Settings
• DEMA Source – Input source for trend core (default: close)
• DEMA Length – Length for initial smoothing (default: 30)
• Gaussian Filter Length – Determines smoothing depth (default: 4)
• Gaussian Sigma – Sharpness of Gaussian curve (default: 2.0)
• RMA Length – Core baseline smoothing (default: 12)
• ATR Length – Volatility detection period (default: 40)
• ATR Mult Up/Down – Controls the upper/lower threshold range for signals (default: 1.7)
📌 How to Use
1️⃣ Trend-Following Mode
• Go Long when price closes above the upper ATR band
• Go Short when price closes below the lower ATR band
• Remain neutral otherwise
2️⃣ Breakout Confirmation Tool
DGR’s ATR-based zone logic helps validate price breakouts and filter out false signals that occur inside compressed ranges.
3️⃣ Volatility Monitoring
Watch the ATR envelope width — a narrowing band often precedes expansion and potential directional shifts.
📌 Conclusion
DEGA RMA (DGR) is a thoughtfully constructed trend-following framework that goes beyond basic moving averages. Its Gaussian smoothing, adaptive ATR thresholds, and layered filtering logic provide a versatile solution for traders looking for cleaner signals, less noise, and real-time trend awareness.
Whether you're trading crypto, forex, or equities — DGR adapts to volatility while keeping your chart clean and actionable.
🔹 Summary
• ✅ Advanced Smoothing → DEMA + Gaussian + RMA = ultra-smooth trend core
• ✅ Volatility-Adjusted Zones → ATR envelope scaling removes whipsaws
• ✅ Fully Customizable → Tailor to any asset or timeframe
• ✅ Quant-Inspired Structure → Built for clarity, consistency, and confidence
📌 Disclaimer: Past performance is not indicative of future results. No trading strategy can guarantee success in financial markets.
📌 Strategic Advice: Always backtest, optimize, and align parameters with your trading objectives and risk tolerance before live trading.
Gaussian Smooth Trend | QuantEdgeB🧠 Introducing Gaussian Smooth Trend (GST) by QuantEdgeB
🛠️ Overview
Gaussian Smooth Trend (GST) is an advanced volatility-filtered trend-following system that blends multiple smoothing techniques into a single directional bias tool. It is purpose-built to reduce noise, isolate meaningful price shifts, and deliver early trend detection while dynamically adapting to market volatility.
GST leverages the Gaussian filter as its core engine, wrapped in a layered framework of DEMA smoothing, SMMA signal tracking, and standard deviation-based breakout thresholds, producing a powerful toolset for trend confirmation and momentum-based decision-making.
🔍 How It Works
1️⃣ DEMA Smoothing Engine
The indicator begins by calculating a Double Exponential Moving Average (DEMA), which provides a responsive and noise-resistant base input for subsequent filtering.
2️⃣ Gaussian Filter
A custom Gaussian kernel is applied to the DEMA signal, allowing the system to detect smooth momentum shifts while filtering out short-term volatility.
This is especially powerful during low-volume or sideways markets where traditional MAs struggle.
3️⃣ SMMA Layer with Z-Filtering
The filtered Gaussian signal is then passed through a custom Smoothed Moving Average (SMMA). A standard deviation envelope is constructed around this SMMA, dynamically expanding/contracting based on market volatility.
4️⃣ Signal Generation
• ✅ Long Signal: Price closes above Upper SD Band
• ❌ Short Signal: Price closes below Lower SD Band
• ➖ No trade: Price stays within the band → market indecision
✨ Key Features
🔹 Multi-Stage Trend Detection
Combines DEMA → Gaussian Kernel → SMMA → SD Bands for robust signal integrity across market conditions.
🔹 Gaussian Adaptive Filtering
Applies a tunable sigma parameter for the Gaussian kernel, enabling you to fine-tune smoothness vs. responsiveness.
🔹 Volatility-Aware Trend Zones
Price must close outside of dynamic SD envelopes to trigger signals — reducing whipsaws and increasing signal quality.
🔹 Dynamic Color-Coded Visualization
Candle coloring and band fills reflect live trend state, making the chart intuitive and fast to read.
⚙️ Custom Settings
• DEMA Source: Price stream used for smoothing (default: close)
• DEMA Length: Period for initial exponential smoothing (default: 7)
• Gaussian Length / Sigma: Controls smoothing strength of kernel filter
• SMMA Length: Final smoothing layer (default: 12)
• SD Length: Lookback period for standard deviation filtering (default: 30)
• SD Mult Up / Down: Adjusts distance of upper/lower breakout zones (default: 2.5 / 1.8)
• Color Modes: Six distinct color palettes (e.g., Strategy, Warm, Cool)
• Signal Labels: Toggle on/off entry markers ("𝓛𝓸𝓷𝓰", "𝓢𝓱𝓸𝓻𝓽")
📌 Trading Applications
✅ Trend-Following → Enter on confirmed breakouts from Gaussian-smoothed volatility zones
✅ Breakout Validation → Use SD bands to avoid false breakouts during chop
✅ Volatility Compression Monitoring → Narrowing bands often precede large directional moves
✅ Overlay-Based Confirmation → Can complement other QuantEdgeB indicators like K-DMI, BMD, or Z-SMMA
📌 Conclusion
Gaussian Smooth Trend (GST) delivers a precision-built trend model tailored for modern traders who demand both clarity and control. The layered signal architecture, combined with volatility awareness and Gaussian signal enhancement, ensures accurate entries, clean visualizations, and actionable trend structure — all in real-time.
🔹 Summary Highlights
1️⃣ Multi-stage Smoothing — DEMA → Gaussian → SMMA for deep signal integrity
2️⃣ Volatility-Aware Filtering — SD bands prevent false entries
3️⃣ Visual Trend Mapping — Gradient fills + candle coloring for clean charts
4️⃣ Highly Customizable — Adapt to your timeframe, style, and volatility
📌 Disclaimer: Past performance is not indicative of future results. No trading strategy can guarantee success in financial markets.
📌 Strategic Advice: Always backtest, optimize, and align parameters with your trading objectives and risk tolerance before live trading.

Z SMMA | QuantEdgeB📈 Introducing Z-Score SMMA (Z SMMA) by QuantEdgeB
🛠️ Overview
Z SMMA is a momentum-driven oscillator designed to track the standardized deviation of a Smoothed Moving Average (SMMA). By applying Z-score normalization, this tool dynamically adapts to price volatility, enabling traders to detect meaningful directional shifts and trend changes with enhanced clarity.
It serves both as a trend-following and mean-reversion system, identifying opportunities through standardized thresholds while remaining robust across volatile and calm market conditions.
✨ Key Features
🔹 Z-Score Normalization Engine
Applies Z-score to a custom SMMA baseline, allowing traders to compare price action relative to its recent volatility-adjusted mean.
🔹 Dynamic Trend Detection
Generates actionable long/short signals based on customizable Z-thresholds, making it adaptable across different asset classes and timeframes.
🔹 Overbought/Oversold Zones
Highlight reversion and profit-taking zones (default OB: +2 to +4, OS: -2 to -4), great for counter-trend or mean-reversion strategies.
🔹 Visual Reinforcement Tools
Includes candle coloring, gradient fills, and optional ALMA/EMA band overlays to visualize trend regime transitions.
🔍 How It Works
1️⃣ Z-Score SMMA Calculation
The core is a custom Smoothed Moving Average (SMMA) that is normalized by its standard deviation over a lookback period.
Final Formula:
Z = (SMMA - Mean) / StdDev
2️⃣ Signal Generation
• ✅ Long Bias: Z-Score > Long Threshold (default: 0)
• ❌ Short Bias: Z-Score < Short Threshold (default: 0)
3️⃣ Visual Aids
• Candle Color → Shows trend bias
• Band Fills → Highlight trend strength
• Overlays → Optional ALMA/EMA bands for structure analysis
⚙️ Custom Settings
• SMMA Length → Default: 12
• Z-Score Lookback → Default: 30
• Long Threshold → Default: 0
• Short Threshold → Default: 0
• Color Themes → Choose from 6 visual modes
• Extra Plots → Toggle advanced overlays (ALMA, EMA, bands)
• Label Display → Show/hide “𝓛𝓸𝓷𝓰” & “𝓢𝓱𝓸𝓻𝓽” markers
👥 Who Should Use It?
✅ Trend Traders → For early entries with confirmation from Z-score expansion
✅ Quantitative Analysts → Standardized deviation enables comparison across assets
✅ Mean-Reversion Traders → Use OB/OS zones to fade parabolic spikes
✅ Swing & Systematic Traders → Identify momentum shifts with optional ALMA/EMA overlays
📌 Conclusion
Z SMMA offers a smart, adaptive framework for tracking deviation from equilibrium in a quant-friendly format. Whether you're looking to follow trends or catch exhaustion points, Z SMMA provides a clear, standardized view of momentum and price extremes.
🔹 Key Takeaways:
1️⃣ Z-Score standardization ensures dynamic range awareness
2️⃣ SMMA base filters out noise, offering smoother signals
3️⃣ Color-coded visuals support faster reaction and cleaner charts
📌 Disclaimer: Past performance is not indicative of future results. No trading strategy can guarantee success in financial markets.
📌 Strategic Advice: Always backtest, optimize, and align parameters with your trading objectives and risk tolerance before

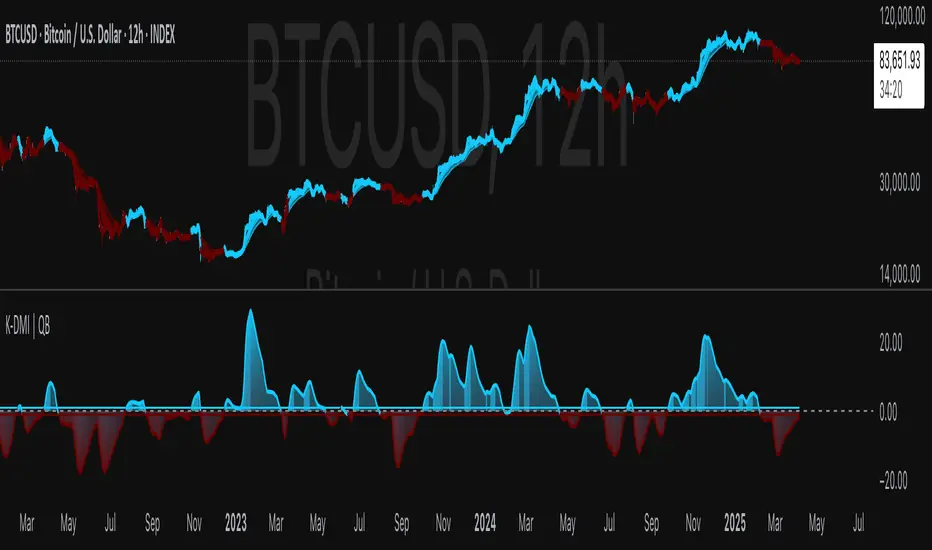
Kernel Weighted DMI | QuantEdgeB📊 Introducing Kernel Weighted DMI (K-DMI) by QuantEdgeB
🛠️ Overview
K-DMI is a next-gen momentum indicator that combines the traditional Directional Movement Index (DMI) with advanced kernel smoothing techniques to produce a highly adaptive, noise-resistant trend signal.
Unlike standard DMI that can be overly reactive or choppy in consolidation phases, K-DMI applies kernel-weighted filtering (Linear, Exponential, or Gaussian) to stabilize directional movement readings and extract a more reliable momentum signal.
✨ Key Features
🔹 Kernel Smoothing Engine
Smooths DMI using your choice of kernel (Linear, Exponential, Gaussian) for flexible noise reduction and clarity.
🔹 Dynamic Trend Signal
Generates real-time long/short trend bias based on signal crossing upper or lower thresholds (defaults: ±1).
🔹 Visual Encoding
Includes directional gradient fills, candle coloring, and momentum-based overlays for instant signal comprehension.
🔹 Multi-Mode Plotting
Optional moving average overlays visualize structure and compression/expansion within price action.
📐 How It Works
1️⃣ Directional Movement Index (DMI)
Calculates the traditional +DI and -DI differential to derive directional bias.
2️⃣ Kernel-Based Smoothing
Applies a custom-weighted average across historical DMI values using one of three smoothing methods:
• Linear → Simple tapering weights
• Exponential → Decay curve for recent emphasis
• Gaussian → Bell-shaped weight for centered precision
3️⃣ Signal Generation
• ✅ Long → Signal > Long Threshold (default: +1)
• ❌ Short → Signal < Short Threshold (default: -1)
Additional overlays signal potential compression zones or trend resumption using gradient and line fills.
⚙️ Custom Settings
• DMI Length: Default = 7
• Kernel Type: Options → Linear, Exponential, Gaussian (Def:Linear)
• Kernel Length: Default = 25
• Long Threshold: Default = 1
• Short Threshold: Default = -1
• Color Mode: Strategy, Solar, Warm, Cool, Classic, Magic
• Show Labels: Optional entry signal labels (Long/Short)
• Enable Extra Plots: Toggle MA overlays and dynamic bands
👥 Who Is It For?
✅ Trend Traders → Identify sustained directional bias with smoother signal lines
✅ Quant Analysts → Leverage advanced smoothing models to enhance data clarity
✅ Discretionary Swing Traders → Visualize clean breakouts or fades within choppy zones
✅ MA Compression Traders → Use overlay MAs to detect expansion opportunities
📌 Conclusion
Kernel Weighted DMI is the evolution of classic momentum tracking—merging traditional DMI logic with adaptable kernel filters. It provides a refined lens for trend detection, while optional visual overlays support price structure analysis.
🔹 Key Takeaways:
1️⃣ Smoothed and stabilized DMI for reliable trend signal generation
2️⃣ Optional Gaussian/exponential weighting for adaptive responsiveness
3️⃣ Custom gradient fills, dynamic MAs, and candle coloring to support visual clarity
📌 Disclaimer: Past performance is not indicative of future results. No trading strategy can guarantee success in financial markets.
📌 Strategic Advice: Always backtest, optimize, and align parameters with your trading objectives and risk tolerance before live trading.
Normalized DEMA Oscillator SD| QuantEdgeB📊 Introducing Normalized DEMA Oscillator SD (NDOSD) by QuantEdgeB
🛠️ Overview
Normalized DEMA Oscillator SD (NDOSD) is a powerful trend and momentum indicator that blends DEMA-based smoothing with a standard deviation-based normalization engine. The result is an oscillator that adapts to volatility, filters noise, and highlights both trend continuations and reversal zones with exceptional clarity.
It normalizes price momentum within an adaptive SD envelope, allowing comparisons across assets and market conditions. Whether you're a trend trader or mean-reverter, NDOSD provides the insight needed for smarter decision-making.
✨ Key Features
🔹 DEMA-Powered Momentum Core
Utilizes a Double EMA (DEMA) for smoother trend detection with reduced lag.
🔹 Normalized SD Bands
Price momentum is standardized using a dynamic 2× standard deviation range—enabling consistent interpretation across assets and timeframes.
🔹 Overbought/Oversold Detection
Includes clear OB/OS zones with shaded thresholds to identify potential reversals or trend exhaustion areas.
🔹 Visual Trend Feedback
Color-coded oscillator zones, candle coloring, and optional signal labels help traders immediately see trend direction and strength.
📐 How It Works
1️⃣ DEMA Calculation
The core of NDOSD is a smoothed price line using a Double EMA, designed to reduce false signals in choppy markets.
2️⃣ Normalization with SD
The DEMA is normalized within a volatility range using a 2x SD calculation, producing a bounded oscillator from 0–100. This transforms the raw signal into a structured format, allowing for OB/OS detection and trend entry clarity.
3️⃣ Signal Generation
• ✅ Long Signal → Oscillator crosses above the long threshold (default: 55) and price holds above the lower SD boundary.
• ❌ Short Signal → Oscillator drops below short threshold (default: 45), often within upper SD boundary context.
4️⃣ OB/OS Thresholds
• Overbought Zone: Above 100 → Caution / Consider profit-taking.
• Oversold Zone: Below 0 → Watch for accumulation setups.
⚙️ Custom Settings
• Calculation Source: Default = close
• DEMA Period: Default = 30
• Base SMA Period: Default = 20
• Long Threshold: Default = 55
• Short Threshold: Default = 45
• Color Mode: Choose from Strategy, Solar, Warm, Cool, Classic, or Magic
• Signal Labels Toggle: Show/hide Long/Short markers on chart
👥 Ideal For
✅ Trend Followers – Identify breakout continuation zones using oscillator thrust and SD structure
✅ Swing Traders – Catch mid-trend entries or mean reversion setups at OB/OS extremes
✅ Quant/Systemic Traders – Normalize signals for algorithmic integration across assets
✅ Multi-Timeframe Analysts – Easily compare trend health using standardized oscillator ranges
📌 Conclusion
Normalized DEMA Oscillator SD is a sleek and adaptive momentum toolkit that helps traders distinguish true momentum from false noise. With its fusion of DEMA smoothing and SD normalization, it works equally well in trending and range-bound conditions.
🔹 Key Takeaways:
1️⃣ Smoother momentum tracking using DEMA
2️⃣ Cross-asset consistency via SD-based normalization
3️⃣ Versatile for both trend confirmation and reversal identification
📌 Disclaimer: Past performance is not indicative of future results. No trading strategy can guarantee success in financial markets.
📌 Strategic Advice: Always backtest, optimize, and align parameters with your trading objectives and risk tolerance before live trading.
Let me know if you want a strategy script or publish-ready layout for TradingView next!

Z-Score Normalized VIX StrategyThis strategy leverages the concept of the Z-score applied to multiple VIX-based volatility indices, specifically designed to capture market reversals based on the normalization of volatility. The strategy takes advantage of VIX-related indicators to measure extreme levels of market fear or greed and adjusts its position accordingly.
1. Overview of the Z-Score Methodology
The Z-score is a statistical measure that describes the position of a value relative to the mean of a distribution in terms of standard deviations. In this strategy, the Z-score is calculated for various volatility indices to assess how far their values are from their historical averages, thus normalizing volatility levels. The Z-score is calculated as follows:
Z = \frac{X - \mu}{\sigma}
Where:
• X is the current value of the volatility index.
• \mu is the mean of the index over a specified period.
• \sigma is the standard deviation of the index over the same period.
This measure tells us how many standard deviations the current value of the index is away from its average, indicating whether the market is experiencing unusually high or low volatility (fear or calm).
2. VIX Indices Used in the Strategy
The strategy utilizes four commonly referenced volatility indices:
• VIX (CBOE Volatility Index): Measures the market’s expectations of 30-day volatility based on S&P 500 options.
• VIX3M (3-Month VIX): Reflects expectations of volatility over the next three months.
• VIX9D (9-Day VIX): Reflects shorter-term volatility expectations.
• VVIX (VIX of VIX): Measures the volatility of the VIX itself, indicating the level of uncertainty in the volatility index.
These indices provide a comprehensive view of the current volatility landscape across different time horizons.
3. Strategy Logic
The strategy follows a long entry condition and an exit condition based on the combined Z-score of the selected volatility indices:
• Long Entry Condition: The strategy enters a long position when the combined Z-score of the selected VIX indices falls below a user-defined threshold, indicating an abnormally low level of volatility (suggesting a potential market bottom and a bullish reversal). The threshold is set as a negative value (e.g., -1), where a more negative Z-score implies greater deviation below the mean.
• Exit Condition: The strategy exits the long position when the combined Z-score exceeds the threshold (i.e., when the market volatility increases above the threshold, indicating a shift in market sentiment and reduced likelihood of continued upward momentum).
4. User Inputs
• Z-Score Lookback Period: The user can adjust the lookback period for calculating the Z-score (e.g., 6 periods).
• Z-Score Threshold: A customizable threshold value to define when the market has reached an extreme volatility level, triggering entries and exits.
The strategy also allows users to select which VIX indices to use, with checkboxes to enable or disable each index in the calculation of the combined Z-score.
5. Trade Execution Parameters
• Initial Capital: The strategy assumes an initial capital of $20,000.
• Pyramiding: The strategy does not allow pyramiding (multiple positions in the same direction).
• Commission and Slippage: The commission is set at $0.05 per contract, and slippage is set at 1 tick.
6. Statistical Basis of the Z-Score Approach
The Z-score methodology is a standard technique in statistics and finance, commonly used in risk management and for identifying outliers or unusual events. According to Dumas, Fleming, and Whaley (1998), volatility indices like the VIX serve as a useful proxy for market sentiment, particularly during periods of high uncertainty. By calculating the Z-score, we normalize volatility and quantify the degree to which the current volatility deviates from historical norms, allowing for systematic entry and exit based on these deviations.
7. Implications of the Strategy
This strategy aims to exploit market conditions where volatility has deviated significantly from its historical mean. When the Z-score falls below the threshold, it suggests that the market has become excessively calm, potentially indicating an overreaction to past market events. Entering long positions under such conditions could capture market reversals as fear subsides and volatility normalizes. Conversely, when the Z-score rises above the threshold, it signals increased volatility, which could be indicative of a bearish shift in the market, prompting an exit from the position.
By applying this Z-score normalized approach, the strategy seeks to achieve more consistent entry and exit points by reducing reliance on subjective interpretation of market conditions.
8. Scientific Sources
• Dumas, B., Fleming, J., & Whaley, R. (1998). “Implied Volatility Functions: Empirical Tests”. The Journal of Finance, 53(6), 2059-2106. This paper discusses the use of volatility indices and their empirical behavior, providing context for volatility-based strategies.
• Black, F., & Scholes, M. (1973). “The Pricing of Options and Corporate Liabilities”. Journal of Political Economy, 81(3), 637-654. The original Black-Scholes model, which forms the basis for many volatility-related strategies.

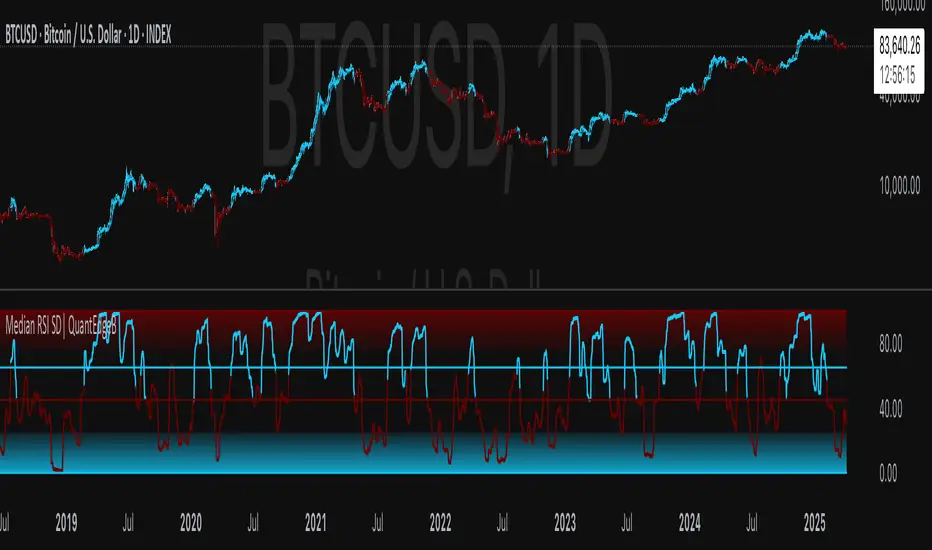
Median RSI SD| QuantEdgeB📈 Introducing Median RSI SD by QuantEdgeB
🛠️ Overview
Median RSI SD is a hybrid momentum tool that fuses two powerful techniques: Median Price Filtering and RSI-based Momentum. The result? A cleaner, more responsive oscillator designed to reduce noise and increase clarity in trend detection and potential reversals.
By applying the RSI not to raw price but to the percentile-based median, the indicator adapts better to real structural shifts in the market while filtering out temporary price spikes.
✨ Key Features
🔹 Smoothed RSI Momentum
Utilizes a percentile-based median as input to RSI, reducing volatility and enhancing signal reliability.
🔹 Volatility-Weighted SD Zones
Automatically detects overbought/oversold extremes using ±1 standard deviation bands on the median, adapting to current market volatility.
🔹 Trend Signal Overlay
A directional trend signal (Long / Short / Neutral) is derived from the RSI crossing custom thresholds, combined with position relative to SD bands.
🔹 Visual Labeling System
Optional in-chart labels for Long / Short signals and fully color-customizable theme modes.
📊 How It Works
1️⃣ Median RSI Calculation
Instead of using the close price directly, the script first computes a smoothed median via percentile ranking. RSI is then applied to this filtered stream, improving reactivity without overfitting to short-term noise.
2️⃣ Standard Deviation Filtering
Upper and lower SD bands are calculated around the median to identify extreme conditions. A position near the upper SD while RSI is below the short threshold triggers bearish bias. The reverse applies for longs.
3️⃣ Signal Generation
• ✅ Long Signal → RSI crosses above the Long Threshold (default: 65) and price holds above lower SD.
• ❌ Short Signal → RSI crosses below the Short Threshold (default: 45), typically within upper SD range.
4️⃣ Contextual Highlighting
Zone fills on the chart and RSI subgraph indicate Overbought (>75) and Oversold (<25) conditions for added clarity.
⚙️ Custom Settings
• RSI Length → Default: 21
• Median Length → Default: 10
• Long Threshold → Default: 65
• Short Threshold → Default: 45
• Color Mode → Choose from Strategy, Solar, Warm, Cool, Classic, Magic
• Signal Labels Toggle → Optional in-chart long/short labels
👥 Who Should Use It?
✅ Swing & Momentum Traders → Filter entries based on confirmed directional RSI setups.
✅ Range-Bound Traders → Use SD thresholds to spot fakeouts or exhaustion zones.
✅ Intraday Strategists → Enhanced signal clarity makes it usable even on lower timeframes.
✅ System Builders → Combine this signal with price action or confluence layers for smarter rules.
📌 Conclusion
Median RSI SD by QuantEdgeB is more than just a modified oscillator—it's a robust momentum confirmation framework designed for modern volatility. By replacing noisy price feeds with a statistically stable input and layering RSI + SD logic, this tool provides high-clarity signals without sacrificing responsiveness.
🔹 Key Takeaways:
1️⃣ Median-filtered RSI eliminates noise without lag
2️⃣ Standard deviation bands identify exhaustion zones
3️⃣ Reliable for both trend continuation and mean-reversion strategies
📌 Disclaimer: Past performance is not indicative of future results. No trading strategy can guarantee success in financial markets.
📌 Strategic Advice: Always backtest, optimize, and align parameters with your trading objectives and risk tolerance before live trading.
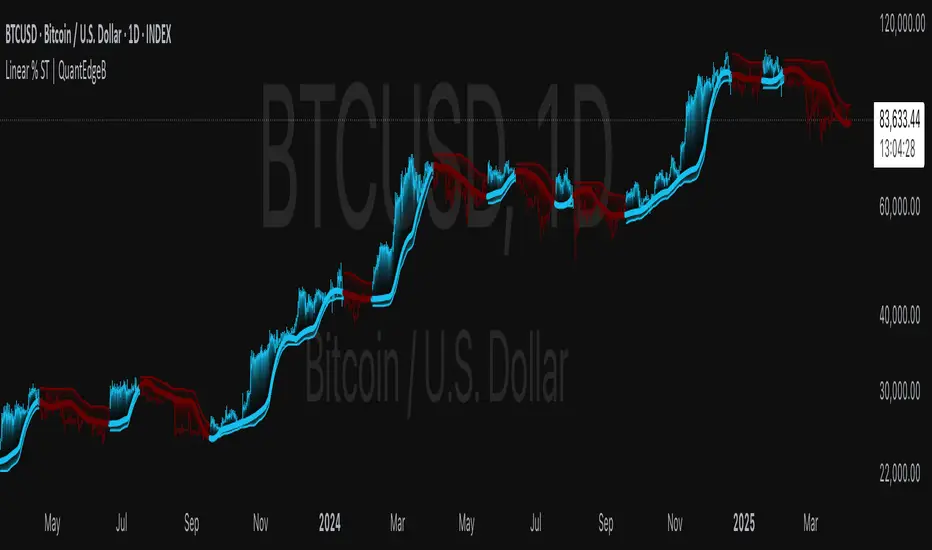
Linear % ST | QuantEdgeB🚀 Introducing Linear Percentile SuperTrend (Linear % ST) by QuantEdgeB
🛠️ Overview
Linear % SuperTrend (Linear % ST) by QuantEdgeB is a hybrid trend-following indicator that combines Linear Regression, Percentile Filters, and Volatility-Based SuperTrend Logic into one dynamic tool. This system is designed to identify trend shifts early while filtering out noise during choppy market conditions.
By utilizing percentile-based median smoothing and customized ATR multipliers, this tool captures both breakout momentum and pullback opportunities with precision.
✨ Key Features
🔹 Percentile-Based Median Filtering
Removes outliers and normalizes price movement for cleaner trend detection using the 50th percentile (median) of recent price action.
🔹 Linear Regression Smoothing
A smoothed baseline is computed with Linear Regression to detect the underlying trend while minimizing lag.
🔹 SuperTrend Structure with Adaptive Bands
The indicator implements an enhanced SuperTrend engine with custom ATR bands that adapt to trend direction. Bands tighten or loosen based on volatility and trend strength.
🔹 Dynamic Long/Short Conditions
Long and short signals are derived from the relationship between price and the SuperTrend threshold zones, clearly showing trend direction with optional "Long"/"Short" labels on the chart.
🔹 Multiple Visual Themes
Select from 6 built-in color palettes including Strategy, Solar, Warm, Cool, Classic, and Magic to match your personal style or strategy layout.
📊 How It Works
1️⃣ Percentile Filtering
The source price (default: close) is filtered using a nearest-rank 50th percentile over a custom lookback. This normalizes data to reflect the central tendency and removes noisy extremes.
2️⃣ Linear Regression Trend Base
A Linear Regression Moving Average (LSMA) is applied to the filtered median, forming the core trend line. This dynamic trendline provides a low-lag yet smooth view of market direction.
3️⃣ SuperTrend Engine
ATR is applied with custom multipliers (different for long and short) to create dynamic bands. The bands react to price movement and only shift direction after confirmation, preventing false flips.
4️⃣ Trend Signal Logic
• When price stays above the dynamic lower band → Bullish trend
• When price breaks below the upper band → Bearish trend
• Trend direction remains stable until violated by price.
⚙️ Custom Settings
• Percentile Length → Lookback for percentile smoothing (default: 35)
• LSMA Length → Determines the base trend via linear regression (default: 24)
• ATR Length → ATR period used in dynamic bands (default: 14)
• Long Multiplier → ATR multiplier for bullish thresholds (default: 0.8)
• Short Multiplier → ATR multiplier for bearish thresholds (default: 1.9)
✅ How to Use
1️⃣ Trend-Following Strategy
✔️ Go Long when price breaks above the lower ATR band, initiating an upward trend
✔️ Go Short when price falls below the upper ATR band, confirming bearish conditions
✔️ Remain in trend direction until the SuperTrend flips
2️⃣ Visual Confirmation
✔️ Use bar coloring and the dynamic bands to stay aligned with trend direction
✔️ Optional Long/Short labels highlight key signal flips
👥 Who Should Use Linear % ST?
✅ Swing & Position Traders → To ride trends confidently
✅ Trend Followers → As a primary directional filter
✅ Breakout Traders → For clean signal generation post-range break
✅ Quant/Systematic Traders → Integrate clean trend logic into algorithmic setups
📌 Conclusion
Linear % ST by QuantEdgeB blends percentile smoothing with linear regression and volatility bands to deliver a powerful, adaptive trend-following engine. Whether you're a discretionary trader seeking cleaner entries or a systems-based trader building logic for automation, Linear % ST offers clarity, adaptability, and precision in trend detection.
🔹 Key Takeaways:
1️⃣ Percentile + Regression = Noise-Reduced Core Trend
2️⃣ ATR-Based SuperTrend = Reliable Breakout Confirmation
3️⃣ Flexible Parameters + Color Modes = Custom Fit for Any Strategy
📈 Use it to spot emerging trends, filter false signals, and stay confidently aligned with market momentum.
📌 Disclaimer: Past performance is not indicative of future results. No trading strategy can guarantee success in financial markets.
📌 Strategic Advice: Always backtest, optimize, and align parameters with your trading objectives and risk tolerance before live trading.
Quantile DEMA Trend | QuantEdgeB🚀 Introducing Quantile DEMA Trend (QDT) by QuantEdgeB
🛠️ Overview
Quantile DEMA Trend (QDT) is an advanced trend-following and momentum detection indicator designed to capture price trends with superior accuracy. Combining DEMA (Double Exponential Moving Average) with SuperTrend and Quantile Filtering, QDT identifies strong trends while maintaining the ability to adapt to various market conditions.
Unlike traditional trend indicators, QDT uses percentile filtering to adjust for volatility and provides dynamic thresholds, ensuring consistent signal performance across different assets and timeframes.
✨ Key Features
🔹 Trend Following with Adaptive Sensitivity
The DEMA component ensures quicker responses to price changes while reducing lag, offering a real-time reflection of market momentum.
🔹 Volatility-Adjusted Filtering
The SuperTrend logic incorporates quantile percentile filters and ATR (Average True Range) multipliers, allowing QDT to adapt to fluctuating market volatility.
🔹 Clear Signal Generation
QDT generates clear Long and Short signals using percentile thresholds, effectively identifying trend changes and market reversals.
🔹 Customizable Visual & Signal Settings
With multiple color modes and customizable settings, you can easily align the QDT indicator with your trading strategy, whether you're focused on trend-following or volatility adjustments.
📊 How It Works
1️⃣ DEMA Calculation
DEMA is used to reduce lag compared to traditional moving averages. It is calculated by applying a Double Exponential Moving Average to price data. This smoother trend-following mechanism ensures responsiveness to market movements without introducing excessive noise.
2️⃣ SuperTrend with Percentile Filtering
The SuperTrend component adapts the trend-following signal by incorporating quantile percentile filters. It identifies dynamic support and resistance levels based on historical price data:
• Upper Band: Calculated using the 75th percentile + ATR (adjusted with multiplier)
• Lower Band: Calculated using the 25th percentile - ATR (adjusted with multiplier)
These dynamic bands adjust to market conditions, filtering out noise while identifying the true direction.
3️⃣ Signal Generation
• Long Signal: Triggered when price crosses below the SuperTrend Lower Band
• Short Signal: Triggered when price crosses above the SuperTrend Upper Band
The indicator provides signals with corresponding trend direction based on these crossovers.
👁 Visual & Custom Features
• 🎨 Multiple Color Modes: Choose from "Strategy", "Solar", "Warm", "Cool", "Classic", and "Magic" color palettes to match your charting style.
• 🏷️ Long/Short Signal Labels: Optional labels for visual cueing when a long or short trend is triggered.
• 📉 Bar Color Customization: Bar colors dynamically adjust based on trend direction to visually distinguish the market bias.
👥 Who Should Use QDT?
✅ Trend Followers: Use QDT as a dynamic tool to confirm trends and capture profits in trending markets.
✅ Swing Traders: Use QDT to time entries based on confirmed breakouts or breakdowns.
✅ Volatility Traders: Identify market exhaustion or expansion points, especially during volatile periods.
✅ Systematic & Quant Traders: Integrate QDT into algorithmic strategies to enhance market detection with adaptive filtering.
⚙️ Customization & Default Settings
- DEMA Length(30): Controls the lookback period for DEMA calculation
- Percentile Length(10): Sets the lookback period for percentile filtering
- ATR Length(14): Defines the length for calculating ATR (used in SuperTrend)
- ATR Multiplier(1.2 ): Multiplier for ATR in SuperTrend calculation
- SuperTrend Length(30):Defines the length for SuperTrend calculations
📌 How to Use QDT in Trading
1️⃣ Trend-Following Strategy
✔ Enter Long positions when QDT signals a bullish breakout (price crosses below the SuperTrend lower band).
✔ Enter Short positions when QDT signals a bearish breakdown (price crosses above the SuperTrend upper band).
✔ Hold positions as long as QDT continues to provide the same direction.
2️⃣ Reversal Strategy
✔ Take profits when price reaches extreme levels (upper or lower percentile zones) that may indicate trend exhaustion or reversion.
3️⃣ Volatility-Driven Entries
✔ Use the percentile filtering to enter positions based on mean-reversion logic or breakout setups in volatile markets.
🧠 Why It Works
QDT combines the DEMA’s quick response to price changes with SuperTrend's volatility-adjusted thresholds, ensuring a responsive and adaptive indicator. The use of percentile filters and ATR multipliers helps adjust to varying market conditions, making QDT suitable for both trending and range-bound environments.
🔹 Conclusion
The Quantile DEMA Trend (QDT) by QuantEdgeB is a powerful, adaptive trend-following and momentum detection system. By integrating DEMA, SuperTrend, and quantile percentile filtering, it provides accurate and timely signals while adjusting to market volatility. Whether you are a trend follower or volatility trader, QDT offers a robust solution to identify high-probability entry and exit points.
🔹 Key Takeaways:
1️⃣ Trend Confirmation – Uses DEMA and SuperTrend for dynamic trend detection
2️⃣ Volatility Filtering – Adjusts to varying market conditions using percentile logic
3️⃣ Clear Signal Generation – Easy-to-read signals and visual cues for strategy implementation
📌 Disclaimer: Past performance is not indicative of future results. No trading strategy can guarantee success in financial markets.
📌 Strategic Advice: Always backtest, optimize, and align parameters with your trading objectives and risk tolerance before live trading.

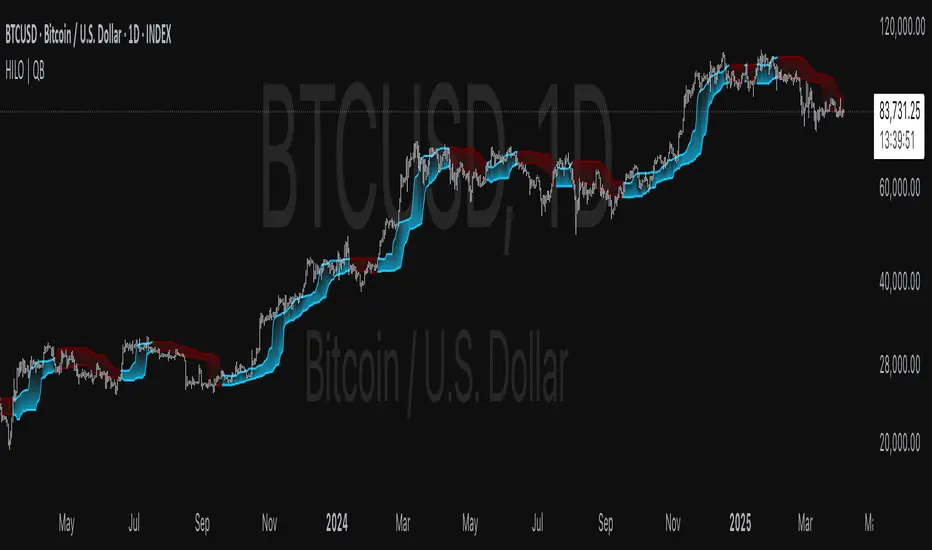
HILO Interpolation | QuantEdgeB🚀 Introducing HILO Interpolation by QuantEdgeB
🛠️ Overview
HILO Interpolation is a dynamic price-action based signal engine crafted to adapt across trending and ranging conditions. By leveraging percentile-based price band interpolation, it identifies high-confidence breakout and breakdown zones. This indicator is designed to serve both as a momentum trigger in trend phases and as a price-reactive entry system during range-bound consolidation.
By intelligently switching between percentile thresholds and interpolated logic, HILO minimizes noise and whipsaws commonly seen in traditional crossover systems.
✨ Key Features
🔹 Percentile Interpolation Engine
Tracks price breakouts using percentile thresholds, making it adaptable to volatility and asset-specific structure.
🔹 Price-Based Signal Confirmation
Signals are only triggered when price meaningfully crosses through key percentile thresholds (based on historical high/low logic).
🔹 Visual Trend Encoding
Color-coded candles, dynamic interpolation bands, and optional long/cash labels give clear visual cues for trend and trade direction.
🔹 Dynamic Threshold Switching
Interpolated threshold flips based on where price sits relative to percentile bands—providing adaptive long/short logic.
📊 How It Works
1️⃣ Percentile Zone Definition
HILO defines two key percentiles from the historical high and low:
• Upper Threshold: 75th Percentile of Highs
• Lower Threshold: 50th Percentile of Lows
These are calculated using linear interpolation to ensure smoother transitions across lookback periods.
2️⃣ Adaptive Signal Line
Instead of using static crossovers, HILO dynamically flips its signal based on whether price exceeds the upper threshold or falls below the lower one.
📌 If price > upper → Signal = Short threshold
📌 If price < lower → Signal = Long threshold
📌 If price remains between thresholds → no flip (trend continuation)
3️⃣ Signal Logic
✅ Long Signal → Price exceeds upper bound while lower bound acts as ceiling
❌ Short Signal → Price breaks below lower percentile while upper bound flips
This simple yet powerful mechanism creates early entries while maintaining high signal confidence.
👁 Visual & Custom Features
• 🎨 Multiple Color Modes: Strategy, Solar, Warm, Cool, Classic, Magic
• 🔄 Dynamic Candle & Band Coloring
• 🏷️ Signal Labels: Optional “𝓛𝓸𝓷𝓰” and “𝓢𝓱𝓸𝓻𝓽” tags when trend flips
• 💬 Alerts Ready: Long/Short crossover conditions can trigger alerts instantly
👥 Who Should Use HILO?
✅ Breakout Traders – Catch early trend starts using percentile filters
✅ Swing Traders – Identify directional bias shifts in advance
✅ Range Strategists – Use band confluence zones to play reversions
✅ Quant & Rule-Based Traders – Incorporate percentile logic into broader systems
⚙️ Customization & Default Settings
Percentile Length:(Default 35) Lookback for calculating percentile thresholds
Lookback Period:(Default 4) Lag factor for interpolation responsiveness
Upper % Threshold: (Default 75) Defines breakout zone from historical highs
Lower % Threshold: (Default 50) Defines retest/accumulation zone from historical lows
📌 How to Use HILO in Trading
1️⃣ Trend-Following Strategy
✔ Enter long when price flips above the adaptive support line
✔ Exit or go short when price breaks below the interpolated resistance
✔ Continue position as long as trend color persists
2️⃣ Range-Reversion Strategy
✔ Buy when price tests the lower threshold and no short signal is triggered
✔ Sell or reduce when price hits the upper range boundary
🧠 Why It Works
HILO operates on the principle that historical price structure creates natural probabilistic thresholds. By interpolating between these using percentile logic, the system maintains adaptability to changing market conditions—without the lag of moving averages or the noise of fixed bands.
🔹 Conclusion
HILO Interpolation is a minimalist yet powerful signal engine built for adaptive breakout and reversion detection. Its percentile-based logic offers a novel way to identify structure shifts, giving traders an edge in both trend and range markets.
🔹 Key Takeaways:
1️⃣ Breakout Entry Logic – Uses percentile interpolation instead of static bands
2️⃣ Color-Driven Clarity – Visual clarity via gradient zone overlays
3️⃣ Trend Integrity – Avoids overfitting and responds only to significant price movements
📌 Disclaimer: Past performance is not indicative of future results. No trading strategy can guarantee success in financial markets.
📌 Strategic Advice: Always backtest, optimize, and align parameters with your trading objectives and risk tolerance before live trading.
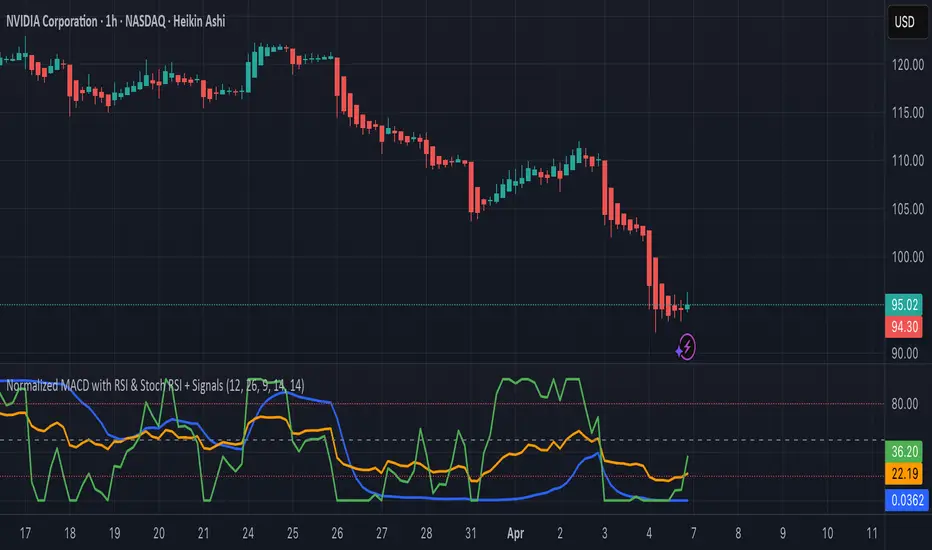
Normalized MACD with RSI & Stoch RSI + SignalsNormalized MACD with RSI & Stoch RSI Indicator
Overview:
This indicator combines three popular momentum indicators (MACD, RSI, and Stochastic RSI) into a single cohesive, normalized view, making it easier for traders to interpret market momentum and potential buy/sell signals. It specifically addresses an important issue—the different scale ranges of indicators—by normalizing MACD values to match the 0–100 scale of RSI and Stochastic RSI.
Here’s a clear and concise description of your updated Pine Script indicator:
⸻
Normalized MACD with RSI & Stoch RSI Indicator
Overview:
This indicator combines three popular momentum indicators (MACD, RSI, and Stochastic RSI) into a single cohesive, normalized view, making it easier for traders to interpret market momentum and potential buy/sell signals. It specifically addresses an important issue—the different scale ranges of indicators—by normalizing MACD values to match the 0–100 scale of RSI and Stochastic RSI.
⸻
Key Components:
① MACD (Normalized):
• The Moving Average Convergence Divergence (MACD) originally has an unlimited numerical range.
• Normalization Method:
• Uses a custom tanh(x) function implemented directly in Pine Script:
\tanh(x) = \frac{e^{x}-e^{-x}}{e^{x}+e^{-x}}
• MACD values are scaled using this method to a range of 0–100, with the neutral line at exactly 50.
• Interpretation:
• Values above 50 indicate bullish momentum.
• Values below 50 indicate bearish momentum.
② RSI (Relative Strength Index):
• Measures market momentum on a 0–100 scale.
• Traditional RSI interpretation:
• Overbought conditions: RSI > 70–80.
• Oversold conditions: RSI < 30–20.
③ Stochastic RSI:
• Combines RSI and Stochastic Oscillator to give short-term, highly sensitive signals.
• Helps identify immediate market extremes:
• Above 80 → Short-term overbought.
• Below 20 → Short-term oversold.
⸻
How the Indicator Works:
• Visualization:
• All three indicators (Normalized MACD, RSI, Stochastic RSI) share the same 0–100 scale.
• Clear visual lines and reference levels:
• Midline at 50 indicates neutral momentum.
• Dashed lines at 20 and 80 clearly mark oversold/overbought zones.
• Trading Signals (Recommended approach):
• Bullish Signal (Potential Buy):
• Normalized MACD crosses above 50.
• RSI below or approaching oversold zone (below 30–20).
• Stochastic RSI below 20, indicating short-term oversold conditions.
• Bearish Signal (Potential Sell):
• Normalized MACD crosses below 50.
• RSI above or approaching overbought zone (above 70–80).
• Stochastic RSI above 80, indicating short-term overbought conditions.
⸻
Why Use This Indicator?
• Harmonized Signals:
Normalization of MACD significantly improves clarity and comparability with RSI and Stochastic RSI, providing a unified momentum picture.
• Intuitive Analysis:
Traders can rapidly and intuitively identify momentum shifts without needing multiple indicator windows.
• Improved Decision-Making:
Clear visual references and signals help reduce subjective interpretation, potentially improving trading outcomes.
⸻
Suggested Usage:
• Combine with traditional support
Z-Score Normalized Volatility IndicesVolatility is one of the most important measures in financial markets, reflecting the extent of variation in asset prices over time. It is commonly viewed as a risk indicator, with higher volatility signifying greater uncertainty and potential for price swings, which can affect investment decisions. Understanding volatility and its dynamics is crucial for risk management and forecasting in both traditional and alternative asset classes.
Z-Score Normalization in Volatility Analysis
The Z-score is a statistical tool that quantifies how many standard deviations a given data point is from the mean of the dataset. It is calculated as:
Z = \frac{X - \mu}{\sigma}
Where X is the value of the data point, \mu is the mean of the dataset, and \sigma is the standard deviation of the dataset. In the context of volatility indices, the Z-score allows for the normalization of these values, enabling their comparison regardless of the original scale. This is particularly useful when analyzing volatility across multiple assets or asset classes.
This script utilizes the Z-score to normalize various volatility indices:
1. VIX (CBOE Volatility Index): A widely used indicator that measures the implied volatility of S&P 500 options. It is considered a barometer of market fear and uncertainty (Whaley, 2000).
2. VIX3M: Represents the 3-month implied volatility of the S&P 500 options, providing insight into medium-term volatility expectations.
3. VIX9D: The implied volatility for a 9-day S&P 500 options contract, which reflects short-term volatility expectations.
4. VVIX: The volatility of the VIX itself, which measures the uncertainty in the expectations of future volatility.
5. VXN: The Nasdaq-100 volatility index, representing implied volatility in the Nasdaq-100 options.
6. RVX: The Russell 2000 volatility index, tracking the implied volatility of options on the Russell 2000 Index.
7. VXD: Volatility for the Dow Jones Industrial Average.
8. MOVE: The implied volatility index for U.S. Treasury bonds, offering insight into expectations for interest rate volatility.
9. BVIX: Volatility of Bitcoin options, a useful indicator for understanding the risk in the cryptocurrency market.
10. GVZ: Volatility index for gold futures, reflecting the risk perception of gold prices.
11. OVX: Measures implied volatility for crude oil futures.
Volatility Clustering and Z-Score
The concept of volatility clustering—where high volatility tends to be followed by more high volatility—is well documented in financial literature. This phenomenon is fundamental in volatility modeling and highlights the persistence of periods of heightened market uncertainty (Bollerslev, 1986).
Moreover, studies by Andersen et al. (2012) explore how implied volatility indices, like the VIX, serve as predictors for future realized volatility, underlining the relationship between expected volatility and actual market behavior. The Z-score normalization process helps in making volatility data comparable across different asset classes, enabling more effective decision-making in volatility-based strategies.
Applications in Trading and Risk Management
By using Z-score normalization, traders can more easily assess deviations from the mean in volatility, helping to identify periods when volatility is unusually high or low. This can be used to adjust risk exposure or to implement volatility-based trading strategies, such as mean reversion strategies. Research suggests that volatility mean-reversion is a reliable pattern that can be exploited for profit (Christensen & Prabhala, 1998).
References:
• Andersen, T. G., Bollerslev, T., Diebold, F. X., & Vega, C. (2012). Realized volatility and correlation dynamics: A long-run approach. Journal of Financial Economics, 104(3), 385-406.
• Bollerslev, T. (1986). Generalized autoregressive conditional heteroskedasticity. Journal of Econometrics, 31(3), 307-327.
• Christensen, B. J., & Prabhala, N. R. (1998). The relation between implied and realized volatility. Journal of Financial Economics, 50(2), 125-150.
• Whaley, R. E. (2000). Derivatives on market volatility and the VIX index. Journal of Derivatives, 8(1), 71-84.

Reversal Trading Bot Strategy[BullByte]Overview :
The indicator Reversal Trading Bot Strategy is crafted to capture potential market reversal points by combining momentum, volatility, and trend alignment filters. It uses a blend of technical indicators to identify both bullish and bearish reversal setups, ensuring that multiple market conditions are met before entering a trade.
Core Components :
Technical Indicators Used :
RSI (Relative Strength Index) :
Purpose : Detects divergence conditions by comparing recent lows/highs in price with the RSI.
Parameter : Length of 8.
Bollinger Bands (BB) :
Purpose : Measures volatility and identifies price levels that are statistically extreme.
Parameter : Length of 20 and a 2-standard deviation multiplier.
ADX (Average Directional Index) & DMI (Directional Movement Index) :
Purpose : Quantifies the strength of the trend. The ADX threshold is set at 20, and additional filters check for the alignment of the directional indicators (DI+ and DI–).
ATR (Average True Range) :
Purpose : Provides a volatility measure used to set stop levels and determine risk through trailing stops.
Volume SMA (Simple Moving Average of Volume ):
Purpose : Helps confirm strength by comparing the current volume against a 20-period average, with an optional filter to ensure volume is at least twice the SMA.
User-Defined Toggle Filters :
Volume Filter : Confirms that the volume is above average (or twice the SMA) before taking trades.
ADX Trend Alignment Filter : Checks that the ADX’s directional indicators support the trade direction.
BB Close Confirmation : Optionally refines the entry by requiring price to be beyond the upper or lower Bollinger Band rather than just above or below.
RSI Divergence Exit : Allows the script to close positions if RSI divergence is detected.
BB Mean Reversion Exit : Closes positions if the price reverts to the Bollinger Bands’ middle line.
Risk/Reward Filter : Ensures that the potential reward is at least twice the risk by comparing the distance to the Bollinger Band with the ATR.
Candle Movement Filter : Optional filter to require a minimum percentage move in the candle to confirm momentum.
ADX Trend Exit : Closes positions if the ADX falls below the threshold and the directional indicators reverse.
Entry Conditions :
Bullish Entry :
RSI Divergence : Checks if the current close is lower than a previous low while the RSI is above the previous low, suggesting bullish divergence.
Bollinger Confirmation : Requires that the price is above the lower (or upper if confirmation is toggled) Bollinger Band.
Volume & Trend Filters : Combines volume condition, ADX strength, and an optional candle momentum condition.
Risk/Reward Check : Validates that the trade meets a favorable risk-to-reward ratio.
Bearish Entry :
Uses a mirror logic of the bullish entry by checking for bearish divergence, ensuring the price is below the appropriate Bollinger level, and confirming volume, trend strength, candle pattern, and risk/reward criteria.
Trade Execution and Exit Strateg y:
Trade Execution :
Upon meeting the entry conditions, the strategy initiates a long or short position.
Stop Loss & Trailing Stops :
A stop-loss is dynamically set using the ATR value, and trailing stops are implemented as a percentage of the close price.
Exit Conditions :
Additional exit filters can trigger early closures based on RSI divergence, mean reversion (via the middle Bollinger Band), or a weakening trend as signaled by ADX falling below its threshold.
This multi-layered exit strategy is designed to lock in gains or minimize losses if the market begins to reverse unexpectedly.
How the Strategy Works in Different Market Conditions :
Trending Markets :
The ADX filter ensures that trades are only taken when the trend is strong. When the market is trending, the directional movement indicators help confirm the momentum, making the reversal signal more reliable.
Ranging Markets :
In choppy markets, the Bollinger Bands expand and contract, while the RSI divergence can highlight potential turning points. The optional filters can be adjusted to avoid false signals in low-volume or low-volatility conditions.
Volatility Management :
With ATR-based stop-losses and a risk/reward filter, the strategy adapts to current market volatility, ensuring that risk is managed consistently.
Recommendation on using this Strategy with a Trading Bot :
This strategy is well-suited for high-frequency trading (HFT) due to its ability to quickly identify reversal setups and execute trades dynamically with automated stop-loss and trailing exits. By integrating this script with a TradingView webhook-based bot or an API-driven execution system, traders can automate trade entries and exits in real-time, reducing manual execution delays and capitalizing on fast market movements.
Disclaimer :
This script is provided for educational and informational purposes only. It is not intended as investment advice. Trading involves significant risk, and you should always conduct your own research and analysis before making any trading decisions. The author is not responsible for any losses incurred while using this script.

EMA 34 Crossover with Break Even Stop LossEMA 34 Crossover with Break Even Stop Loss Strategy
This trading strategy is based on the 34-period Exponential Moving Average (EMA) and aims to enter long positions when the price crosses above the EMA 34. The strategy is designed to manage risk effectively with a dynamic stop loss and take-profit mechanism.
Key Features:
EMA 34 Crossover:
The strategy generates a long entry signal when the closing price of the current bar crosses above the 34-period EMA, with the condition that the previous closing price was below the EMA. This crossover indicates a potential upward trend.
Risk Management:
Upon entering a trade, the strategy sets a stop loss at the low of the previous bar. This helps in controlling the downside risk.
A take profit level is set at a 10:1 risk-to-reward ratio, meaning the potential profit is ten times the amount risked on the trade.
Break-even Stop Loss:
As the price moves in favor of the trade and reaches a 3:1 risk-to-reward ratio, the strategy moves the stop loss to the entry price (break-even). This ensures that no loss will be incurred if the market reverses, effectively protecting profits.
Exit Conditions:
The strategy exits the trade when either the stop loss is hit (if the price drops below the stop loss level) or the take profit target is reached (if the price rises to the take profit level).
If the price reaches the break-even level (entry price), the stop loss is adjusted to lock in profits and prevent any loss.
Visualization:
The stop loss and take profit levels are plotted on the chart for easy visualization, helping traders track the status of their trade.
Trade Management Summary:
Long Entry: When price crosses above the 34-period EMA.
Stop Loss: Set to the low of the previous candle.
Take Profit: Set to a 10:1 risk-to-reward ratio.
Break-even: Stop loss is moved to entry price when a 3:1 risk-to-reward ratio is reached.
Exit: The trade is closed either when the stop loss or take profit levels are hit.
This strategy is designed to minimize losses by employing a dynamic stop loss and to maximize gains by setting a favorable risk-to-reward ratio, making it suitable for traders who prefer a structured, automated approach to risk management and trend-following.

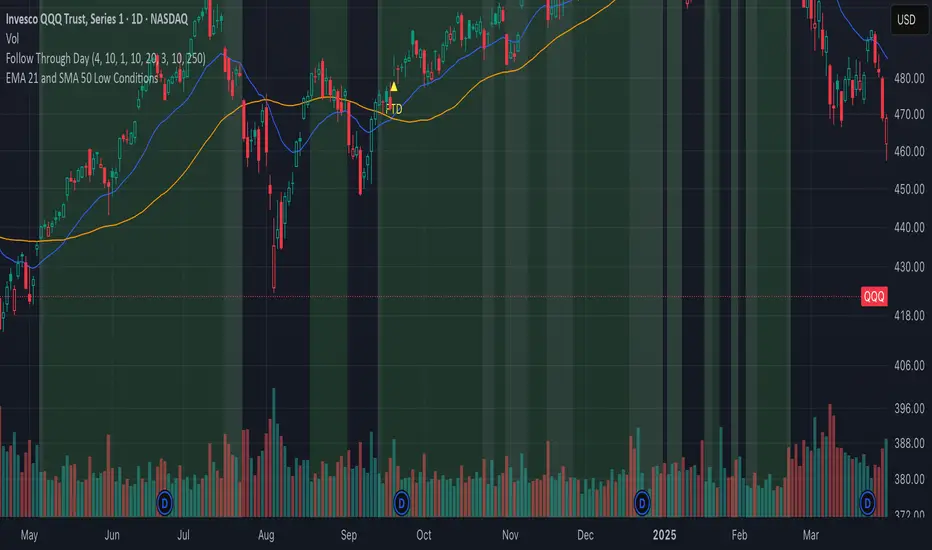
EMA 21 and SMA 50 Low ConditionsDescription:
This indicator highlights trend zones on a daily chart using the 21-day Exponential Moving Average (EMA) and 50-day Simple Moving Average (SMA). It’s designed to identify bullish conditions with two distinct background colors:
• Green Background: Signals a strong bullish trend. Appears when the low of the candle stays above the 21 EMA for 3 or more consecutive days, with either the 3rd or 4th day closing higher than its open (an “up” day). The green zone persists until a candle closes below the 21 EMA.
• Yellow Background: Indicates a potential support zone. Triggers when the low of the candle remains above the 50 SMA after the green condition ends, suggesting the price is still holding above a longer-term average. The yellow zone lasts until a candle closes below the 50 SMA.
Features:
• Plots the 21 EMA (blue line) and 50 SMA (orange line) for visual reference.
• Uses background colors to mark trend zones, making it easy to spot bullish phases and support levels.
• Optimized for daily timeframes, ideal for swing traders or long-term trend followers.
How to Use:
1. Apply the indicator to a daily chart.
2. Watch for the green background to identify strong bullish momentum (lows holding above the 21 EMA with an up close confirmation).
3. Look for the yellow background as a sign of potential support after the short-term trend weakens (lows above the 50 SMA).
4. Exit zones are triggered by closes below the respective averages (21 EMA for green, 50 SMA for yellow).
Notes:
• Best used on symbols with sufficient historical data to ensure accurate EMA and SMA calculations.
• The indicator prioritizes the green condition over yellow—green will override if both could apply.
Author’s Intent:
Created to help traders visualize sustained bullish trends and key support levels using simple moving average rules. Perfect for confirming uptrends and monitoring pullbacks within a broader bullish context.
BTC Trading RobotOverview
This Pine Script strategy is designed for trading Bitcoin (BTC) by placing pending orders (BuyStop and SellStop) based on local price extremes. The script also implements a trailing stop mechanism to protect profits once a position becomes sufficiently profitable.
________________________________________
Inputs and Parameter Setup
1. Trading Profile:
o The strategy is set up specifically for BTC trading.
o The systemType input is set to 1, which means the strategy will calculate trade parameters using the BTC-specific inputs.
2. Common Trading Inputs:
o Risk Parameters: Although RiskPercent is defined, its actual use (e.g., for position sizing) isn’t implemented in this version.
o Trading Hours Filter:
SHInput and EHInput let you restrict trading to a specific hour range. If these are set (non-zero), orders will only be placed during the allowed hours.
3. BTC-Specific Inputs:
o Take Profit (TP) and Stop Loss (SL) Percentages:
TPasPctBTC and SLasPctBTC are used to determine the TP and SL levels as a percentage of the current price.
o Trailing Stop Parameters:
TSLasPctofTPBTC and TSLTgrasPctofTPBTC determine when and by how much a trailing stop is applied, again as percentages of the TP.
4. Other Parameters:
o BarsN is used to define the window (number of bars) over which the local high and low are calculated.
o OrderDistPoints acts as a buffer to prevent the entry orders from being triggered too early.
________________________________________
Trade Parameter Calculation
• Price Reference:
o The strategy uses the current closing price as the reference for calculations.
• Calculation of TP and SL Levels:
o If the systemType is set to BTC (value 1), then:
Take Profit Points (Tppoints) are calculated by multiplying the current price by TPasPctBTC.
Stop Loss Points (Slpoints) are calculated similarly using SLasPctBTC.
A buffer (OrderDistPoints) is set to half of the take profit points.
Trailing Stop Levels:
TslPoints is calculated as a fraction of the TP (using TSLTgrasPctofTPBTC).
TslTriggerPoints is similarly determined, which sets the profit level at which the trailing stop will start to activate.
________________________________________
Time Filtering
• Session Control:
o The current hour is compared against SHInput (start hour) and EHInput (end hour).
o If the current time falls outside the allowed window, the script will not place any new orders.
________________________________________
Entry Orders
• Local Price Extremes:
o The strategy calculates a local high and local low using a window of BarsN * 2 + 1 bars.
• Placing Stop Orders:
o BuyStop Order:
A long entry is triggered if the current price is less than the local high minus the order distance buffer.
The BuyStop order is set to trigger at the level of the local high.
o SellStop Order:
A short entry is triggered if the current price is greater than the local low plus the order distance buffer.
The SellStop order is set to trigger at the level of the local low.
Note: Orders are only placed if there is no current open position and if the session conditions are met.
________________________________________
Trailing Stop Logic
Once a position is open, the strategy monitors profit levels to protect gains:
• For Long Positions:
o The script calculates the profit as the difference between the current price and the average entry price.
o If this profit exceeds the TslTriggerPoints threshold, a trailing stop is applied by placing an exit order.
o The stop price is set at a distance below the current price, while a limit (profit target) is also defined.
• For Short Positions:
o The profit is calculated as the difference between the average entry price and the current price.
o A similar trailing stop exit is applied if the profit exceeds the trigger threshold.
________________________________________
Summary
In essence, this strategy works by:
• Defining entry levels based on recent local highs and lows.
• Placing pending stop orders to enter the market when those levels are breached.
• Filtering orders by time, ensuring trades are only taken during specified hours.
• Implementing a trailing stop mechanism to secure profits once the trade moves favorably.
This approach is designed to automate BTC trading based on price action and dynamic risk management, although further enhancements (like dynamic position sizing based on RiskPercent) could be added for a more complete risk management system.

EMA Crossover (Short Focus with Trailing Stop)This strategy utilizes a combination of Exponential Moving Averages (EMA) and Simple Moving Averages (SMA) to generate entry and exit signals for both long and short positions. The core of the strategy is based on the 13-period EMA (short EMA) crossing the 33-period EMA (long EMA) for entering long trades, while a 13-period EMA crossing the 25-period EMA (mid EMA) generates short trade signals. The 100-period SMA and 200-period SMA serve as additional trend indicators to provide context for the market conditions. The strategy aims to capitalize on trend reversals and momentum shifts in the market.
The strategy is designed to execute trades swiftly with an emphasis on entering positions when conditions align in real time. For long entries, the strategy initiates a buy when the 13 EMA is greater than the 33 EMA, indicating a bullish trend. For short entries, the 13 EMA crossing below the 33 EMA signals a bearish trend, prompting a short position. Importantly, the code includes built-in exit conditions for both long and short positions. Long positions are exited when the 13 EMA falls below the 33 EMA, while short positions are closed when the 13 EMA crosses above the 25 EMA.
A key feature of the strategy is the use of trailing stops for both long and short positions. This dynamic exit method adjusts the stop level as the market moves in favor of the trade, locking in profits while reducing the risk of losses. The trailing stop for long positions is based on the high price of the current bar, while the trailing stop for short positions is set using the low price, providing more flexibility in managing risk. This trailing stop mechanism helps to capture profits from favorable market moves while ensuring that positions are exited if the market moves against them.
This strategy works best on the daily timeframe and is optimized for major cryptocurrency pairs. The daily chart allows for the EMAs to provide more reliable signals, as the strategy is designed to capture broader trends rather than short-term market fluctuations. Using it on major crypto pairs increases its effectiveness as these assets tend to have strong and sustained trends, providing better opportunities for the strategy to perform well.
