Daily Open Levels (Custom Pips)Daily Open Levels Indicator
Overview: The Daily Open Levels indicator is a simple but powerful tool designed for intraday traders who focus on the daily open price and pip-based levels for decision-making. This indicator helps you visualize key price levels based on the daily opening price, with configurable upper and lower levels calculated in pips. It is especially useful for tracking price movements relative to the previous day’s open and can help traders identify breakout zones, potential support/resistance, and key entry/exit points.
eatures:
Daily Open Price: The indicator automatically calculates and plots the daily open of the current trading day.
Upper and Lower Levels: Configurable upper and lower levels based on a user-defined pip interval. These levels can act as potential resistance or support zones.
Adjustable Pip Interval: You can customize the pip distance for the upper and lower levels to suit different trading styles and volatility.
Works for All Pairs: Option to automatically detect JPY pairs with a different pip value (0.1), or you can manually select your pair setting.
Color Customization: You can choose different colors for the daily open line, upper levels, and lower levels for easy visualization.
Immediate Visual Feedback: The indicator immediately draws the lines on the chart when added, without waiting for any market data.
How It Works:
The daily open price is retrieved from the current trading day, and horizontal lines are drawn at this price level, as well as at pip-based distances above and below it.
The pip distance is calculated using the Pip Interval setting and can be adjusted for any pair. For example, a 225-pip interval would create lines at 225 pips above and below the daily open.
The indicator dynamically updates every minute to reflect new daily opens and adjustments for each trading day.
Lines are drawn using the HLine (horizontal line) objects in MetaTrader 5, making them easy to spot and follow.
Parameters:
Pip Interval: Defines the pip distance for upper and lower levels (e.g., 225 pips). This affects how far above and below the daily open the levels are drawn.
Number of Levels: Sets how many upper and lower levels are drawn.
JPY Pairs: An option to adjust the pip value for JPY pairs (0.1 pip for JPY pairs vs. 0.01 pip for others).
Line Colors: Customize the colors for the daily open, upper levels, and lower levels.
Style & Width: Adjust the style (solid/dashed) and width of the lines to match your preferences.
Индикаторы и стратегии

Trailing Monster StrategyTrailing Monster Strategy
This is an experimental trend-following strategy that incorporates a custom adaptive moving average (PKAMA), RSI-based momentum filtering, and dynamic trailing stop-loss logic. It is designed for educational and research purposes only, and may require further optimization or risk management considerations prior to live deployment.
Strategy Logic
The strategy attempts to participate in sustained price trends by combining:
- A Power Kaufman Adaptive Moving Average (PKAMA) for dynamic trend detection,
- RSI and Simple Moving Average (SMA) filters for market condition confirmation,
- A delayed trailing stop-loss to manage exits once a trade is in profit.
Entry Conditions
Long Entry:
- RSI exceeds the overbought threshold (default: 70),
- Price is trading above the 200-period SMA,
- PKAMA slope is positive (indicating upward momentum),
- A minimum number of bars have passed since the last entry.
Short Entry:
- RSI falls below the oversold threshold (default: 30),
- Price is trading below the 200-period SMA,
- PKAMA slope is negative (indicating downward momentum),
-A minimum number of bars have passed since the last entry.
Exit Conditions
- A trailing stop-loss is applied once the position has been open for a user-defined number of bars.
- The trailing distance is calculated as a fixed percentage of the average entry price.
Technical Notes
This script implements a custom version of the Power Kaufman Adaptive Moving Average (PKAMA), conceptually inspired by alexgrover’s public implementation on TradingView .
Unlike traditional moving averages, PKAMA dynamically adjusts its responsiveness based on recent market volatility, allowing it to better capture trend changes in fast-moving assets like altcoins.
Disclaimer
This strategy is provided for educational purposes only.
It is not financial advice, and no guarantee of profitability is implied.
Always conduct thorough backtesting and forward testing before using any strategy in a live environment.
Adjust inputs based on your individual risk tolerance, asset class, and trading style.
Feedback is encouraged. You are welcome to fork and modify this script to suit your own preferences and market approach.

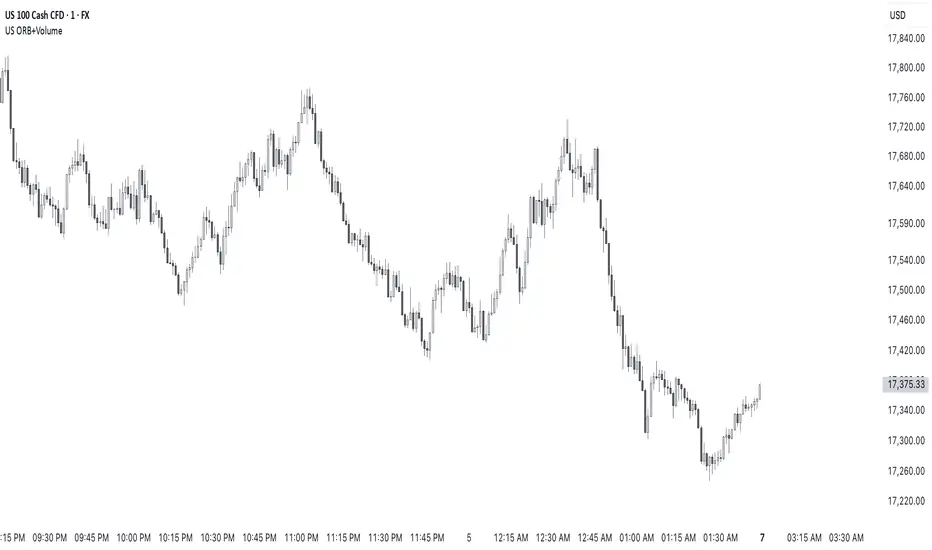
US Market ORB with Volume SpikeHow to Use:
Apply to US stocks/ETFs (works best on 1-5 minute charts)
Default settings work for NYSE/NASDAQ market hours
Blue background shows ORB formation period
Orange highlights indicate volume spikes
Buy/Sell signals appear at breakouts with volume confirmation
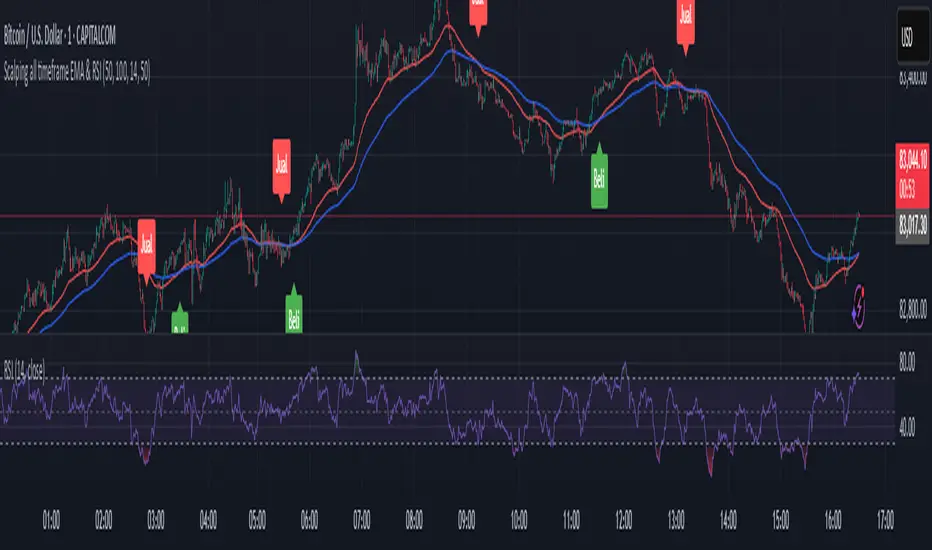
Scalping all timeframe EMA & RSIEMA 50 and EMA 100 combined with RSI 14
Should also be accompanied by the RSI 14 chart.
With the following conditions:
IF the EMAs are close but not crossing:
* Be prepared to take a Sell position if the first Bearish Candlestick crosses the lowest EMA, and the RSI value is equal to or below 40.
* Be prepared to take a Buy position if the first Bullish Candlestick crosses the highest EMA, and the RSI value is equal to or above 60.
IF the EMAs are overlapping and crossing:
* Be prepared to take a Sell position if the first Bearish Candlestick crosses both EMAs, and the RSI value crosses below 50.
*Be prepared to take a Buy position if the first Bullish Candlestick crosses both EMAs, and the RSI value crosses above 50.
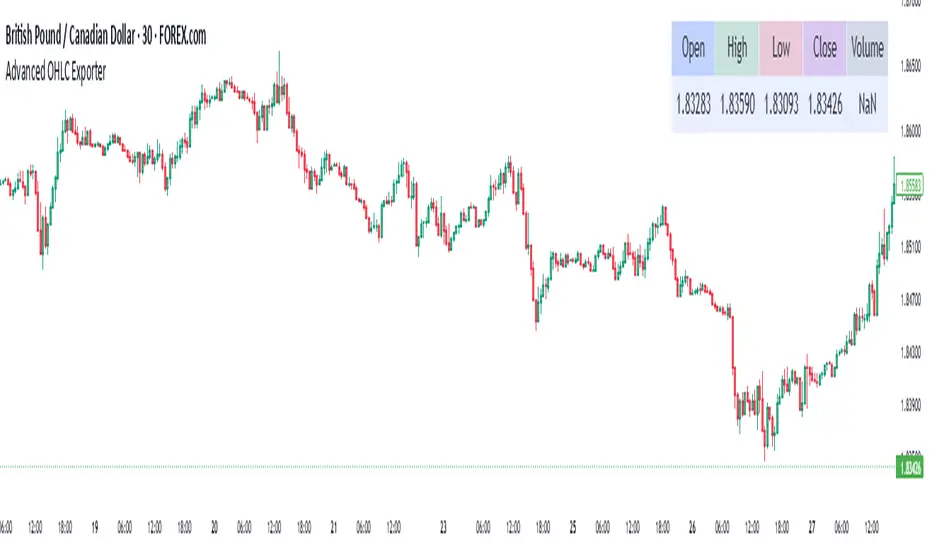
Advanced OHLC ExporterThis Pine Script indicator provides one-click export of candlestick data (OHLC + Volume) from any TradingView chart. It displays the current candle's values in a clean table while ensuring all visible historical data is available for export in CSV format.
Key Features
📊 Visual Data Display
Real-time OHLC table in the top-right corner.
Color-coded values for quick analysis (green=high, red=low).
Volume shown in standardized formatting.
Data Export Ready
All plotted values appear in TradingView's Data Window.
Right-click → "Export Data" to save:
Open, High, Low, Close (OHLC) prices
Trading volume
Timestamps for each candle
⚙️ Customizable Output
Works on any timeframe (1m to 1M)
Compatible with: Forex, Stocks, Crypto, Futures
How Traders Use This
Technical Analysts - Export clean datasets for external analysis.
Backtesters - Quickly gather historical price data for strategy development.
Researchers - Study candlestick patterns with precise numerical data.
Nifty Range % and Points by Time BlocksPine Script that gives you day-wise intraday range percentage for these 3 time blocks (9:16–10:45, 10:45–1:15, 1:15–3:15), we can:
Detect time blocks during the day
Track High/Low for each block
Calculate range % for each block:
\text{Range %} = \frac{(High - Low)}{\text{Previous Day Close}} \times 100
Plot / Label it on the chart at the end of each block

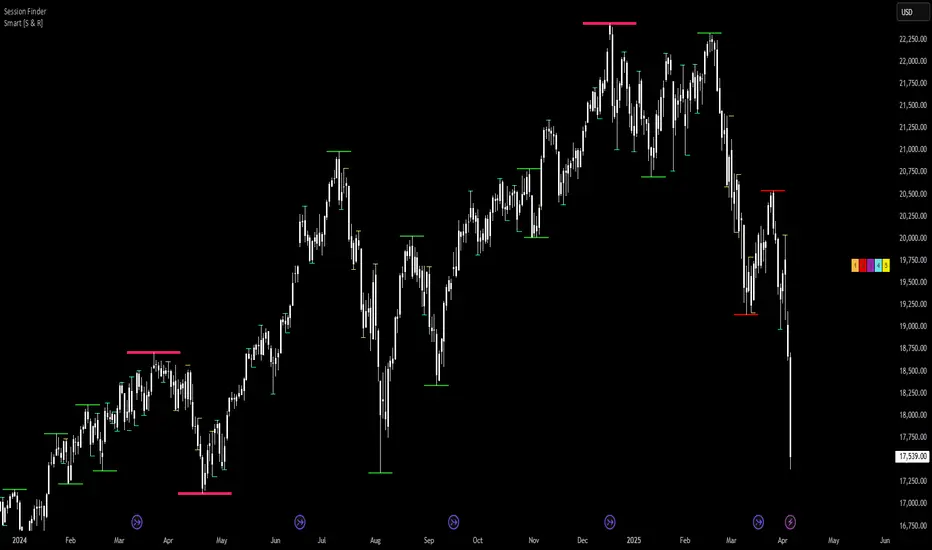
TQ's Support & Resistance(My goal creating this indicator): Provide a way to categorize and label key structures on multiple different levels so I can create a plan based on those observable facts.
The Underlying Concept / What is Momentum?
Momentum indicates transaction pressure. If the algorithm detects price is going up, that would be considered positive momentum. If the algorithm detects price is going down negative momentum would be detected.
The Momentum shown is derived from a price action pattern. Unlike my previous Support & Resistance indicator that used Super Trend, this indicator uses a unique pattern I created. On the first bar bearish momentum is detected a resistance Level is made at the highest point of the previous bullish condition. On the first bar bullish momentum is detected a support Level is made at the lowest point of the previous bearish condition. This happens on 5 different Momentum Levels, (short-term to long-term). I currently use this pattern to trade so the source code is protected.
What is Severity?
Severity is How we differentiate the importance of different Highs and Lows. If Momentum is detected on a higher level the Supply or Demand Level is updated. The Color and Size representing that Level will be shown. Demand and Supply Levels made by higher levels are more SEVERE than a demand level made by a lower level.
Technical Inputs
- to ensure the correct calculation of Support and Resistance levels change BAR_INDEX. BAR_INDEX creates a buffer at the start of the chart. For example: If you set BAR_INDEX to 300. The script will wait for 300 bars to elapse on the current chart before running. This allows the script more time to gather data. Which is needed in order for our dynamic lookback length to never return an error (Dynamic lookback length can't be negative or zero). The lower the timeframe the greater the number of bars need. For Example, if I open up a 1min chart I would enter 5000 as my BAR_INDEX since that will provide enough data to ensure the correct calculation of Support and Resistance levels. If I was on a daily chart, I would enter a lower number such as 800. Don't be afraid to play around with this.
- Toggle options (Close) or (High & Low) creates Support and Resistance Levels using the Lowest close and Highest close or using the Lowest low and Highest high.
Level Inputs
- The indicator has 5 Different Levels indicating SEVEREITY of a Supply and Demand Levels. The higher the Level the more SEVERE the Level.
Display Inputs
- You have the option to customize the Length, Width, Line Style, and Colors of all 5 different
- This indicator includes a Trend Chart. To Easily verify the current trend of any displayed by this indicator toggle on Chart On/Off. You also get the option to change the Chart Position and the size of the Trend Chart
How Trend Is being Determined?
(Close > Current Supply Level) if this statement is true technically price made a HH, so the trend is bullish.
(Close < Current Demand Level) if this statement is true technically price made a LL, so the trend is bearish.
- Fully customize how you display Market Structure on different levels. Line Length, Line Width, Line Style, and Line color can all be customized.
How it can be used?
(Examples of Different ways you can use this indicator): Easily categorize the severity of each and every Supply or Demand Level in the market (The higher Level the stronger the level)
: Quickly Determine the trend of any Level.
: Get a consistent view of a market and how different Levels are behaving but just use one chart.
: Take the discretion from hand drawing support and resistance lines out of your trading.
: Find and categorize strong levels for potential breakouts.
: Trend Analysis, use Levels to create a narrative based on observable facts from these Levels.
: Different Targets to take money off the table.
: Use Severity to differentiate between different trend line setups.
: Find Great places to move your stop loss too.
Sahid Strategy v2This script identifies potential buy/sell signals using:
Pivot Points - Detects swing highs/lows (price reversals)
Confirmation Filters - Reduces false signals using:
RSI (momentum)
Moving Average (trend direction)
Optional MACD (trend confirmation)
Key Features
Signal Type Trigger Conditions
BUY - Price makes a swing low (pivot)
Copy
- RSI ≤ 30 (oversold)
- Price above trend MA
- MACD bullish (optional) |
| SELL | - Price makes a swing high (pivot)
- RSI ≥ 70 (overbought)
- Price below trend MA
- MACD bearish (optional) |
Visual Signals
Green "BUY" labels below price bars
Red "SELL" labels above price bars
Purple trend line (20-period EMA/SMA)
Orange/blue circles showing raw pivot points
Optional Tools
Debug Table (top-right): Shows real-time:
RSI value
Price vs MA position
MACD status
Alerts - Triggers audible/visual notifications
Customization
Adjust in settings:
Pivot sensitivity (left/right bars)
RSI levels (30/70 by default)
MA type/length (20-period EMA/SMA)
Toggle MACD filter on/off
Best For: Swing trading in trending markets (1H-4H timeframes). Signals appear faster than classic pivot strategies but still require confirmation from other analysis tools.

Days Live CounterThis quite simply tracks how many days an asset has been on Trading View for.
The indicator calculates the day count based on the timestamp of the first visible bar in your current chart view. Since monthly charts generally load data from further back in time than daily or intraday charts, they'll show a larger day count.
This isn't a bug in the indicator - it's correctly counting the days from the first bar it can see in each timeframe.

Tetris with Auto-PlayThis indicator is implemented in Pine Script™ v6 and serves as a demonstration of TradingView's capabilities. The core concept is to simulate a classic Tetris game by creating a grid-based environment and managing game state entirely within Pine Script.
Key Technical Aspects:
Grid Representation:
The script defines a custom grid structure using a user-defined type that holds the grid’s dimensions and a one-dimensional array to simulate a two-dimensional board. This structure is used to track occupied cells, clear full rows, and determine stack height.
Piece Management:
A second custom type is used to represent the state of a tetromino piece, including its type, rotation, and position. The code includes functions to calculate the block offsets for each tetromino based on its rotation state.
Collision Detection and Piece Locking:
Dedicated functions check for collisions against the grid borders and existing blocks. When a collision is detected during a downward move, the piece is locked into the grid, and any complete lines are cleared.
AIgo-Driven Placement:
The script incorporates a simple heuristic to determine the best placement for the next tetromino. It simulates different rotations and horizontal positions, evaluating each based on aggregated column height, cleared lines, holes, and bumpiness. This decision-making process is encapsulated in an AI-like function that returns the optimal rotation and placement.
Rendering Using Tables:
The visual representation is managed via TradingView’s table objects. The game board is rendered with a bordered layout, while a separate preview table displays the next piece and the current score. Each cell is updated with text and background colors that correspond to the state of the game.
Execution Flow and Timing:
The main execution loop handles real-time updates by dropping pieces at set intervals and checking for game-over conditions. The code leverages persistent variables and time comparisons to control game speed and manage transitions between piece drops.
Executing:
Add the indicator to the chart
It starts playing itself till game over
There are no parameters to change in this version but the grid in the code directly
p.s. Sadly we have no interactive buttons in the current pinescript versions to play ourself, but its about the possibilitys what we could do ;-)
Maybe in a future version there is more possible, if i find time to enhance and expand the idea
Have fun :-)

Market Open Highlights (9:30 AM ET)This indicator zeroes in on the 9:30 AM Eastern Time market opens for NAS100 and US30, highlighting all market opens with a bold yet subtle yellow background. Tailored for precision backtesting, it uses TradingView’s timezone capabilities to pinpoint the exact 9:30 AM candle, skipping weekends to focus solely on U.S. equity market opens.
What It Does:
The script tracks the bar indices of all market opens at 9:30 AM ET, applying a semi-transparent yellow highlight to those candles. It’s a clean, efficient way to mark key session starts for analyzing price action or testing strategies.
How to Use It:
1. Apply the script to a chart of NAS100 (e.g., FX:NAS100) or US30 (e.g., FX:US30) in TradingView on any timeframe.
2. Set your chart timezone to "America/New_York" (Settings > Timezone/Sessions).
3. Scroll back through trading days to see the yellow highlights on the 9:30 AM candles.
4. While it functions across all timeframes, it’s optimized for 5-minute and 1-minute charts, where the 9:30 AM candle aligns precisely with the U.S. market open for detailed analysis.
5. Use it to study price behavior or refine strategies around this critical daily event.

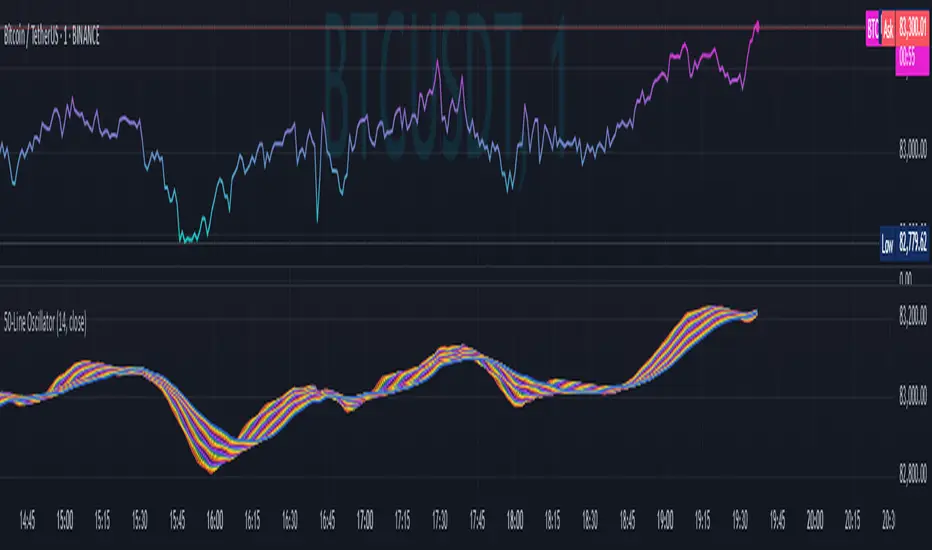
50-Line Oscillator // (\_/)
// ( •.•)
// (")_(")
25-Line Oscillator
Description:
The 25-Line Oscillator is a sophisticated technical analysis tool designed to visualize market trends through the use of multiple Simple Moving Averages (SMAs). This indicator computes a series of 26 SMAs, incrementally increasing the base length, providing traders with a comprehensive view of price dynamics.
Features:
Customizable Base Length: Adjust the base length of the SMAs according to trading preferences, enhancing versatility for different market conditions.
Rainbow Effect: The indicator employs a visually appealing rainbow color scheme to differentiate between the various trend lines, making it easy to identify crossovers and momentum shifts.
Crossovers Detection: The script includes logic to detect crossover events between consecutive trend lines, which can serve as signals for potential entry or exit points in trading.
Clear Visualization: Suitable for both novice and seasoned traders, the plots enable quick interpretation of trends and market behavior.
How to Use:
Add the indicator to your chart and customize the base length as desired.
Observe the rainbow-colored lines for trend direction.
Look for crossover events between the SMAs as potential trading signals.
Application: This indicator is particularly useful for swing traders and trend followers who aim to capitalize on market momentum and identify reversals. By monitoring the behavior of multiple SMAs, traders can gain insights into the strength and direction of price movements over various time frames.
RSI SiaThis script is a custom indicator for TradingView written in Pine Script version 5. It calculates the Relative Strength Index (RSI) and uses it to generate trading signals. Here's a breakdown of what the script does:
Key Features:
RSI Calculation:
The script calculates the RSI using a 14-period window.
It also calculates the momentum of the RSI over a 9-period window (rsi delta) and a simple moving average (SMA) of the RSI over a 3-period window (rsi sma).
Composite Index (CI):
The composite index is calculated as the sum of rsi delta and rsi sma.
Horizontal Lines and Zones:
Several horizontal lines are plotted at different levels (e.g., 20, 40, 60, 80, 120, 150, 180) to indicate overbought and oversold conditions.
Filled zones are created between certain levels to highlight areas of interest.
Moving Averages:
The script plots SMA and EMA of the RSI when Enable RSI ma is set to true.
It also plots moving averages of the composite index.
Crossover Signals:
The script detects bullish and bearish crossovers between the SMA and EMA of the RSI.
It plots shapes (labels) on the chart to indicate buy (BUY) and sell (SELL) signals based on these crossovers.
Usage:
Enable RSIma: This input allows you to enable or disable the plotting of RSI moving averages.
i1: This variable is used to adjust the vertical position of the composite index and its moving averages.
Visualization:
The RSI is plotted in black.
The RSI fast trigger line (SMA of RSI) is plotted in green when enabled.
The RSI slow trigger line (EMA of RSI) is plotted in orange when enabled.
The composite index and its moving averages are plotted in red, green, and orange.
Buy and sell signals are indicated with green and red labels, respectively.
This script can be used to identify potential trading opportunities based on RSI crossovers and the composite index.

Intraday Macro & Flow Indicator# IntraMacroFlow Indicator
## Introduction
IntraMacroFlow is a volume and delta-based indicator that identifies significant price movements within trading sessions. It generates signals when volume spikes coincide with quality price movement, filtered by RSI to avoid overbought/oversold conditions.
> **Note:** This indicator provides multiple signals and should be combined with additional analysis methods such as support/resistance, trend direction, and price action patterns.
## Inputs
### Volume Settings
* **Volume Lookback Period** (14) - Number of bars for volume moving average calculation
* **Volume Threshold Multiplier** (1.5) - Required volume increase over average to generate signals
* **Delta Threshold** (0.3) - Required close-to-open movement relative to bar range (higher = stronger movement)
### Session Configuration
* **Use Dynamic Session Detection** (true) - Automatically determine session times
* **Highlight Market Open Period** (true) - Highlight first third of trading session
* **Highlight Mid-Session Period** (true) - Highlight middle portion of trading session
* **Detect Signals Throughout Whole Session** (true) - Find signals in entire session
* **Session Time** ("0930-1600") - Trading hours in HHMM-HHMM format
* **Session Type** ("Regular") - Select Regular, Extended, or Custom session
### Manual Session Settings
Used when dynamic detection is disabled:
* **Manual Session Open Hour** (9)
* **Manual Session Open Minute** (30)
* **Manual Session Open Duration** (60)
* **Manual Mid-Session Start Hour** (12)
* **Manual Mid-Session End Hour** (14)
## How It Works
The indicator analyzes each bar using three primary conditions:
1. **Volume Condition**: Current volume > Average volume × Threshold
2. **Delta Condition**: |Close-Open|/Range > Delta threshold
3. **Time Condition**: Bar falls within configured session times
When all conditions are met:
* Bullish signals appear when close > open and RSI < 70
* Bearish signals appear when close < open and RSI > 30
## Display Elements
### Shapes and Colors
* Green triangles below bars - Bullish signals
* Red triangles above bars - Bearish signals
* Blue background - Market open period
* Purple background - Mid-session period
* Bar coloring - Green (bullish), Red (bearish), or unchanged
### Information Panel
A dynamic label shows:
* Current volume relative to average (Vol)
* Delta value for current bar (Delta)
* RSI value (RSI)
* Session status (Active/Closed)
## Calculation Method
```
// Volume Condition
volumeMA = ta.sma(volume, lookbackPeriod)
volumeCondition = volume > volumeMA * volumeThreshold
// Delta Calculation (price movement quality)
priceRange = high - low
delta = math.abs(close - open) / priceRange
deltaCondition = delta > deltaThreshold
// Direction and RSI Filter
bullishBias = close > open and entrySignal and not (rsi > 70)
bearishBias = close < open and entrySignal and not (rsi < 30)
```
## Usage Recommendations
### Suitable Markets
* Equities during regular trading hours
* Futures markets
* Forex during active sessions
* Cryptocurrencies with defined volume patterns
### Recommended Timeframes
* 1-minute to 1-hour (optimal: 5 or 15-minute)
### Parameter Adjustments
* For fewer but stronger signals: increase Volume Threshold (2.0+) and Delta Threshold (0.4-0.6)
* For more signals: decrease Volume Threshold (1.2-1.5) and Delta Threshold (0.2-0.3)
### Usage Tips
* Combine with trend analysis for higher-probability entries
* Focus on signals occurring at session boundaries and mid-session
* Use opposite signals as potential exit points
* Configure alerts to receive notifications when signals occur
## Additional Notes
* RSI parameters are fixed at 14 periods with 70/30 thresholds
* The indicator handles overnight sessions correctly
* Fully compatible with TradingView alerts
* Customizable visual elements
## Release Notes
Initial release: This is a template indicator that should be customized to suit your specific trading strategies and preferences.

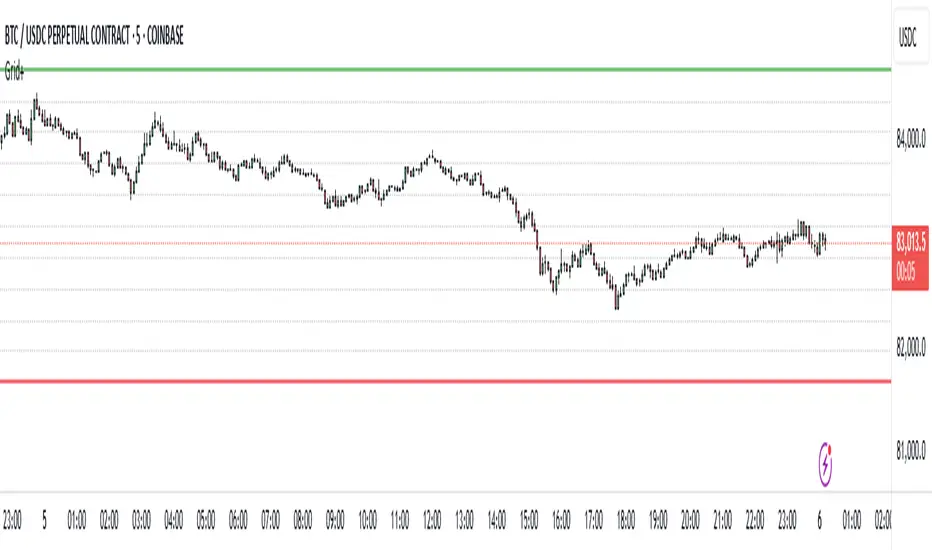
Grid Level Visualizer v1.0Overview
This indicator draws a customizable grid of horizontal price levels directly on your chart. It's designed to help traders visualize potential support and resistance zones, manage grid trading strategies, or simply divide a price range into equal segments. The script offers interactive controls, extensive customization options, and alert functionality.
Key Features:
Customizable Grid: Draws a grid based on user-defined Upper Price Bound and Lower Price Bound.
Interactive Bounds: Easily adjust the Upper and Lower bounds by dragging the corresponding lines directly on the chart (click the line first to select, then drag). Bounds can also be set numerically in the settings.
Adjustable Levels: Specify the total number of horizontal lines in the grid (Number of Grid Levels), including bounds.
Custom Styling: Independently configure the color, width, and style (Solid, Dashed, Dotted) for the boundary lines and the intermediate grid lines.
Price Labels: Optional display of price values for each grid level, positioned on the right side near the current bar.
Labels for boundary levels automatically inherit the boundary line colors.
Adjustable horizontal offset (Price Label Offset (X)) for labels.
Customizable text size (Text Size) and color (Price Text Color (Mid)) for mid-levels.
Grid Start Time: Define a specific date and time (Grid Start Time) from which the grid lines should start appearing on the chart (defaults to the beginning of the current month).
Line Extension: Grid lines automatically extend to the right margin of the chart.
Alert Condition: Provides a "Grid Level Cross" condition for creating custom alerts when price crosses any active grid level.
Alert Toggle: An option (Enable Alert Condition?) in the settings to enable or disable the availability of the "Grid Level Cross" condition when creating alerts.
Real-time Calculation: Uses calc_on_every_tick=true for responsive alert checking against the current price.
How to Use:
Add the "Improved Grid Level Visualizer" indicator to your chart.
Set Bounds: Adjust the Upper Price Bound and Lower Price Bound lines by clicking and dragging them on the chart, or set precise values in the indicator settings.
Set Levels: Define the Number of Grid Levels you need in the settings.
Set Start Time: Use the Grid Start Time input to control when the grid visualization begins.
Customize: Configure colors, line styles, label visibility, etc., in the settings panel.
Set Alerts (Optional): Follow the steps below.
Notes:
The grid levels are calculated purely based on the mathematical division of the specified price range. They do not automatically adapt to market structure unless you manually adjust the bounds.
When changing the Grid Start Time after the indicator has been running, you might need to refresh the chart or remove/re-add the indicator for the visual starting point to update correctly.
zigzag all timeThe indicator is applicable across all timeframes, meaning it can be used for short-term (e.g., minutes, hours) or long-term (e.g., days, weeks, months) trading strategies. This ensures that the analysis is versatile and adaptable to different trading styles.

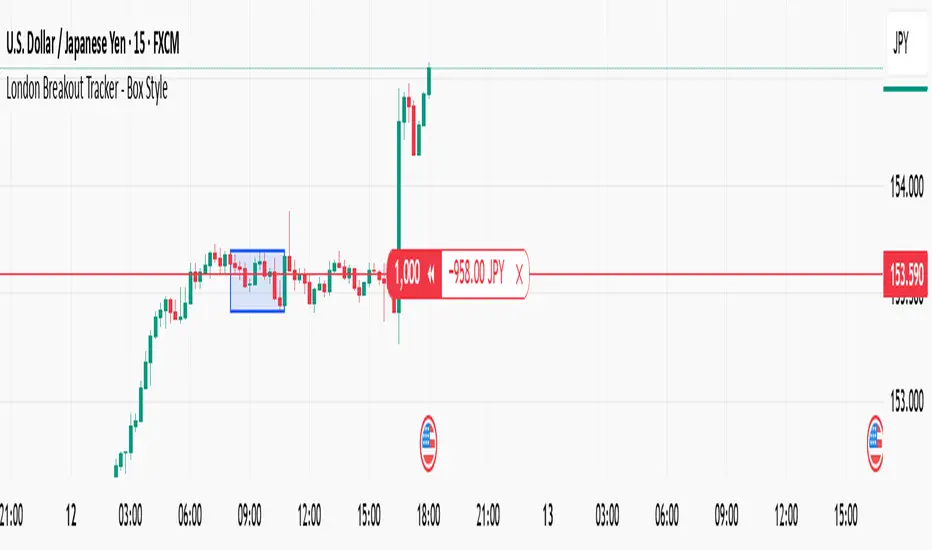
London Breakout Tracker - Box Style📊 London Breakout Tracker (Pine Script v6)
This script is designed to track the Asian session range and identify breakout opportunities when the London session begins. It highlights high-probability trade setups and helps avoid fakeouts or overly wide ranges.
🧱 1. Session Time Definitions (Adjusted for Kenyan Time)
The Asian session is defined as:
3:00 AM to 11:00 AM (Kenyan Time)
🔐 2. Asian Session High & Low
During the Asian session:
The script tracks the highest high and lowest low to define the range.
These are stored in variables: asianHigh and asianLow.
🧊 3. Box Drawing for the Asian Range
Once the Asian session ends:
A visual box is drawn around the session using box.new().
This box spans from the session start to end bars and from the high to low.
It helps visually see the range price must break out from.
🚨 4. Breakout Signals
After the Asian session:
A Long Breakout signal is generated if:
The candle closes above the Asian High.
A Short Breakout signal is generated if:
The candle closes below the Asian Low.
This corresponds to 00:00 to 08:00 UTC
These are shown with:
✅ Green up label for long breakouts
❌ Red down label for short breakouts
🧯 5. Fakeout Detection
If price breaks out but closes back inside the Asian range, it’s marked as a Fakeout:
Long Fakeout: Price breaks above high, then closes back below.
Short Fakeout: Price breaks below low, then closes back above.
These are marked with orange X-crosses above or below candles.
⚠️ 6. Wide Range Filter
If the Asian session range is too wide (e.g. > 40 pips), a gray background is drawn.
This warns you not to trade that day since breakouts from wide ranges are unreliable.
📣 7. Alert Conditions
The script can trigger alerts in TradingView when:
🔔 A Long or Short Breakout occurs
⚠️ A Fakeout is detected
You can set these up via the TradingView alert system.
🎯 Overall Purpose:
The script helps you:
Clearly see the Asian session range
Identify breakout opportunities at the London open
Avoid trading during fakeouts or wide-range sessions
Get alerted when breakout/fakeout conditions occur
RSI Trigger Count (30 Days) - Both SidesRSI Dual Trigger Counter (30 Days)
This indicator tracks both oversold ( crossunder ) and overbought ( crossover ) RSI events on a 30-minute chart, featuring:
Dual-Mode Selector:
Counts either RSI < 30 (oversold) or RSI > 70 (overbought) crossings
Toggle between modes via input menu
30-Day Rolling Count:
Displays total triggers in the last 30 days (e.g., "Times triggered (Oversold) ① 19")
Visual Alerts:
Red triangles ↓ for oversold crossunders
Green triangles ↑ for overbought crossovers
Customizable:
Adjustable RSI length (2-100) and thresholds (1-100)
Works on any timeframe (auto-scales calculations)
Purpose: Identifies frequent reversal signals for both buying dips (oversold) and selling rallies (overbought).

Nifty 1m EMA Pullback Scalper Signals
### **Master the Market with the Sniper Scalping Strategy for Nifty (1-Minute Timeframe)**
Unlock the power of precision trading with this expertly crafted **Sniper Scalping Strategy**, designed specifically for the Nifty index on a lightning-fast 1-minute timeframe. Perfect for traders who thrive on quick decisions and small, consistent profits, this strategy combines multiple indicators to deliver razor-sharp entries and exits—ideal for India’s dynamic market.
#### **Why This Strategy Stands Out**
- **Pinpoint Accuracy**: Harness the synergy of the **5 EMA and 10 EMA crossover** to lock onto the short-term trend, while the **Stochastic Oscillator (14,3,3)** times your entries and exits with surgical precision.
- **Fast and Effective**: Tailored for the 1-minute chart, this strategy capitalizes on Nifty’s volatility, targeting **10-point profits** with a tight **5-point stop-loss**—keeping your risk low and rewards high.
- **Trend + Momentum**: Blend trend-following (EMAs) with momentum signals (Stochastic) for a robust, multi-dimensional approach that cuts through market noise.
#### **How It Works**
- **Buy Signal**: Enter long when the 5 EMA crosses above the 10 EMA and the Stochastic rises above 20—catching the uptrend at its sweet spot.
- **Sell Signal**: Go short when the 5 EMA dips below the 10 EMA and the Stochastic falls below 80—riding the downtrend with confidence.
- **Exit Like a Pro**: Take profits at 10 points or when the Stochastic hits overbought/oversold extremes, ensuring you’re in and out before the market shifts.
#### **Perfect for Nifty Scalpers**
Built for the fast-paced world of Nifty trading, this strategy shines during high-volatility sessions like the market open or global overlaps. Whether you’re a beginner honing your skills or a seasoned trader seeking consistency, the Sniper Scalping Strategy offers a clear, actionable framework to scalp profits with discipline and precision.
#### **Get Started**
Test it in a demo account, refine it to your style, and watch your scalping game soar. Trade smart, stay focused, and let the Sniper Scalping Strategy turn Nifty’s 1-minute moves into your edge!

Liquidity Volume Panel Liquidity Volume Panel – Precision Tool for Scalpers & Intraday Traders
This panel is designed to help traders quickly identify volume-driven moves, liquidity events, and fair-value zones. It combines classic volume analysis with enhanced tools like RVOL and VWAP deviation bands, making it ideal for scalping, momentum trading, and intraday strategies.
🔍 Included Features:
✅ Relative Volume (RVOL) Indicator
Displays current volume in relation to its 20-period average – excellent for spotting low-activity zones or high-pressure breakouts.
✅ Dynamic Volume Coloring & Spike Detection
Color-coded volume logic highlights normal, strong, and extremely high volume, with visual markers for volume spikes (>200% of average).
✅ VWAP with ±1σ & ±2σ Bands
Industry-standard deviation bands show overbought/oversold conditions and dynamic support/resistance based on volume-weighted pricing.
✅ Background Highlighting
Subtle orange background alerts you when volume surges beyond extreme levels – making liquidity clusters instantly recognizable.
Usage:
Use this panel as a decision-making tool for entries, reversals, or breakouts – especially in fast-moving markets.
Best used on lower timeframes for precision scalping.

Double RSI OscillatorThe Double RSI Oscillator
Hello Gs,
I came back from the dead and tried to see what a little tweak to RSI could do, and I think it is quite interesting and might be worth checking out.
Warning:
This indicator has lots of false signals unfortunatly
How does the DRSI Oscillator work?
Very simple, the DRSI oscillator at the very base is just 2 RSIs that should smooth each other out, making a smoother trend signal generation for trend analysis. One RSI is set to have lower values, by considering the lowest point of the price, and one RSI is set to have higher values using pretty much the same thing. The trend changes from positive to negative if RSI with higher values crosses negative treshhold, and from negative to positive if RSI with lower value crosses positive treshhold. On top of this I added some additional settings to smooth or speed it further, if these were a good idea, I guess only time will tell :D.
Settings
Here is a guide of what setting changes what and how it might be suitable for you:
RSI Optimism length: length of the RSI with higher values (higher values will be better for longer term, lower for medium term)
RSI Pesimism length: length of the RSI with lower values (higher values will be better for longer term, lower for medium term)
Positive treshhold: The value RSI pesimism needs to pass in order to change trends (in case of using RSI avg. the value the average needs to pass), making this higher can give you faster signals, but expect more false ones
Negative treshholds: The value RSI optimism needs to pass in order to change trends (in case of using RSI avg. the value the average needs to pass), lowering this can give you faster signals, but expect more false ones
Smoothing type: Select the type of smoothing (or none) to smooth your signals as you want, this one you need to play around with.
Smoothing length: The length of your smoothing method (if none is selected it wont change anything)
Use RSI average instead: self-explanatory, go figure
Above/Below Mean Trend: Changes the way trend logic works
Why consider using this indicator?
The DRSI Oscillator is a tool that has huge flexibility (due to tons of settings that base RSI doesnt, like trend treshholds), and is smoother allowing traders and investors to get high quality or high speed signals, allowing great entries and exits

Session Coloring Bar with ICT Macro [dani]The Session Coloring Bar is customizable Pine Script indicator designed to visually enhance your charts by applying unique colors to specific trading sessions or timeframes. This tool allows traders to easily identify and differentiate between macro sessions (e.g., 24-hour cycles) and custom-defined sessions (e.g., Session A, Session B), making it ideal for analyzing market activity during specific periods.
In the context of trading, the term "ICT Macro" , as discussed by Michael J. Huddleston (ICT), refers to specific timeframes or "windows" where market behavior often follows predictable patterns. Traders typically focus on the last 10 minutes of an hour and the first 10 minutes of the next hour (e.g., 0150-0210 , 0050-0110 , or 0950-1010 ) to identify key price movements, liquidity shifts, or market inefficiencies.
This script highlights these macro timeframes, enabling traders to visually analyze price action during these critical periods. Use this tool to support your strategy, but always combine it with your own analysis and risk management.
With this indicator, you can:
Highlight Macro Sessions : Automatically color bars based on predefined 24-hour macro sessions.
Customize Session Settings : Define up to three custom sessions (A & B) with individual start/end times, visibility toggles, and unique bar colors.
Timeframe Filtering : Hide session coloring above a specified timeframe to avoid clutter on higher timeframes.
Personal Notes : Add comments to each session for better organization and quick reference.
Dynamic Color Logic : Bars are colored based on their direction (up, down, or neutral) within the active session.
How to Use:
Enable/Disable Sessions :
Use the Show Coloring toggle to enable or disable session coloring for Macro, Session A, Session B, or Session C.
Set Session Times :
Define the start and end times for each session in the format HHMM-HHMM (e.g., 1600-0930 for an overnight session).
Choose Colors :
Assign unique colors for upward (Bar Up) and downward (Bar Down) bars within each session.
Adjust Timeframe Visibility :
Use the Hide above this TF input to specify the maximum timeframe where session coloring will be visible.
Add Notes :
Use the Comment field to add personal notes or labels for each session.
Example Use Cases:
Overnight Sessions :
Highlight overnight trading hours (e.g., 1600-0930) to analyze price action during low liquidity periods.
Asian/European/US Sessions : Define separate sessions for major trading regions to track regional market behavior.
Macro Analysis : Use the predefined 24-hour macro sessions to study hourly price movements across a full trading day.
Disclaimer:
The Session Coloring Bar is not a trading signal generator and does not predict market direction or provide buy/sell signals. Instead, it is a visualization tool designed to help you identify and analyze specific trading sessions or timeframes on your chart. By highlighting key sessions and their corresponding price movements, this indicator enables you to focus on periods of interest and make more informed trading decisions.
Thank you for choosing this indicator! I hope it becomes a valuable part of your trading toolkit. Remember, trading is a journey, and having the right tools can make all the difference. Whether you're a seasoned trader or just starting out, this indicator is designed to help you stay organized and focused on what matters most—price action. Happy trading, and may your charts be ever in your favor! 😊

Accumulation-Distribution CandlesThis structural visualization tool maps each candle through the lens of Effort vs. Result, blending Volume, Range, and closing bias into a normalized pressure score. Candle bodies are dynamically color-coded using a five-tier system—from heavy accumulation to heavy distribution—revealing where energy is building, dispersing, or neutral. This helps to visually isolate Markup, Markdown, Re-accumulation, and Distribution at a glance.
The indicator calculates a strength score by multiplying price result (close minus open) by effort (volume or price range), smoothing this raw value using a Fibonacci-based EMA. (34 for standard, 55 for crypto; the higher crypto value acknowledges that 24/7 trading offers more hours per week or month than trad markets.) The result is standardized against its rolling deviation and clamped to a range. This score determines the visual tier:
• 💙 Dark Blue = heavy Accumulation (strong upward result on strong effort)
• 🩵 Pale Blue = mild Accumulation
• 🌚 Gray = neutral (low conviction or balance)
• 💛 Pale Yellow = mild Distribution
• 🧡 Deep Yellow = heavy Distribution (strong downward result on strong effort)
The tool is optimized for the 1D chart, where Wyckoff phases are most clearly expressed. However, it adapts well to lower timeframes when used selectively. Traders may hide the body coloring and enable only zone highlighting to preserve other candle overlays such as SUPeR TReND 2.718, which offers directional clarity and trend duration. This combination is especially useful on intraday charts (15m–1H) where microstructure matters but visual clutter must be avoided.
When used alongside other Volume overlays (such as the OBVX Conviction Bias) or Volatility indicators (such as the Asymmetric Turbulence Ribbon (ATR)), this indicator adds confluence to directional setups by contextualizing pressure with Volatility. For example: compression zones marked by ATR may align with persistent pale blue candles—indicating quiet Accumulation before expansion.
Optional Overlays:
Normally ON -
• 📌 Pin Bars , filtered by volume, to isolate wick-dominant reversals from key zones
• 💪🏻 Strong-Body Candles — fuchsia candles w/ high body-to-range ratio reflect conviction
• 🧯 Wick Absorption Candles — red candles w/ long wicks and low closing strength indicate failed pushes or absorbed breakouts
• 🟦/🟧 Zone Highlighting for candles above a defined Accumulation/Distribution threshold
Normally OFF -
• 🔺 Fractals (5-bar) to map swing pivots by underlying pressure tier (normally OFF)
• 🟥/🟩 Engulfing patterns, filtered by directional conviction (normally OFF)
The Pin Bar strategy benefits most from the zone logic—when a bullish pin bar appears in an Accumulation zone (esp. pale or dark blue), and Volume exceeds its rolling average, it may mark a spring or failed breakdown. Conversely, bearish pins in Distribution zones can mark rejection or resistance.
This is not a signal engine—it’s a narrative filter designed to slot cleanly into a multi-layered workflow of visual structure and informed execution. Use it to identify bias and phase. Then deploy trade triggers from tools like SUPeR TReND 2.718, or the liquidity flows shown the The Silver Lining or the AltSeasonality - MTF indicators, for example. The candle colors tell you who’s in control—the other tools tell you when to act.
